

TradeQuantiX Portfolio Update: 6/30/2025
My equity curve is rocketing to new highs!


Welcome to the “Systematic Trading with TradeQuantiX” newsletter, your go-to resource for all things systematic trading. This publication will equip you with a complete toolkit to support your systematic trading journey, sent straight to your inbox. Remember, it’s more than just another newsletter; it’s everything you need to be a successful systematic trader.
Introduction:
It's that time again—another entry in the TradeQuantiX Portfolio Journal. Every few months, I share an update on my portfolio's performance, along with insights into other trading and non-trading aspects of my life. In this update, I review a few things:
My portfolio's performance
Share recent Substack growth
Share a new data manipulation technique I’ve began developing
Share a technique for switching off non-performing systems
Look at some winning and losing trades
Let’s get into it!
If you missed the last portfolio update you can check it out here:
TradeQuantiX Portfolio Update: 5/14/2025

It’s been a minute since I’ve written a portfolio journal, so I figured it was about time to write another. This will be a quick one, but I’ll give an overview of a few things going on with my portfolio and life since I last checked in. This article will cover the following:
Portfolio Performance Update:
In my last portfolio update back in May, I was just beginning to recover from a large drawdown. Now, two months later, I've not only reached new equity highs but surpassed my previous high by a large margin. To be honest, recent performance has been exceptional, there’s no other way to say it. You can view my portfolio equity curve in the plot below.

My portfolio’s equity curve has been almost unbelievable for the past month or so, resembling a near-perfect upward trajectory with very few red days. While my performance shows some correlation with the broader market—particularly in the timing and magnitude of drawdowns—my upward swings are significantly amplified compared to the general market.
This correlation makes sense, as I trade many trend and momentum systems, which often experience drawdowns in sync with the general market. However, once the bottom of a drawdown is reached, these systems tend to propel my portfolio to new highs and beyond, riding the wave of recovering trends.
Trend and momentum strategies keep me invested in the best-performing stocks, which tend to surge out of drawdowns to new highs much sooner and with much greater magnitude than the general market. For instance, while the S&P 500 (SPY) is just shy of its all-time high, my portfolio has soared approximately 20% above its previous all time highs. I can’t complain about that.
Hitting all-time highs feels exhilarating, but I work hard to temper my excitement. I constantly remind myself that a new high is just one day away from the start of a new drawdown. The next drawdown could begin tomorrow—I never know. This uncertainty is why systematic trading always keeps you on your toes.
At this stage in my trading career, I’ve grown comfortable with drawdowns. They act like a cleansing mechanism for my portfolio, as my systems offload underperforming stocks and retain only the strongest performers. It’s like a reset that strengthens my holdings. You can compare my drawdown periods to the S&P 500’s performance in the plot below.

As evident from the drawdown plot, the timing and magnitude of my portfolio’s drawdowns closely align with those of the S&P 500. However, my equity curve reveals that my upside performance far outpaces the S&P 500.
My portfolio has managed to keep downside volatility in line with the broader market while amplifying upside volatility well beyond the general market’s gains. Upwards volatility is the good volatility!
As I’ve mentioned, I’ve grown comfortable with drawdowns at this point in my trading career. When you kick off your systematic trading journey with a $25,000 loss followed by a two-year drawdown, you develop an almost psychopathic resilience to losses. Sure, losing money isn’t fun, but it’s nothing new for me, I’ve experienced drawdowns many times before.
More importantly, I trust my systematic trading portfolio. I trust that it is strategically positioning me to capitalize on the market’s next upward move. My systems are designed to ensure that when market strength returns, I’m ready to ride the markets to new highs. I do have some systems that benefit from market sell offs too, but these more or less just keep my portfolio afloat. The bulk of the gains come from the long-side momentum and trend systems
I’ve also created a new plot showcasing the Sharpe ratio of my portfolio, calculated on a rolling 50-day basis. This plot highlights how the Sharpe ratio fluctuates over time. Recently, it skyrocketed as my portfolio emerged from drawdowns, reflecting strong risk-adjusted returns.
While seeing the 50-day rolling Sharpe ratio is interesting, my focus is more on the average Sharpe ratio over time. Currently, my portfolio’s average Sharpe ratio stands at 2.18, a value I’m thrilled with. Especially since this Sharpe ratio reflects real, out-of-sample live performance. You can see the rolling 50-day Sharpe ratio plot below.

Some systematic trading purists might argue that my portfolio exhibits too much volatility, claiming that a truly skilled systematic trader would have a more stable Sharpe ratio and fewer drawdowns with a lesser magnitude. To them, I say: show me your real, out-of-sample results.
I achieve my performance with less than five minutes of daily effort, running my systems each morning then going on with my day, not worrying about trading until tomorrow when I have to run my systems again. I’m perfectly fine with a bit of volatility if it means I don’t have to babysit my trading systems all day.
Non-Portfolio Related Performance Updates:
While my trading performance remains the focus of these updates, I also enjoy sharing personal milestones and other trading related achievements from time to time.
Substack Growth:
I’m thrilled to announce that this Substack publication has surpassed 2,000 subscribers—a milestone I never imagined reaching when I launched it nine months ago. So, thank you to all of you for your support in reaching this milestone! Systematic trading can be a lonely endeavor. Often times it’s just me and my computer, so having a community to write to and occasionally connect with makes a huge difference.
I will say though, I wish my portfolio’s equity curve was as consistently smooth as my Substack’s subscriber growth!

Monte Carlo Engine:
Another non-performance-related update: I’ve started developing a new Monte Carlo engine to enhance robustness testing of my trading systems. This engine can do multiple things, such as:
Modify time series data to apply noise to the open high low and/or close
Modify time series data to apply drift to the data based on random walk
Modify time series data to shift a stocks timeseries forward or backwards in time
This allows me to create realistic synthetic stock data I can test with. This approach effectively creates additional out-of-sample data I can use for validating system robustness.
I’ve been experimenting with the Monte Carlo engine recently and it’s been pretty helpful with my system development. In the upcoming portfolio development series I’ve been working on, one of the articles will explore how I use different Monte Carlo techniques generated by this engine to robustness test a trading system.
One technique I’m considering is to develop systems using the synthetic Monte Carlo data, then validate the systems against real historical data for out-of-sample testing. This method could significantly reduce the risk of curve-fitting and would give me access to a broader dataset for development and testing. More to come here.

Ranking System Approach:
I recently discovered an intriguing technique mentioned in a podcast with Cesar Alvarez, a well-known systematic trader. Cesar employs a unique systematic trading approach where, every quarter, he rotates out underperforming systems and replaces them with higher-performing ones in his portfolio.
This system rotation is done systematically. He has a governing ranking system that ranks all of his individual trading systems. I thought this was a very cool concept. Inspired by this, I’ve started to develop and test with a similar approach. I believe this methodology could be a powerful way to ensure my portfolio consistently trades only the top-performing strategies. While I won’t implement it exactly as Cesar does, the approach I am developing is closely related—let me explain.
I’ve always been cautious about mean reversion strategies, as I find them prone to overfitting during backtesting and then underperform during out-of-sample testing. This is why I currently trade only a few mean reversion systems. I’d like to incorporate more mean reversion strategies into my portfolio but have hesitated due to concerns about their reliability in future unseen markets.
Cesar’s ranking approach potentially offers a solution. If I develop, say, 10 mean reversion systems, I can track and rank their performance over time during live trading. If a mean reversion system begins to lag relative to the others, it naturally falls to the bottom of the ranking. I can then set a threshold, such as excluding the bottom three systems from trading.
This mechanism would automatically phase out a failing mean reversion system and preference the winning systems. I would not use this technique on all of my portfolio, but rather just short term mean reversion systems.
This technique is exciting because it provides a systematic way to deactivate underperforming systems, making me more confident about trading mean reversion strategies. I’m eager to test this approach and see how it performs. I’ll keep you updated on the results! See the link below for the podcast I’m referring to:

Noteworthy Trades:
The final update I want to share is a showcase of some noteworthy trades some of my trading systems currently hold. Recently, I’ve had several big winners, with a few individual positions growing to nearly 10% of my portfolio’s equity.
I’ve included screenshots from my brokerage account below to highlight some of these trades. In the screenshots, the green highlighted area represents open profits, while anything below that green region indicates open losses.

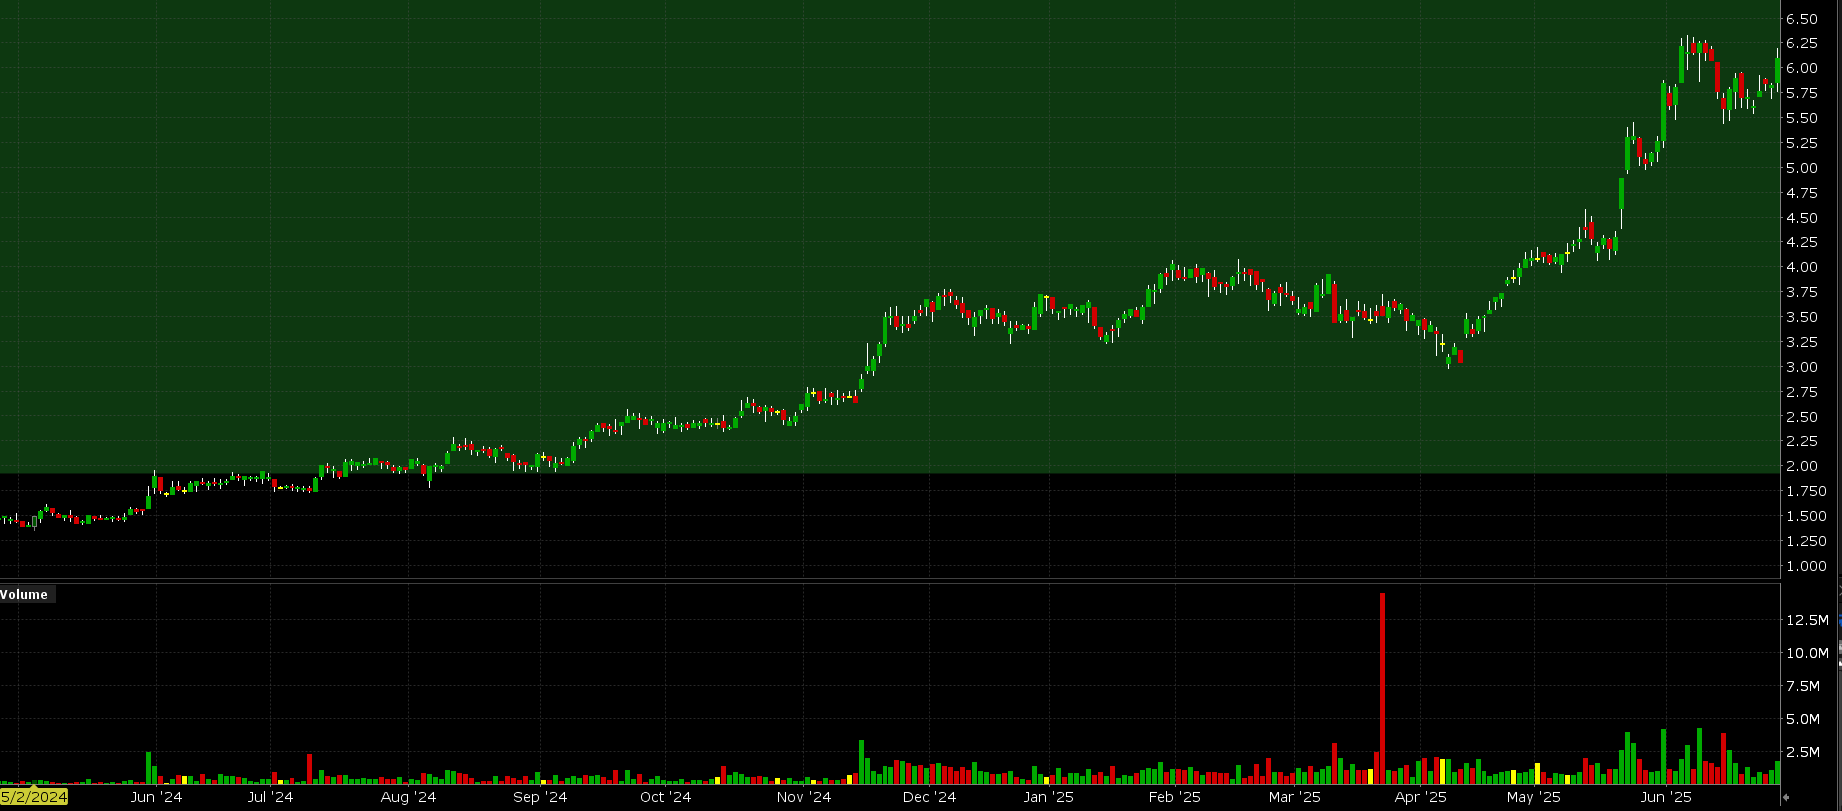


The image below is of a recently closed short position I held for 1 day. The small red and blue tick marks indicate what I entered and exited the short.
You can see on the second to last large red bar my system shorted at around $7.40, then covered the position the next open around $3.75. That’s a quick ~50% profit overnight. I can’t complain about that!
Sometimes shorting is fun like that, other times you end up at a 150% loss overnight; that’s the game you play shorting small cap stocks.

Not all of my trades are big winners of course. I also have some real laggards in the portfolio which are noisy and not really doing anything productive. Some might say:
“If they are such laggards, why not just sell the positions?”
Great question.
It’s because I’m a systematic trading purist.
I tested and validated these trading systems, and historically these systems have not had me monkeying with the trades, so I’m not going to mess with the trades going forward in time either. I’ll hold these trades until the system says to sell them. That’s the fun part of being a systematic trader, your data backed systems control your portfolio, not you and your emotional human mind.
See the images below for some lagging positions that are currently sitting at a small loss.


Conclusions:
Alright, that’s it for this entry into the TradeQuantiX Portfolio Journal. I’m very excited to have hit new highs recently, but am ready for the next drawdown right around the corner. As I mentioned, drawdowns don’t really faze me anymore—not after that $25,000 two-year drawdown I experienced when I first started.
Outside of my trading portfolio, it’s unbelievable that I’ve hit 2,000 subscribers on Substack. Nine months ago, I didn’t think anyone would care what I had to say, so thank you for proving me wrong! Trading’s a lonely game—just me and my screen most days—so having you all to share this with means a lot.
Systematic trading is never boring. One day you’re at a high, the next you’re bracing for a drawdown. That’s just how it goes. I’ll keep tinkering, testing, and improving my portfolio and will share any big updates along the way. Thanks for reading—happy trading!
Do you have ideas/suggestions for future articles? Let me know what you want to read about by clicking the button below and submitting your suggestions. Your suggestions are greatly appreciated as they help tailor this newsletter to what you want to read about.
🔥🔥🔥🔥🔥