


Welcome to the “Systematic Trading with TradeQuantiX” newsletter, your go-to resource for all things systematic trading. This publication will equip you with a complete toolkit to support your systematic trading journey, sent straight to your inbox. Remember, it’s more than just another newsletter; it’s everything you need to be a successful systematic trader.
Introduction:
Let’s wrap up this portfolio development series with the final article, part 11. In this article, we’ll construct a U.S. equities only portfolio. Hopefully, you can leverage the systems and ideas presented here to enhance your own systematic trading portfolio.
There are multiple systems that will be in this portfolio.
There is a momentum system which targets U.S. large caps, specifically the S&P 100, NASDAQ 100, and Russell 1000.
There is a trend system which also focuses on U.S. large caps, particularly the NASDAQ 100 and S&P 100, incorporating trends from both a low volatility and momentum effect perspective.
There are two mean reversion systems. The first mean reversion system concentrates on NASDAQ 100 and S&P 100 stocks. This is complemented by a second mean reversion system on a diversified basket of leveraged ETFs spanning equities, gold, bonds, and Bitcoin.
There is also a tactical asset allocation system. This system allocates to a collection of diversified ETFs with the goal of achieving steady, smooth returns.
On the short side, there are three distinct systems: a breakout momentum type shorting system, an ETF mean reversion shorting system, and a long-volatility hedging system.
This portfolio is going to comprise of many different system types, and as I’ve preached many times before, a portfolio with multiple different system types is the key to exceptional portfolio performance.
System Summaries:
Let’s briefly summarize the equity curves and performance statistics of the systems that will be included in the U.S. only portfolio. This summary will refresh your understanding of each system’s individual performance.
None of these systems are amazing on their own, but once we combined them into the final U.S. only portfolio, you’ll see how the combined performance is greater than the sum of its parts.
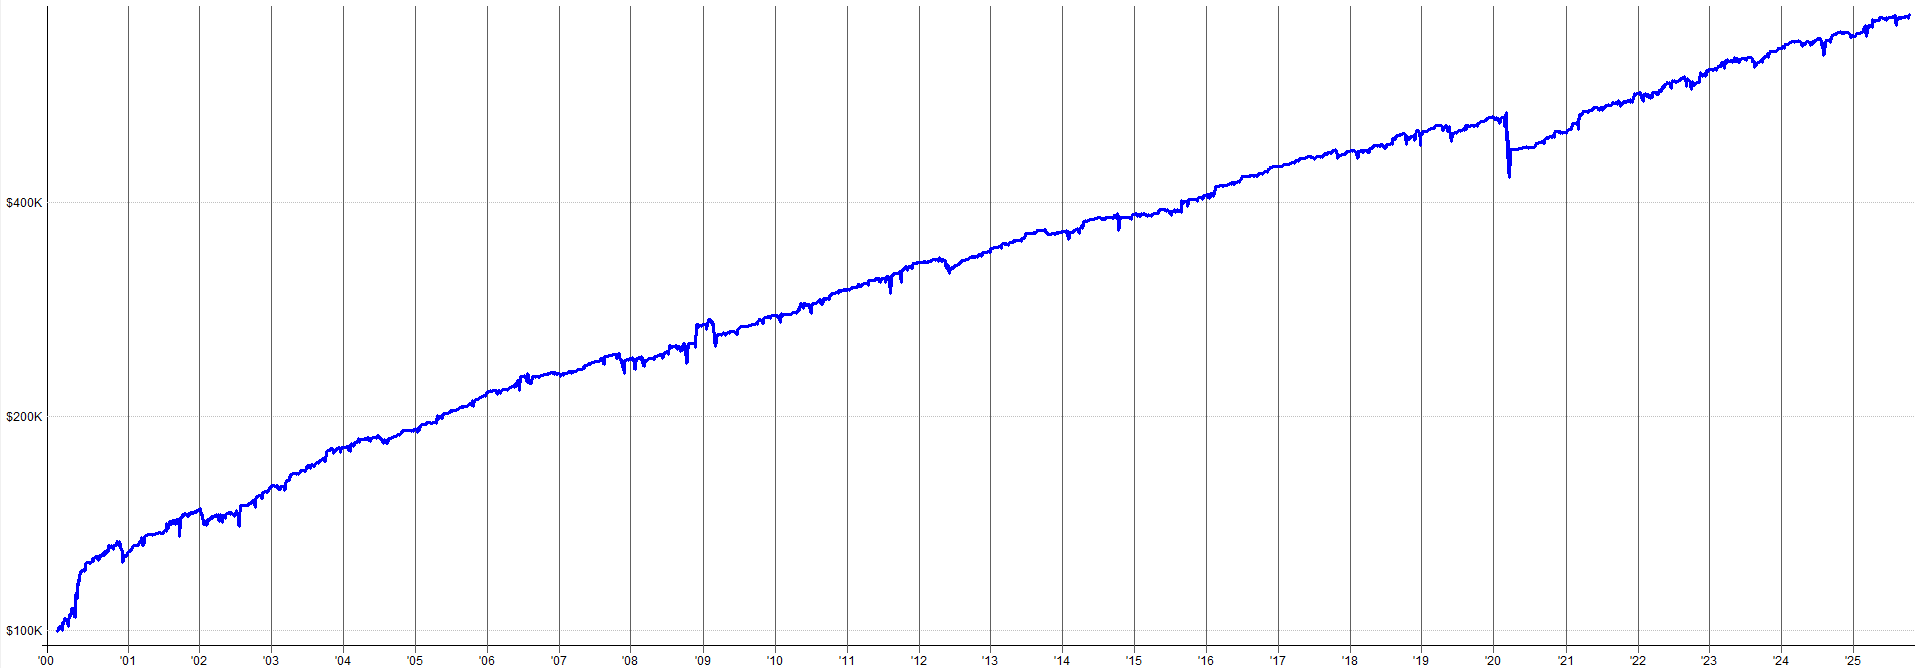
System 1: The U.S. large cap mean reversion system:


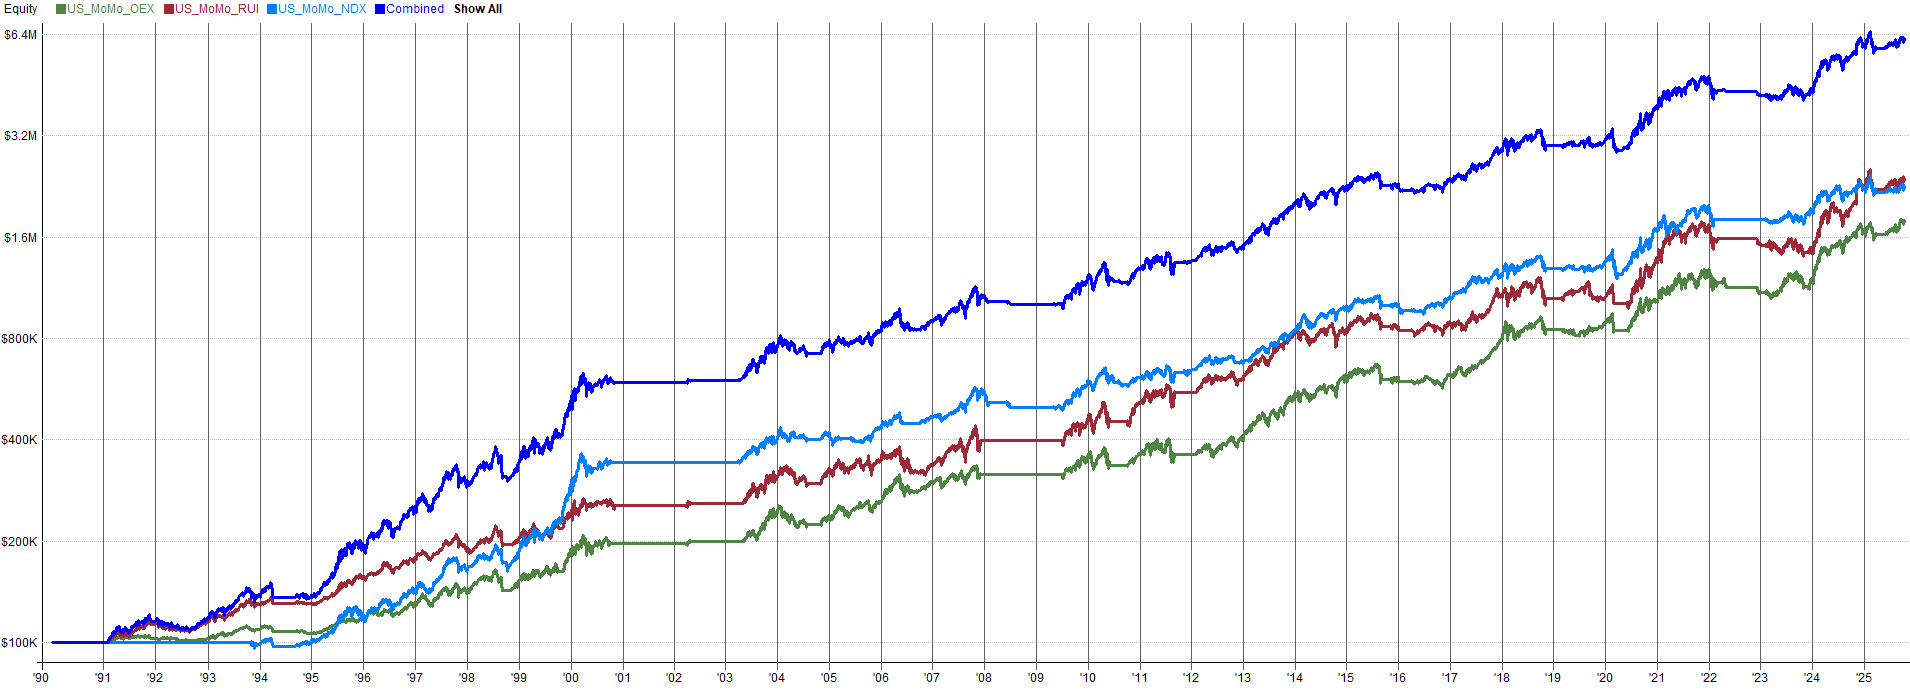
System 2: The set of U.S. large cap momentum systems:


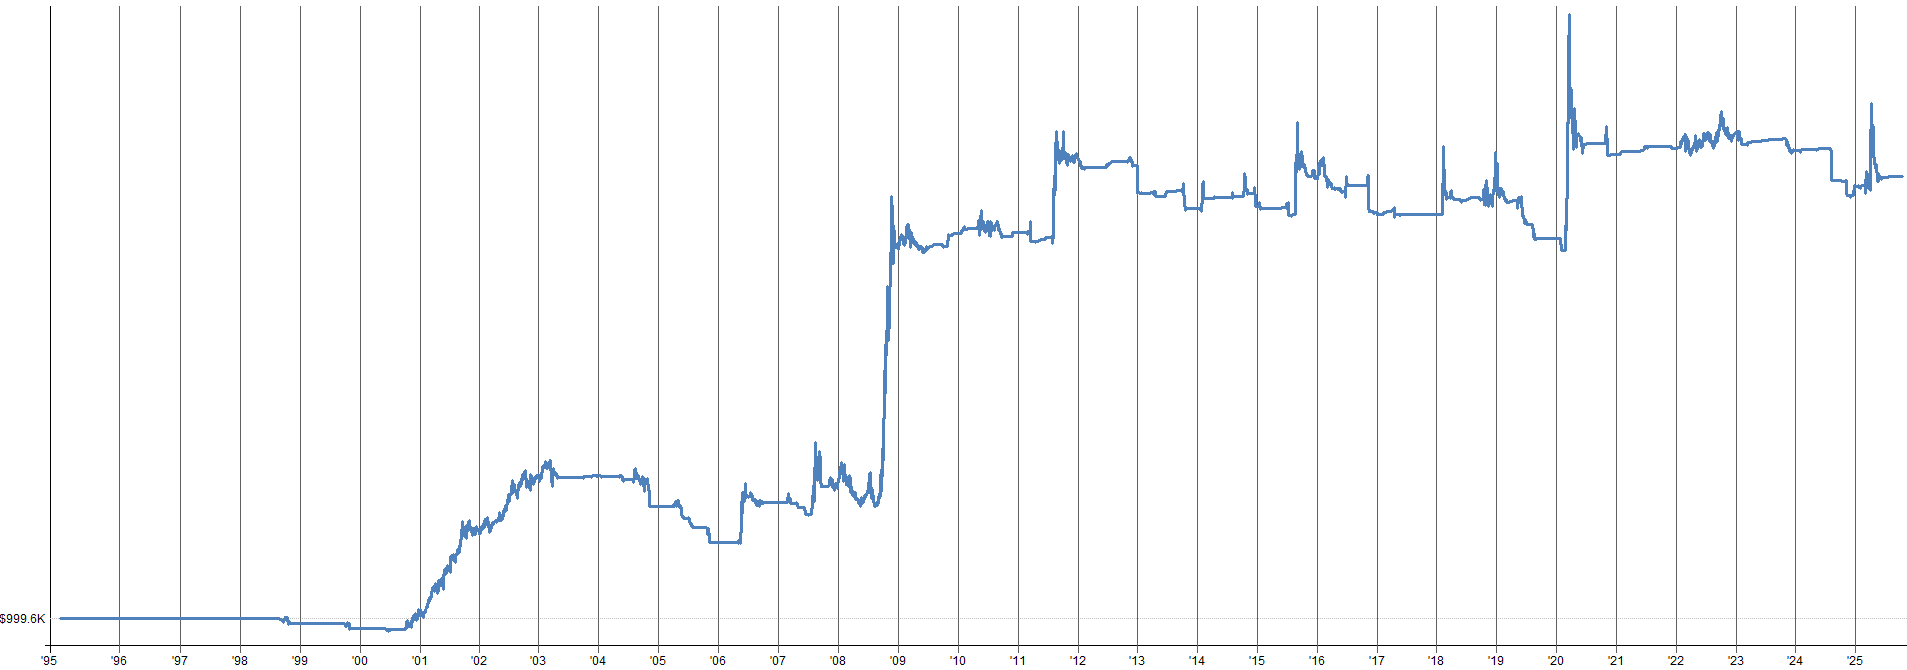
System 3: The set of U.S. hedging systems:


System 4: The U.S. ETF tactical asset allocation system:

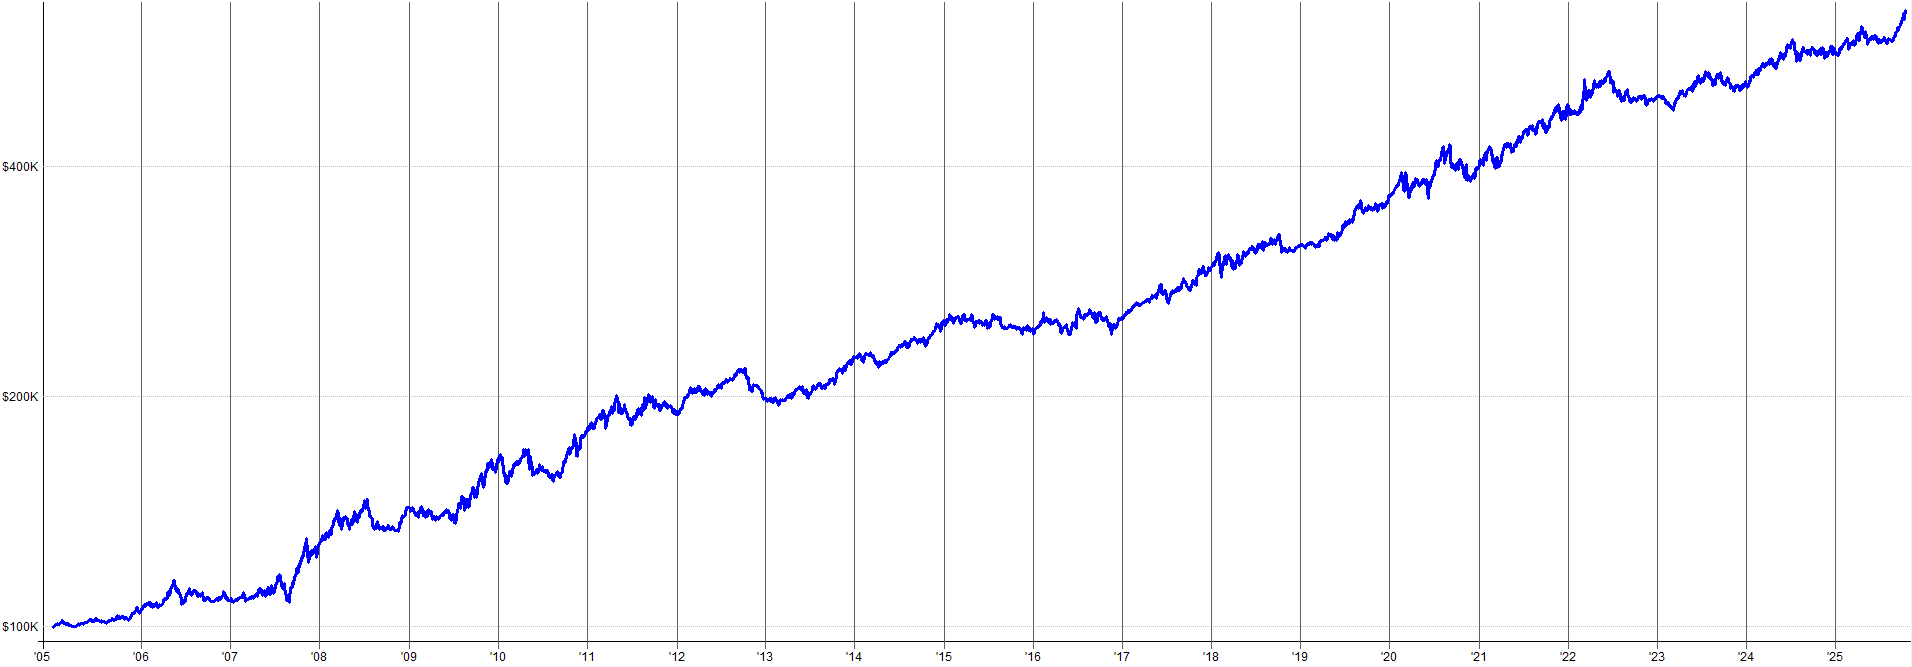

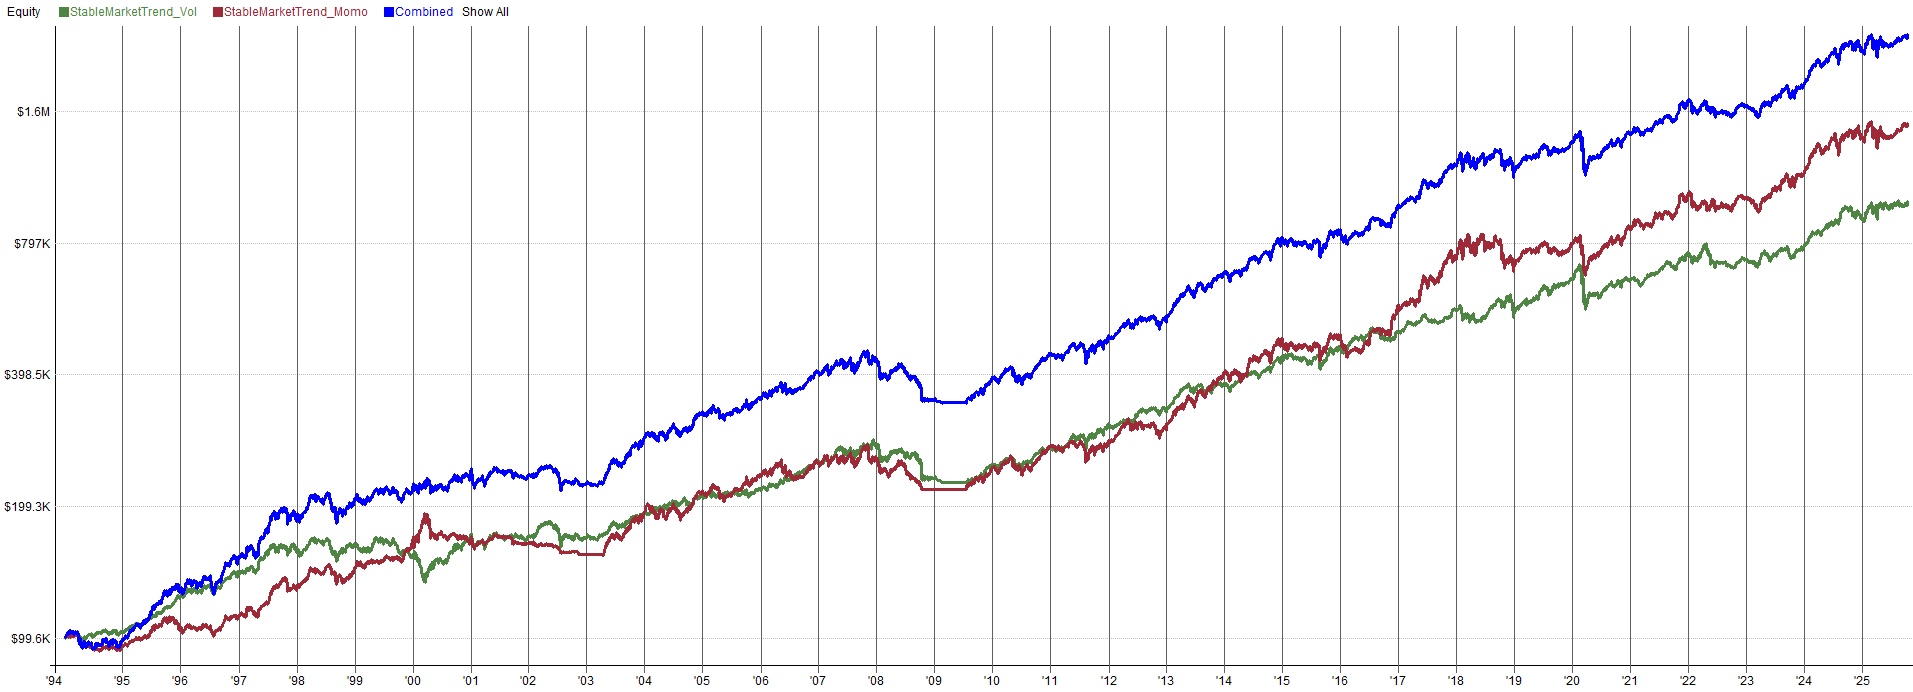
System 5: The set of U.S. large cap trend following systems:


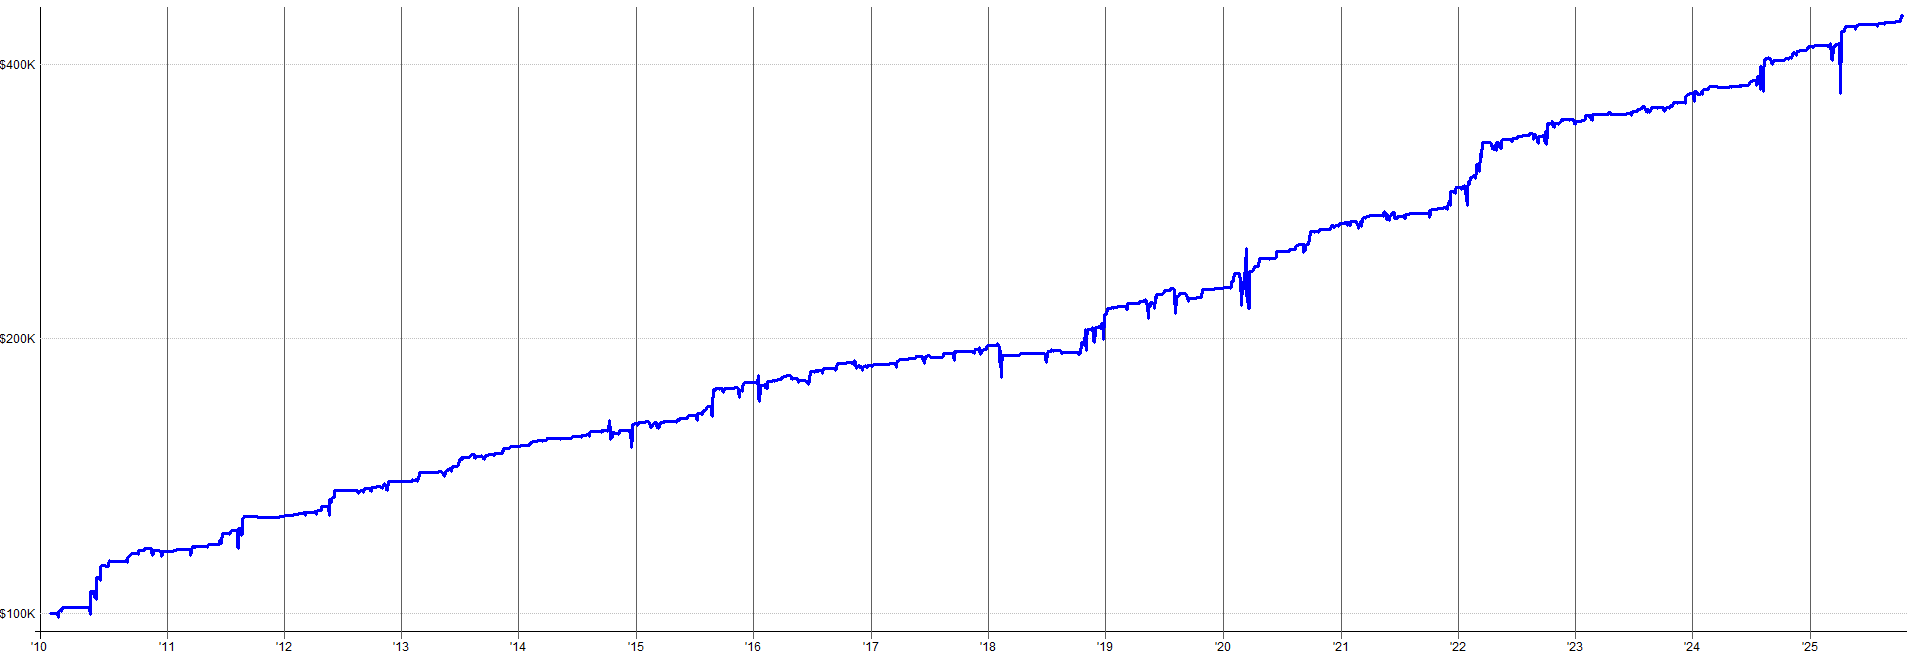
System 6: The U.S. ETF mean reversion system:


U.S. Only Portfolio System Allocations:
The system allocations for the U.S. only portfolio are summarized below:
System 1: U.S. large cap mean reversion: 30%
System 2: U.S. large cap momentum: 25%
System 3: U.S. hedging systems: 30% (each)
System 4: U.S. ETF tactical asset allocation: 30%
System 5: U.S. large cap trend following: 35%
System 6: U.S. ETF mean reversion: 35%
I tried to make all strategies contribute to the overall portfolio performance relatively equally. Meaning no one system is dominating the return profile, each system has a similar say in the returns of the overall portfolio equity curve. It is not perfect because different strategies start their backtests at different periods of time, but it’s close enough to show the power of this U.S. only portfolio.
You’ll notice these allocations sum to over 100%. That is intentional and we will discuss that shortly.
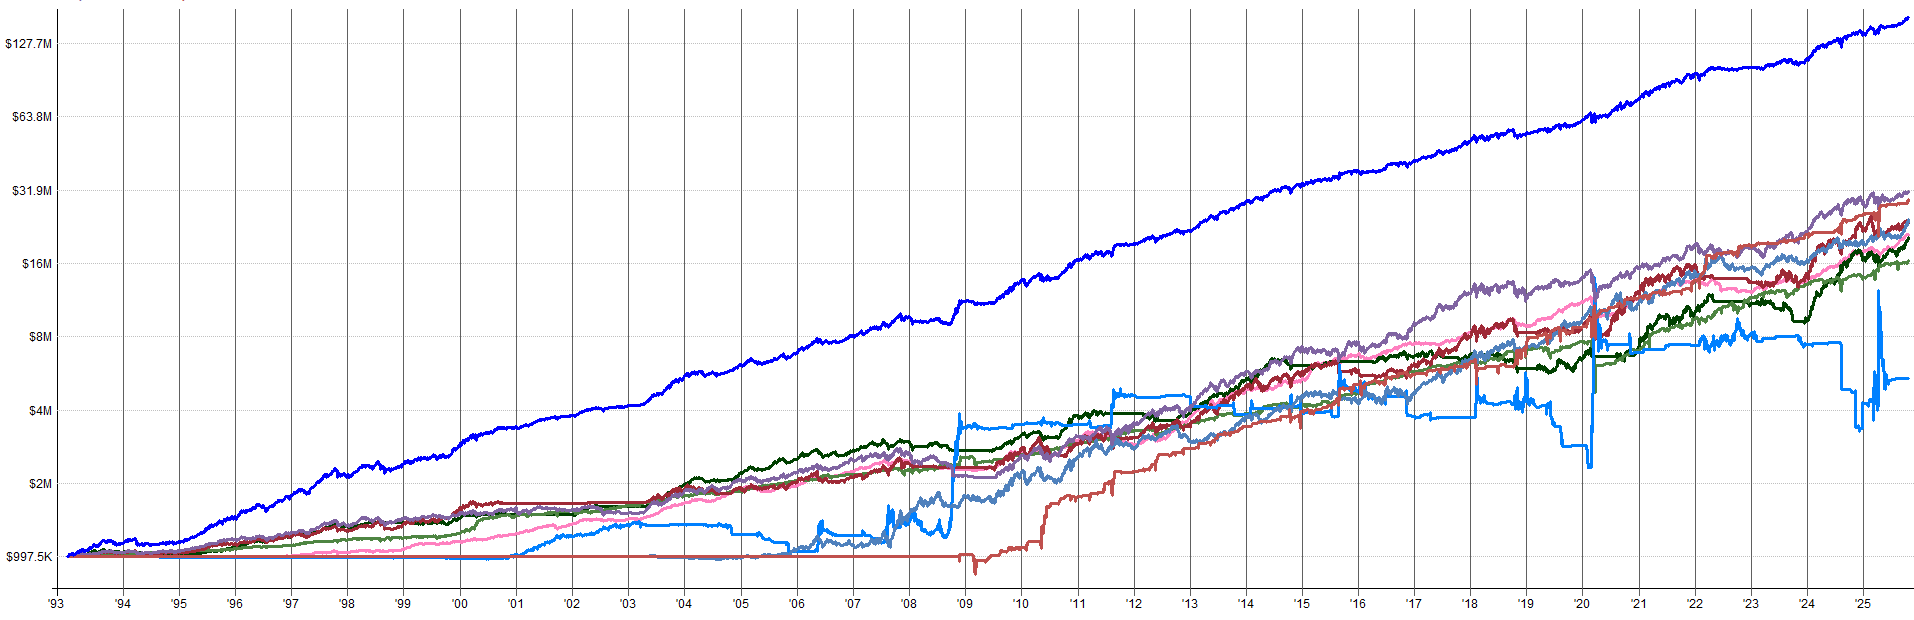
The combined portfolio is the dark blue line in the equity plot below. The other lines below the combined line are the contributions from each individual system.
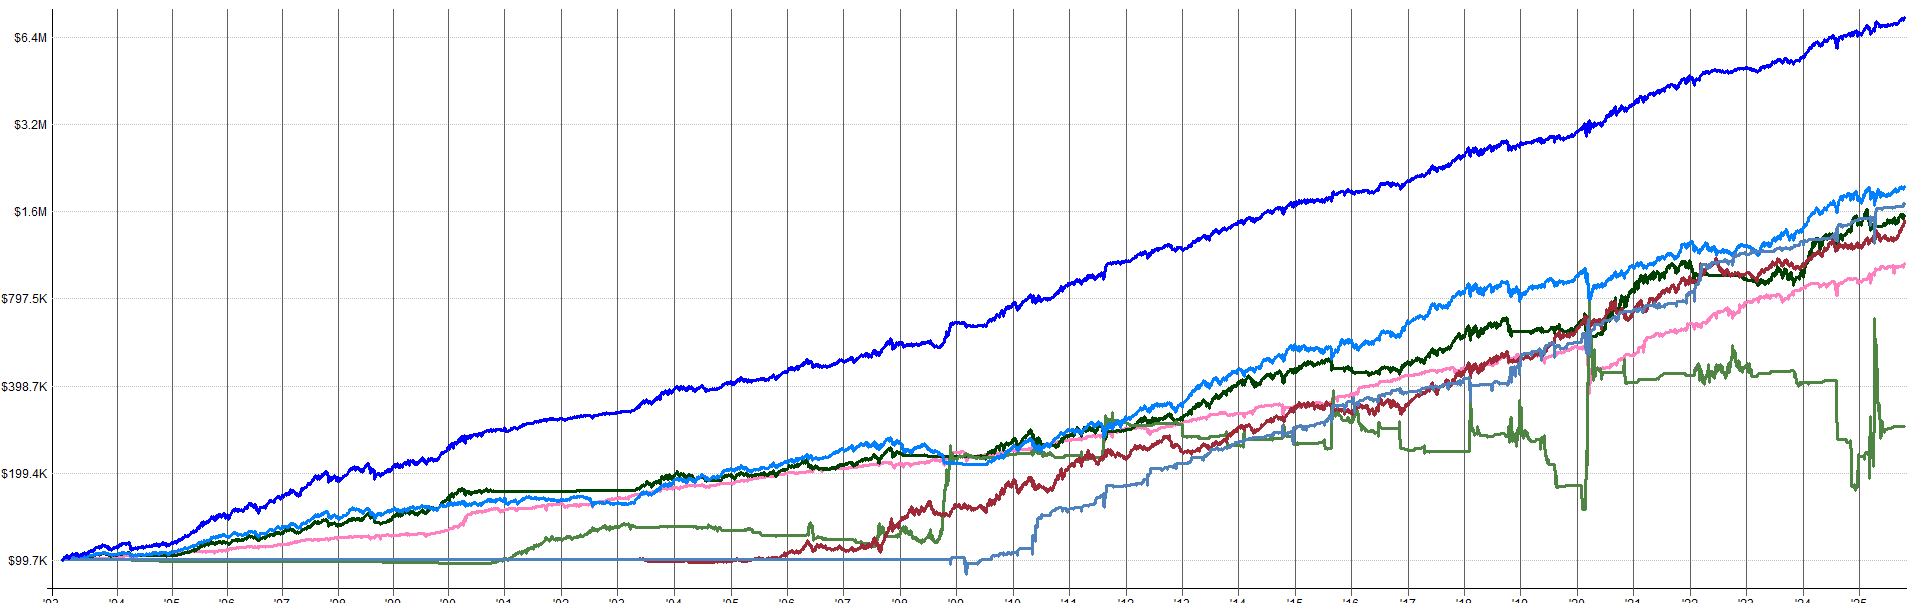

This U.S. only portfolio is very intriguing. While I’m a strong advocate in trading multiple markets globally for diversification, this U.S. focused portfolio is highly tradeable.
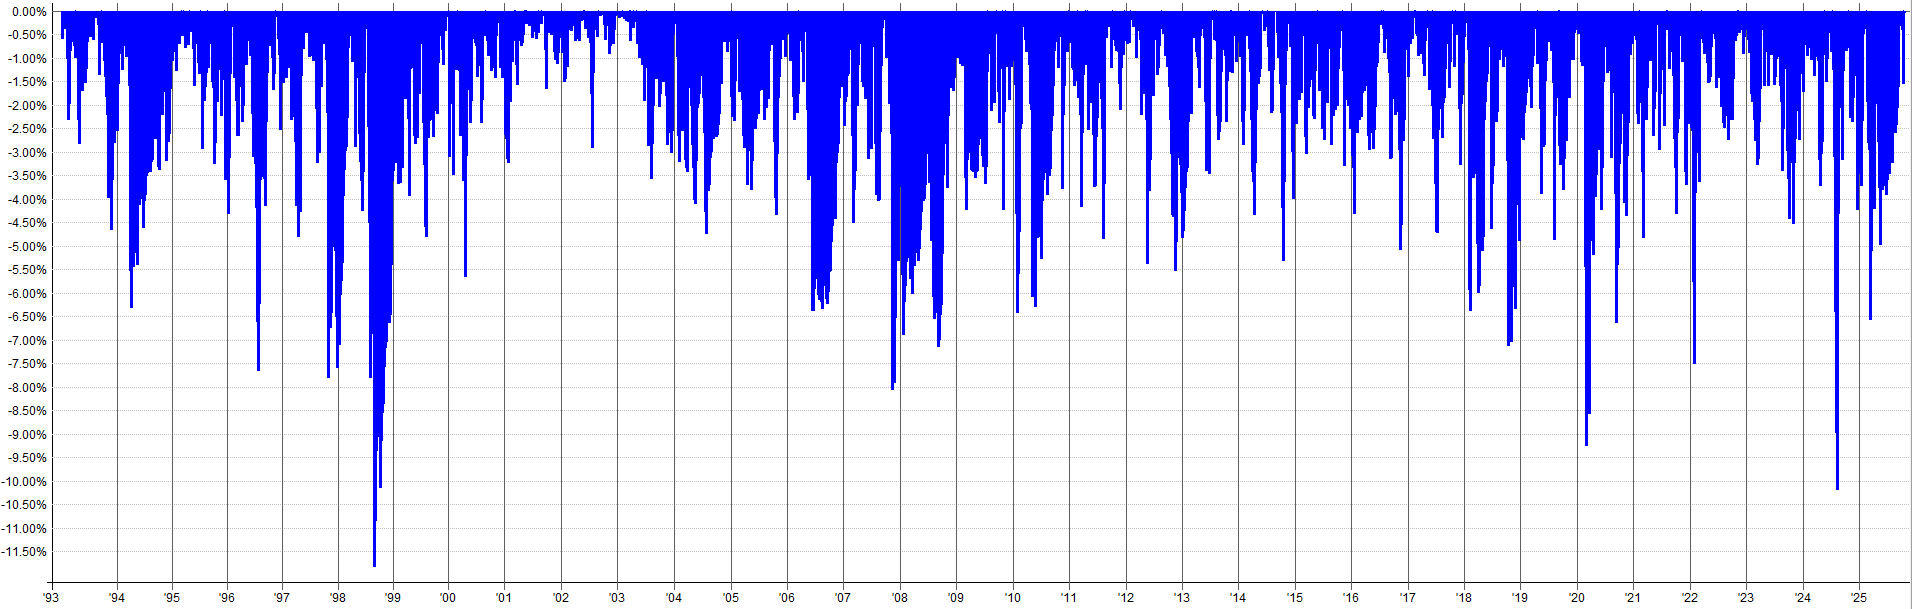
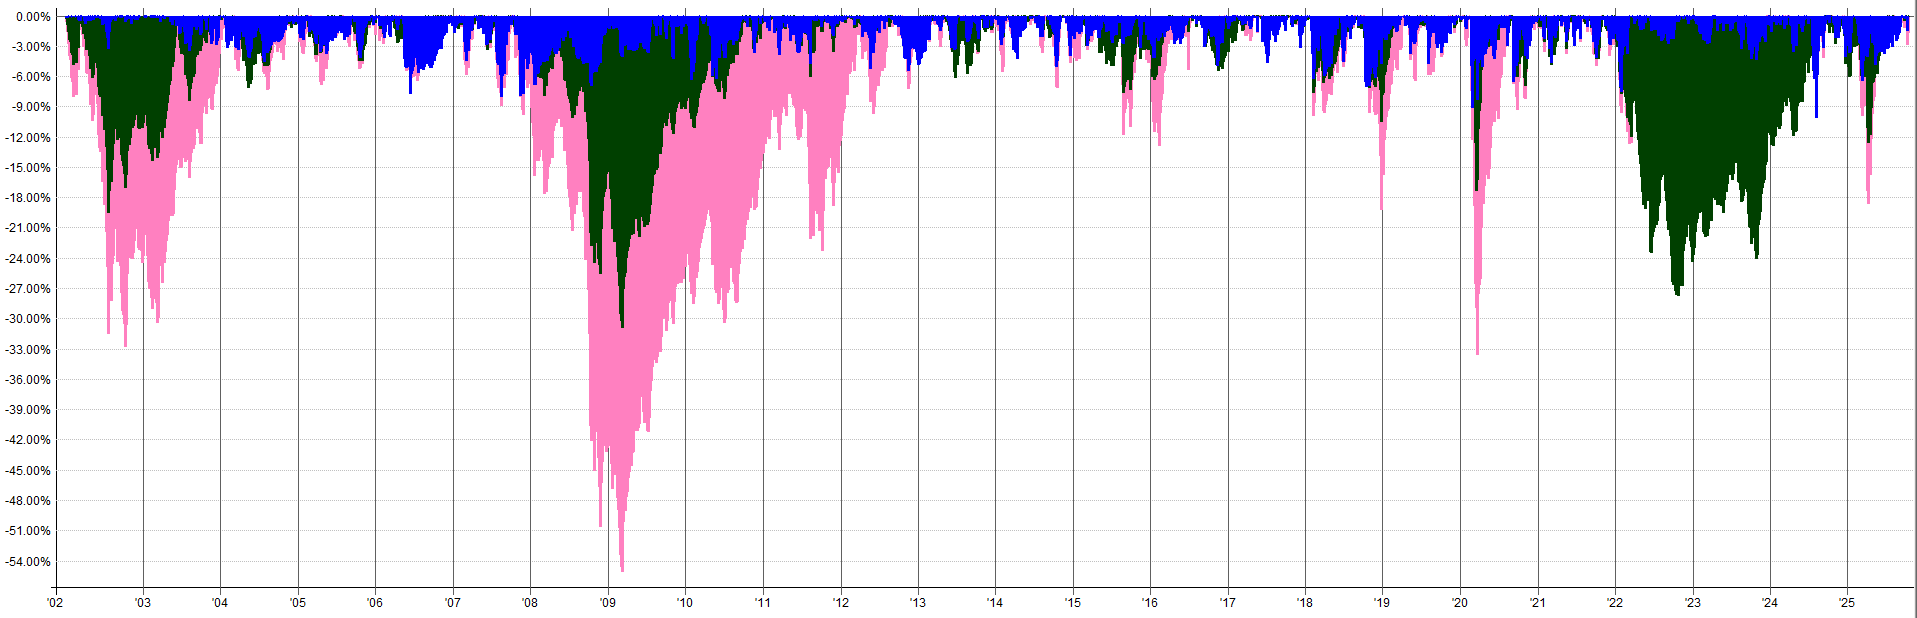
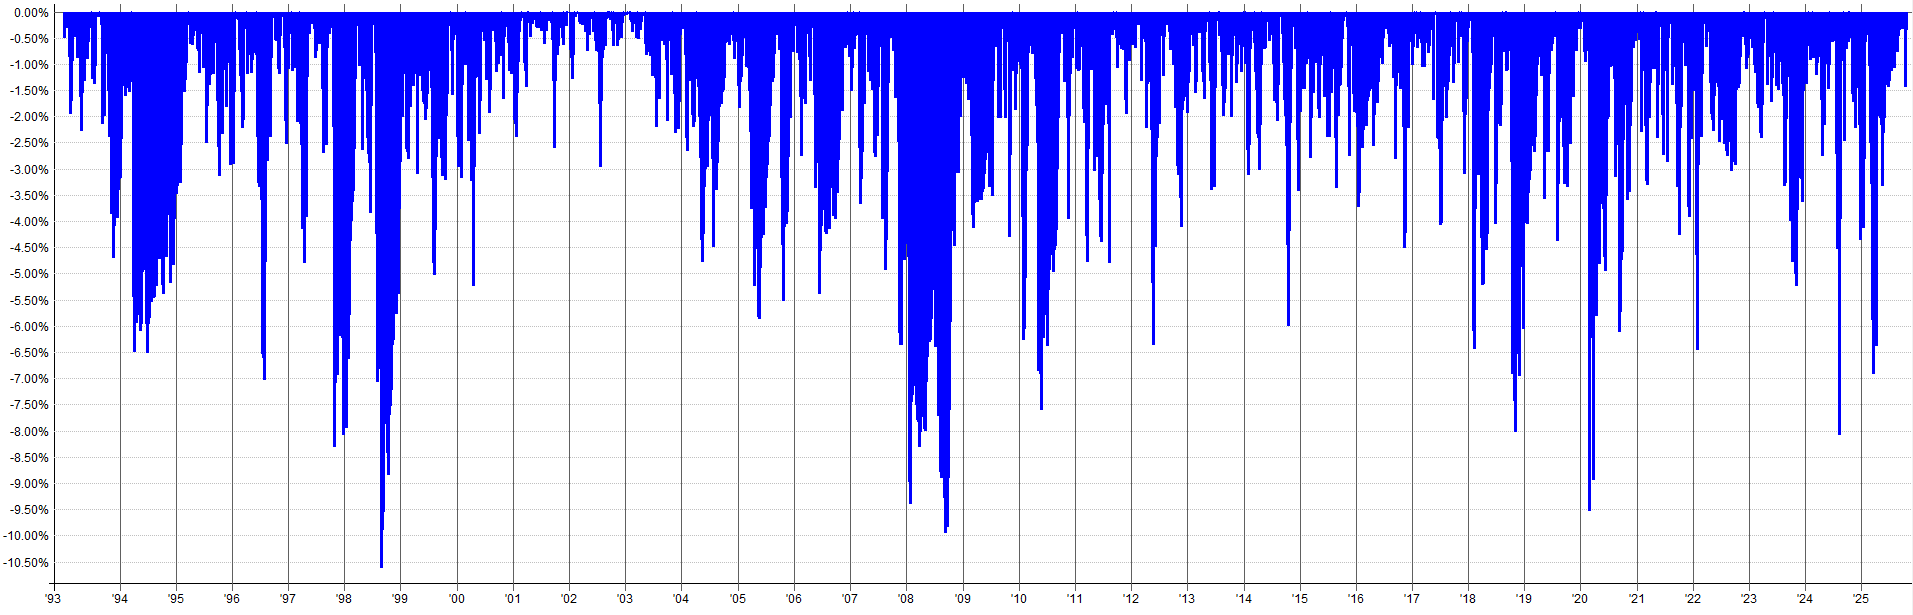
This returns of this portfolio outperform buy and hold strategies by several percentage points, and the drawdowns are significantly lower than buy and hold. With a maximum drawdown just under 12%, compared to over 50% for a passive buy and hold approach. If I had a choice between trading this portfolio and passively investing in the S&P 500, I’d choose this portfolio any day.
One critical factor to consider is the portfolio’s exposure over time. The exposure plot for the combined portfolio shows that, for the first 10 years of the backtest, the portfolio is relatively underexposed, peaking at around 60–70% exposure.
This is because some systems lack historical data during this period and haven’t yet “activated.” But, by the early to mid-2000s, once all systems have data to work with, exposure ramps up to 100% and occasionally enters margin, reaching a maximum of 138% exposure.
While I’m comfortable with brief periods of margin use, as shown in the exposure plot, this is a key consideration for traders without margin accounts. If you’re trading in a cash only U.S. equities account, you’ll need to scale down system allocations to avoid margin usage.
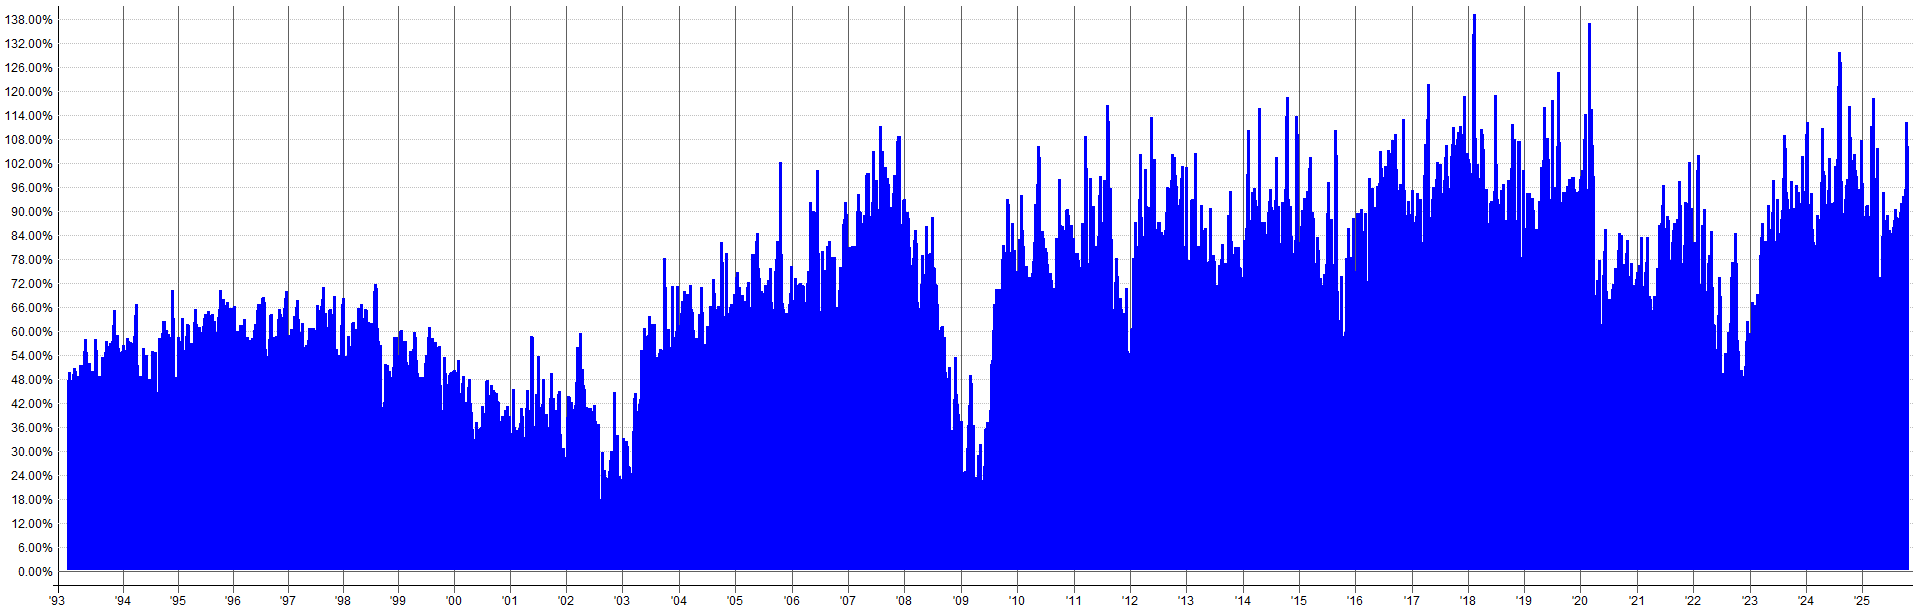
As I mentioned above, the allocations to all the systems sum to over 100%, yet the exposure of this portfolio tends to be around 100% or lower; with only very occasional margin use. This shows the power of combining non-correlated systems.
Not all of the systems are activated of fully exposed at the same time. Some systems are on, others are off, others are partially allocated. It’s a constantly evolving dynamic of sharing capital back and forth. For example, the shorting systems only kick on during bear market events. During this time, all the long trend/momentum strategies are actively selling, freeing up capital for the shorting systems.
Portfolio Comparison To Benchmark:
The benchmarks to beat are the S&P 500 and the traditional 60/40 portfolio. Over the past 20 years, the S&P 500 has returned approximately 9.5% annually with a maximum drawdown of 55%, while the 60/40 portfolio has delivered around 8% returns with a maximum drawdown of 31%.
It’s astonishing to me that investors settle for such performance when, with a bit of effort, we can far surpass these metrics. By combining non-correlated systems that analyze the market from different perspectives, we can create a portfolio that’s greater than the sum of its parts.
Individually, the systems within the portfolio are volatile and imperfect, but together they produce remarkably smooth portfolio-level performance.
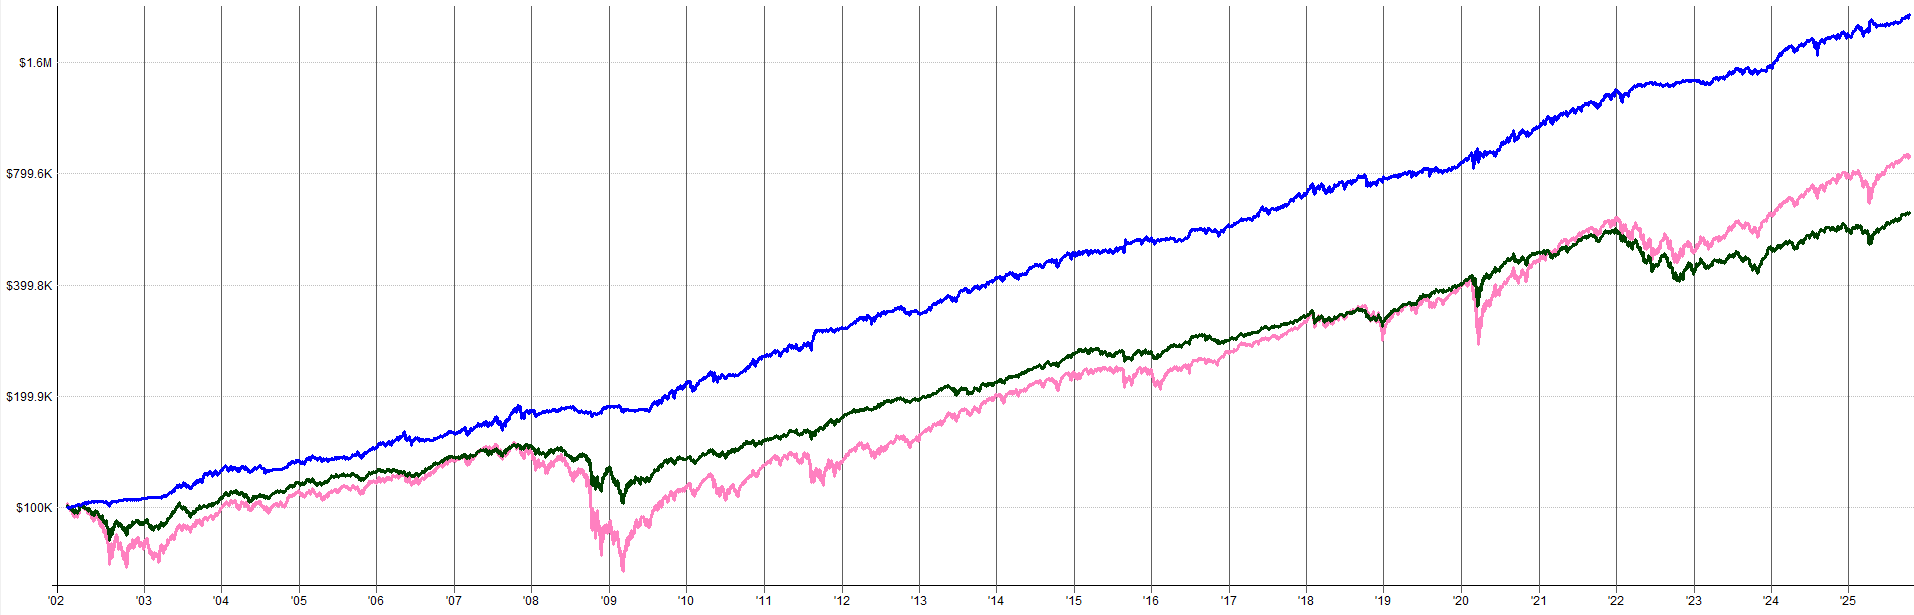
In the equity curve comparison, the U.S. only portfolio (blue line) significantly outperforms the 60/40 portfolio (green line) and the S&P 500 (pink line).
The U.S. only portfolio’s trajectory is nearly linear, contrasting sharply with the volatile paths of the two benchmarks. It shines particularly during turbulent market periods, where the U.S. only portfolio tends to move sideways while the S&P 500 and 60/40 portfolio suffer steep drawdowns.
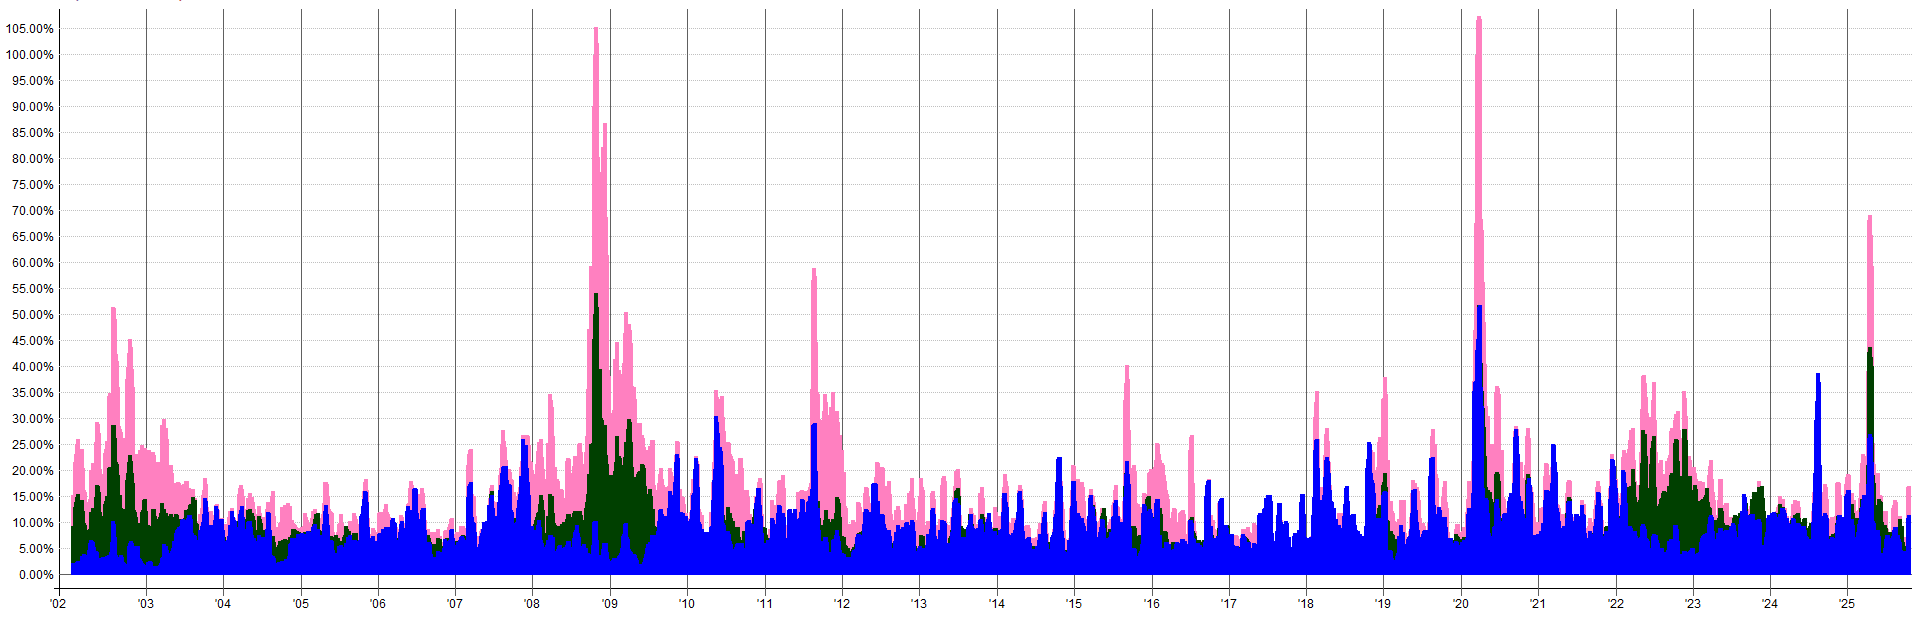
This outperformance is further evident in a rolling volatility plot. The 10-day rolling volatility of the U.S. only portfolio (dark blue) is significantly lower and more stable than that of the S&P 500 or 60/40 portfolio. This again shows how the U.S. only portfolio experiences a significantly smoother return profile compared to traditional buy and hold approaches.
Capital Requirements Of The U.S. Only Portfolio:
You might be wondering:
“I have $25,000 to allocate, is that enough to manage this portfolio?”
That’s a great question, so let’s explore. Every system in a portfolio requires a minimum capital amount to operate efficiently due to real-world trading costs and constraints.
For example, if a system is allocated $10,000 and holds equal weight 20 positions simultaneously, each position is worth just $500. If the system needs to buy a stock priced above $500, it may skip the trade or select a cheaper stock, leading to inefficient and suboptimal capital use. The system said to buy a certain stock, but we didn’t because we didn’t have enough capital, that’s not ideal. This can harm performance.
Another issue is commission drag. With a small allocation, if a system earns $20 per trade on average, but pays a fixed $2 in commissions, that’s 10% of profits lost to fees. However, with a larger system allocation resulting in an average profit per trade of $1,000, that same $2 commission becomes just 0.2% of the profit, a much more manageable cost.
These two example situations illustrate why knowing the portfolio minimum capital threshold is essential for efficient trading.
To investigate the impact of portfolio size, I ran the portfolio with allocations of:
$10,000
$25,000
$50,000
$100,000
$250,000
$500,000
$1,000,000

The table shows the performance metrics begin to converge around a capital amount of $50,000. This is the capital amount where the portfolio overcomes commission drag and can position-size optimally. Beyond this point, additional capital still yields some performance improvements, but they are minor.
A common myth is you can start trading with $2,000 and grow your account to millions in a short period of time. This study shows that there is significantly more capital required to properly manage a well diversified portfolio of multiple systems; with $50,000 appearing to be the minimum for this specific setup. And even so, it’s going to take a long time before $1,000,000 is in the cards. All good things require patience.
Adding ASX and TSX Systems:
Although this is a U.S. only portfolio, let’s have some fun and experiment by adding the Australian (ASX) and Canadian (TSX) systems to see their impact. We’ve already made these systems in previous articles, so we may as well add them to the portfolio just to see what happens.
As a refresher, the ASX system is a trend following strategy on small caps, and the TSX system is a rotational momentum strategy, also on small caps.
I adjusted the portfolio to scale down the allocations to the U.S. systems, making room for the ASX and TSX systems to be added. I set the allocation values such that each system contributes roughly equally to the portfolio’s returns, aligning each systems equity curves more or less on top of each other.

The results of this expanded portfolio are very interesting. Nearly all metrics improved: returns increased from 14.3% to 16.8%, drawdowns decreased from 11.8% to 10.6%, and risk-adjusted metrics like the Calmar and Sharpe ratios rose (Calmar from 1.21 to 1.58, and Sharpe from 1.48 to 1.82).
This demonstrates the value of incorporating non-correlated markets/systems into a systematic trading portfolio. While this article focuses on U.S. only trading for those with limited market access, these results serve as a compelling call to action. If you’re currently trading only U.S. markets, please consider exploring non-correlated markets, like the ASX and TSX, to significantly enhance your portfolio’s risk-adjusted performance.
Conclusion:
This U.S. only portfolio illustrates the power of systematic trading, combining momentum, trend, mean reversion, and hedging systems to deliver superior returns with significantly lower drawdowns than traditional benchmarks like the S&P 500 or the 60/40 portfolio.
By carefully blending non-correlated strategies, we’ve created a portfolio that’s not only robust but also resilient, maintaining stability even during market turbulence.
This portfolio is a testament to the idea that thoughtful design and disciplined execution can transform your investment outcomes. Now it’s your turn to take these ideas and implement them into your portfolio in the best way you see fit.
Well this is officially the last article in the Portfolio Development Series. I hope you enjoyed these articles and now have a better understanding of how to create a systematic trading portfolio from scratch. As always, let me know if you have any questions.
Also, all code for every U.S. system is documented below. I also added the combined script that aggregates all U.S. systems together so you can run combined portfolio backtests. Enjoy!
Do you have ideas/suggestions for future articles? Let me know what you want to read about by clicking the button below and submitting your suggestions. Your suggestions are greatly appreciated as they help tailor this newsletter to what you want to read about.