



Welcome to the “Systematic Trading with TradeQuantiX” newsletter, your go-to resource for all things systematic trading. This publication will equip you with a complete toolkit to support your systematic trading journey, sent straight to your inbox. Remember, it’s more than just another newsletter; it’s everything you need to be a successful systematic trader.
I recently launched a portfolio tracking website (updated daily) that tracks my systematic trading portfolio performance, along with many supporting metrics. You can check in on my personal systematic trading portfolio performance anytime here: TQX Portfolio Tracker
Introduction:
Recently we kicked off the momentum mini-portfolio series. The first article was a TSX market dual-factor momentum system with a hybrid trend following type exit.
The system turned out to be pretty robust after being run through a vast set of robustness tests.
We also took a deep dive into minimum system allocation, as I felt that topic is not as well explored online.
If you missed that one you can catch up here.
Momentum Mini-Portfolio Development - Part 1: TSX Momentum

This is a system I’ve been wanting to build for a while now and have finally gotten to it. It’s a monthly momentum rotational system on the TSX stock market.
Well, it’s not a pure momentum system, and it’s also not even a pure rotational system. I like to bend the rules a little bit. But we will get...
Now it is time to begin working on the next system to add to the momentum mini-portfolio we started developing. This system will be a US momentum system. The idea actually came from our community Discord.
Many members had gone back and forth with this system, working on their own versions and sharing results. I figured I may as well give it a shot too, as it is an interesting system idea.
What was even more interesting is that this system was originally discussed in our Discord chat in March of 2026, and went on to deliver over 100% YTD in 2026.
Hindsight bias?
… Probably.
But worth a good look to see if I’m missing something I could benefit from in my own portfolio.
The piece of this system that makes it slightly more interesting than most momentum systems is a specific part of the entry logic. The system still does all the standard momentum cross sectional ranking and trades the highest ranked stocks at the given period of time, BUT it has a rule added forcing the system to only enter stocks after they have had a pullback.
There is no buying momentum stocks at all-time highs. A pullback of X% from the highs is required for entry. This gives the system more of a mean reversion or value entry methodology into an otherwise pure momentum system.
The thought for me is this could provide some incremental diversification to my portfolio. Most momentum systems buy strong stocks at all-time highs. But there could be diversification value in buying momentum stocks a different way.
If every other momentum system you trade is buying at the highs, adding a new momentum system that has a different market view and only buys during pullbacks could be a nice way to spread entries across different stocks and/or different prices.
You’ll end up with different trades at different moments in the market cycle. Essentially you get stock, entry timing, and entry price diversification. I’m kind of a diversification psycho, so that sounds interesting to me.
But this could also appease the psychological side of some traders too. A lot of traders don’t want to buy stocks at all-time highs. It feels wrong to them. Maybe at their core they are value traders, or mean reversion traders. Either way, they want to feel like they got a bargain.
Personally I do not mind buying all-time highs, it does not bother me one bit. But a lot of other people are wired to want a discount, and if they can get a hot momentum stock at what feels like a discounted price, they may be more likely to trade and stick with the system.
So while this isn’t the reason why I personally am looking at this system, I could see how that side of it may appeal to others.
Anyway, in this article we are going to cover the following:
Mini-Portfolio Thinking: Why one momentum system is good, but it's not the end goal. We need more.
The Original System Overview: A high level overview of the system and the original starting point.
Post-Development System Investigation: I did a lot of work on the system on the side, but there are a few things specifically I want to deep dive into and decide whether it's worth adding to this momentum mini-portfolio.
In this article I am kind of jumping past all of the system development work (rule selection, optimization, in-sample/out-of-sample, etc.). I am kind of skipping to the end to focus on what I think were the most interesting pieces of the system that I noticed.
I figure we’ve gone over system development stuff in other articles, so let’s try to keep it fresh and focus on some other aspects of the process.
Also, in this article you’ll notice some new formatting for plots/tables/graphs. That’s from a new Claude Skill I developed to drive RealTest and make a bunch of nicely formatted outputs for me based on what I ask it to make.
It was pretty handy for making all the comparisons, and it reduces the amount of time I have to spend running backtests / snapping screenshots / manual copy & patse / manual excel manipulations etc.
I’ll share the Skill in the GitHub too, hopefully you can use it to speed up your processes and have AI make some neat summaries for your own systems.
With that said, let’s jump in.
Mini-Portfolio Thinking:
One momentum system is not the goal for my portfolio. I need many of them.
Every trading system you develop will have good years and bad years. And each trading system is just one path through history and into the future; there’s an infinite number of past and future outcomes for that given system.
Some years the parameters you picked will be the exact right ones.
Other years the market behavior drifts and those same parameters underperform.
If your entire momentum exposure is with just a single system, you are subject to a lot of luck in outcomes. And you won’t know if the outcome is just due to good or bad luck, or if the outcome is due to you having a faulty, curve fit system.
The whole reason for a mini-portfolio is to take one theme (some market phenomenon that actually exists) and exploit it in as many different ways as possible but still considering the limited capital base we all have. We essentially want to spread our capital across a wide surface area of ideas / methodologies that all seek to capture momentum in slightly different ways.
We don’t have infinite capital, though I wish we did, but if we did we wouldn’t have to worry about trading. Because of this we need to be smart with how we develop the mini-portfolio and cover a given theme from as many angles as we can with our limited capital.
In practice that might mean two to five different ways of looking at the phenomenon of momentum. We develop a few systems that each look at momentum in a different way, and each one adds to the surface area of coverage.
When we spread our capital across momentum systems that look at different universes, buy different stocks at different prices at different times, we end up with a higher probability of the average expected outcome and are less subject to the luck or un-luck that a single system would result in on its own.
If you only have ONE momentum system, you are subject to a lot of luck. Here are some examples of luck:
Did you accidentally pick the "perfect" parameters that happened to fit the historical data perfectly but are curve fit and will fall apart in the future? If you only had this one system and missed out on a lot of momentum gains because of poor parameter choices, that's going to hurt if there are no other momentum systems in your portfolio to pick up the slack. There is no such thing as an "optimal" parameter set. The best parameter set is diversification across many, which helps reduce the impact of unlucky outcomes due to unlucky parameter choices.
Did you accidentally build the system on a universe that is going to underperform other universes in the coming years? When it comes to momentum, most systematic traders only trade the Nasdaq 100. That's a massive hindsight / selection bias. They're only doing this because the historical results looked the best. But there is no reason why the Russell 1000 or S&P 500 can't perform better than the Nasdaq 100 in the future.
Did you happen to get unlucky on the timing of entry or exit with the particular system? Maybe right now and in recent history "buy at all-time highs" was the best way to trade momentum. But next year "buy the pullback in momentum" happens to work better because the market becomes a little more mean reverting that year. Nobody knows in advance which specific way to trade momentum will work best, so it's probably a good idea to have exposure to multiple different ways of capturing momentum.
These are all things you mitigate by running a bunch of systems in parallel that capture momentum in different ways.
Diversification across universes.
Diversification across timing.
Diversification across entry and exit logic.
Diversification across entry and exit timing.
Diversification across the stocks owned.
Diversification across stock filtering.
The list goes on…
This results in a cross-sectional, holistic view of momentum. And the more angles you cover, the more you are going to experience the AVERAGE result of momentum, not the specific random outcome of any one system implementation.
The average result maybe sounds bad… we want exceptional, right?
But the average result is actually what we want.
Exceptional results only live in curve fit backtests and almost never come to fruition in real life except due to luck.
Have you ever developed a system and kept re-optimizing it every few months because live performance underperformed the backtest? If so, you’re constantly chasing exceptional performance that doesn’t exist anywhere except in a fantasy.
If instead we focus on implementing many different views of momentum, we end up with the average result of all those views. And the average result is much more stable and less subject to luck (including bad luck).
The average result is the optimal result in reality.
The average result is best achieved when you are well diversified and can capture the specific market phenomenon through many different lenses.
Some examples of different lenses systems may have are shown in the table below. These are all things each system could be diversified across (or at least the ones I could think of), with some examples.
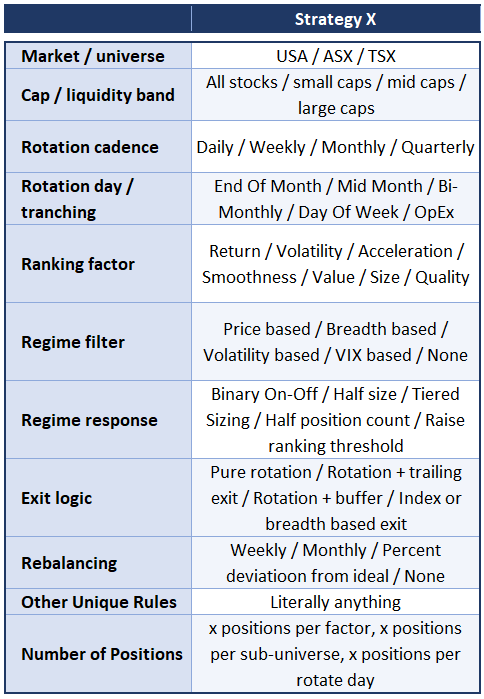
The goal of this momentum mini-portfolio series is to develop 4 to 6 or so systems that all capture momentum in a different way. Whether that’s looking at different markets, or rotating at different times, or defining momentum in a different way, etc.
At the end of this series, when we combine all the systems we developed into the mini-portfolio, you’ll see the results are much more stable than any one system.
Anyway, I think you get the idea. I’ve touched on this concept in other articles many times. I just think it’s so important and has transformed my systematic trading journey, so I like to spend time on it somewhat often.
Now let’s get into the original system idea and performance.
The Original System Overview:
As I mentioned, this system came from a discussion in our Discord chat and we went back and forth on it many times. A few months went by and I happened to look at the system again, and it had done extremely well in that short out-of-sample window. It did what it was supposed to and captured some real momentum in the market.
Currently, I only have one live US momentum system in my own portfolio. That needs to change because that one live US momentum system got unlucky recently.
My one US momentum system I trade happened to miss some real momentum moves this summer 2026 simply due to when the regime filter within the momentum system decided to turn off. The timing of when it exited my positions and re-entered due to the index filter caused me to miss some really good trade opportunities. That’s frustrating.
So this new momentum system from the Discord chat was very interesting to me when I saw it happened to capture the US momentum moves my current system didn’t. That tells me there could be some benefit in exploring what makes this system different and whether I can improve the momentum side of my own portfolio by implementing it (assuming it’s robust and well built, etc.).
The unique piece of this system is that it only buys high momentum stocks when they are in a pullback. That allows the system to get a better value entry price and potentially avoid the whipsaws that occur when you buy at the top and the stock immediately reverts. I like the diversification of entry style it provides, and so I’m interested in potentially adding it to my portfolio.
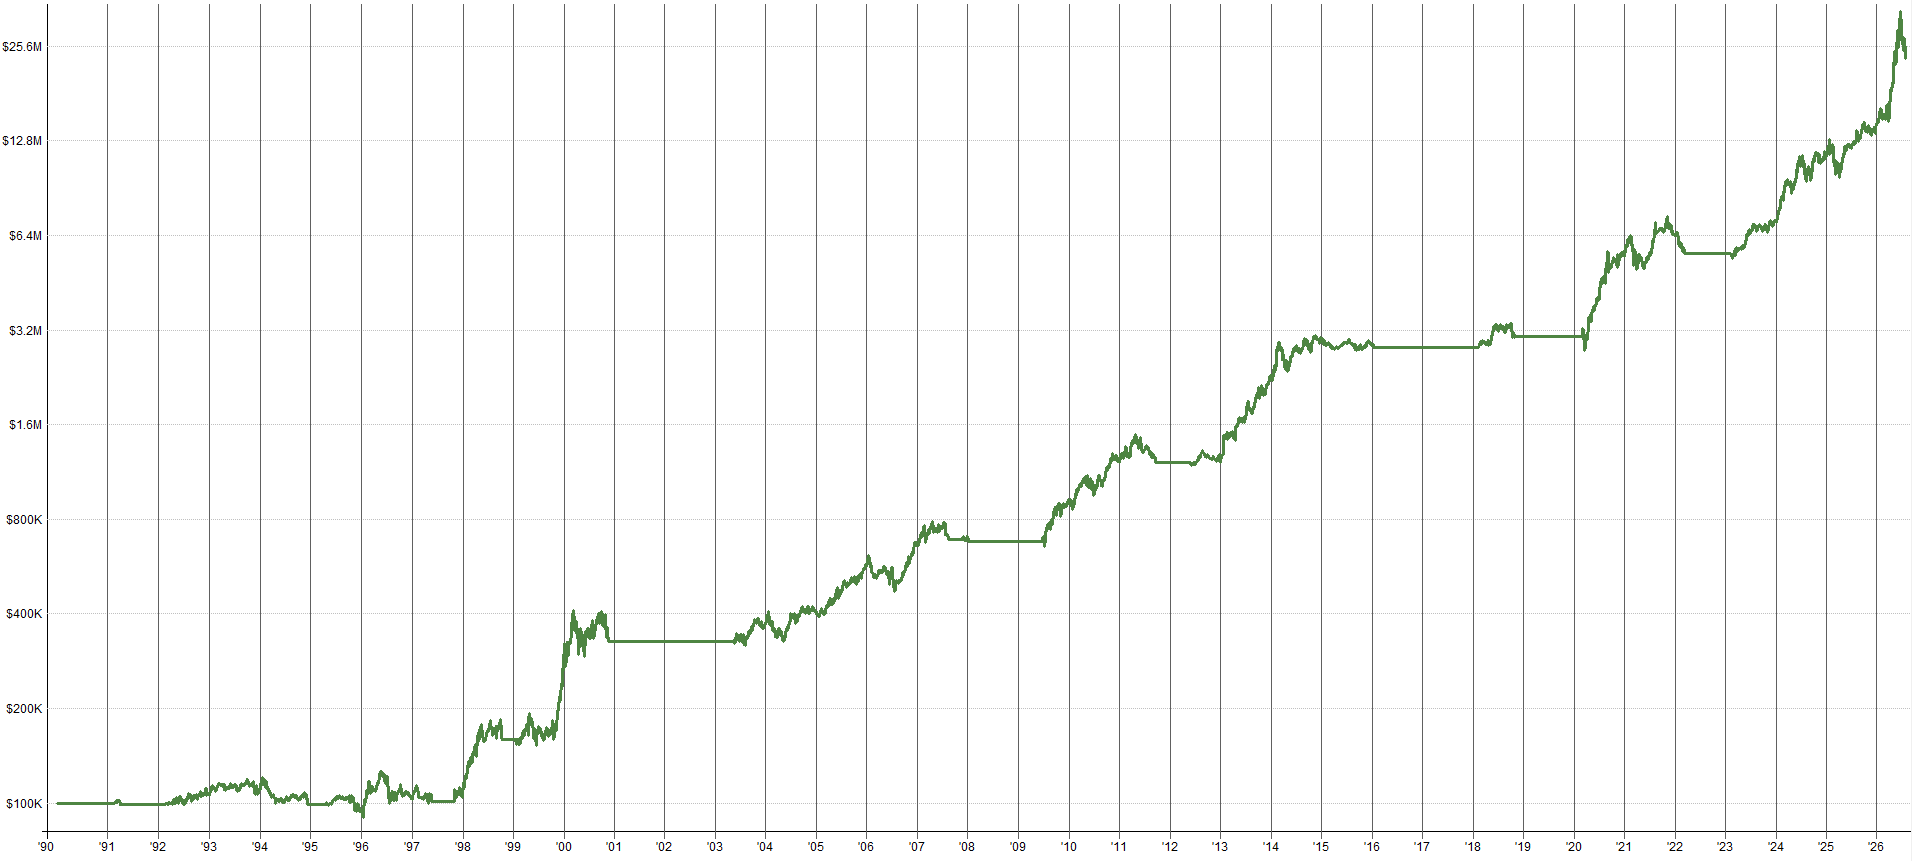
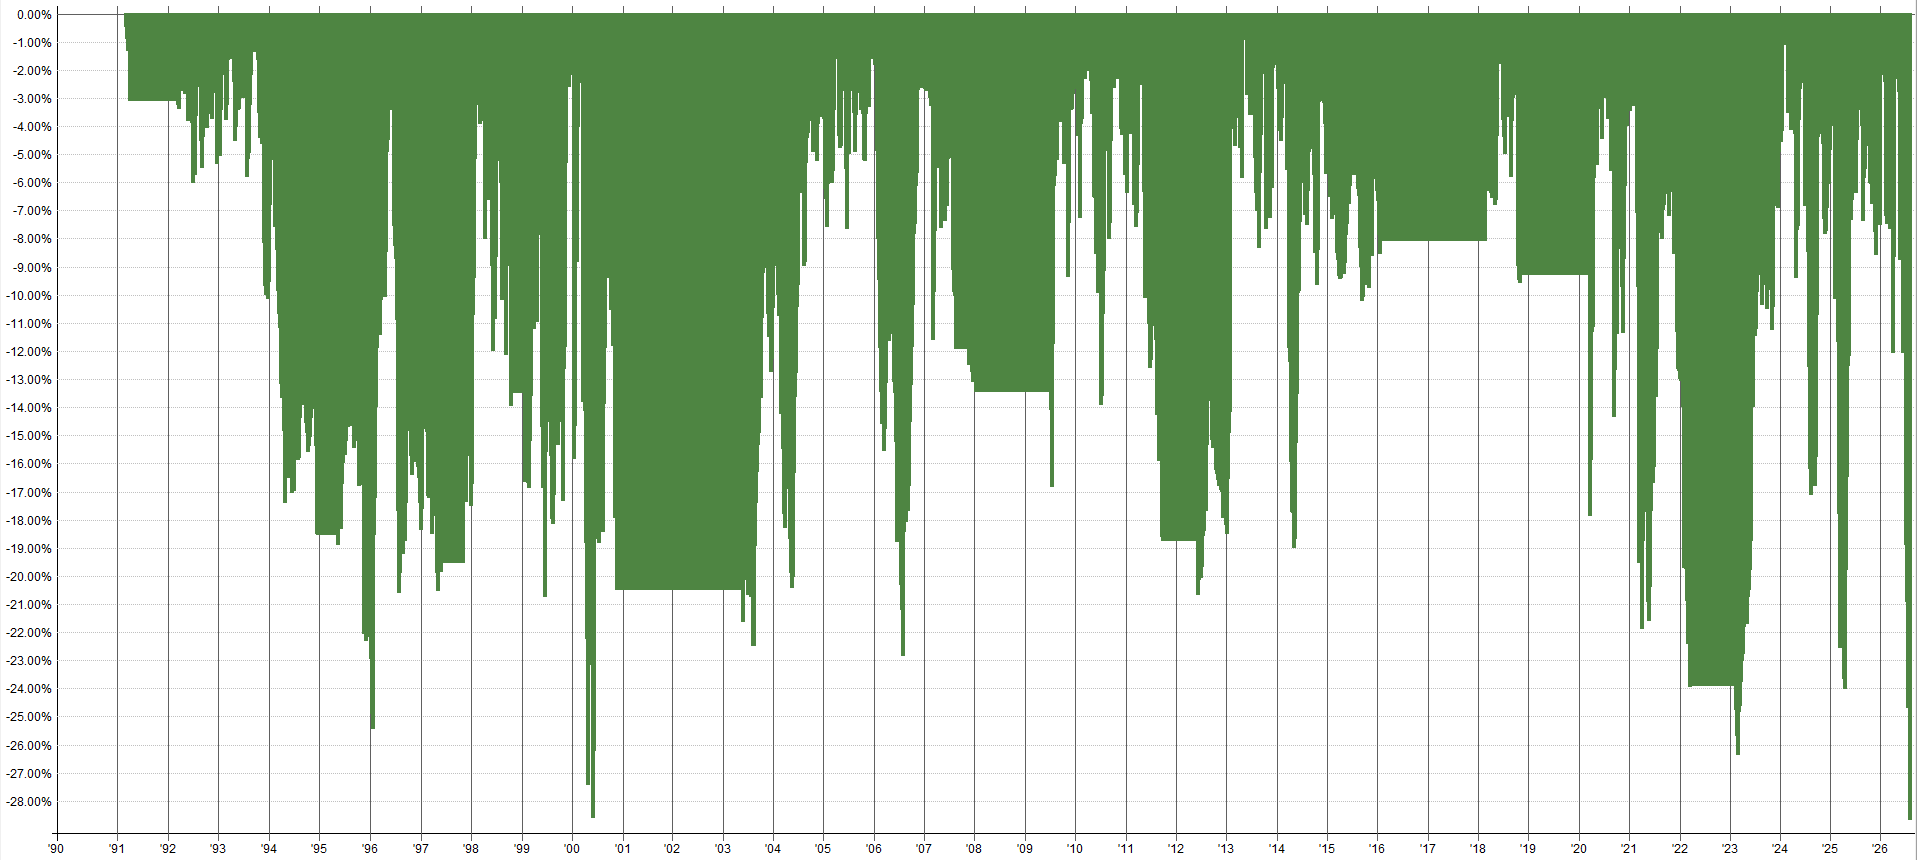
Anyway, this is the original system result that we landed on in March of 2026.
Original System Baseline Results:

Original System Baseline Results (Benchmarked To S&P 500):
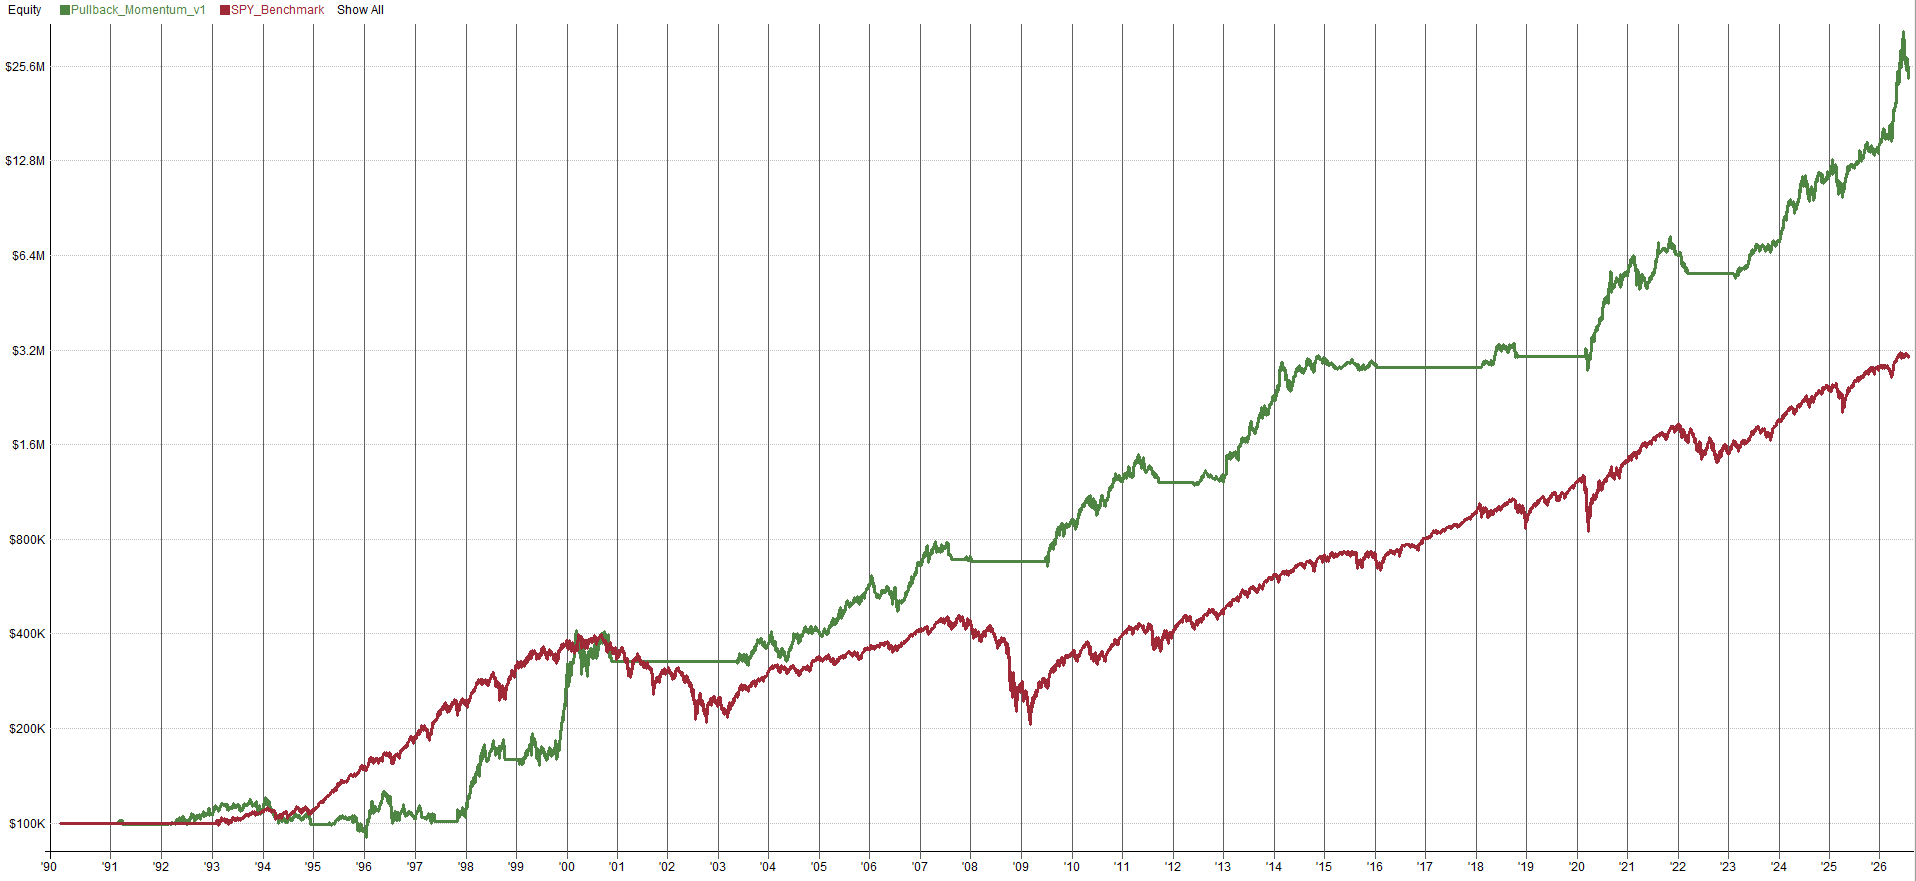
The system goes flat for a little while, then is explosive to the upside. Especially in 2026, with the AI frenzy causing some stocks to skyrocket.
My momentum system missed that 2026 run up. So obviously I’m missing some angle on the markets that I could benefit from by adding this system to my own portfolio.
Anyway, I decided to put some real work into this system to understand how it worked and if it was robust. But before I started doing any real work on the system, I did a few things to modify the system from the start so I had a solid base to start working from:
I completely recoded the system and restructured it to a format that I understand well. I almost always do this. If I don’t, I don’t fully understand all the code and I struggle to follow what the code is doing and what feature depends on what.
I expanded the system from just being on the Nasdaq 100 to also being on the Russell 1000 and S&P 100 for intra-system universe diversification.
I removed some hard coded parameters from within the system and made sure they were treated as “tunable” parameters for robustness related screenings.
I added some upfront rules for minimum liquidity, minimum stock price, and ensuring it’s a common stock, etc. Not that this is likely needed given the system trades large caps, but I do it just in case. It can’t hurt.
I required the stock to be in an uptrend and the factor ranking mechanism to be greater than zero. These didn’t change the trades taken by the system at all. It’s again more of a safety mechanism to guard against weird edge cases where I don’t want to be in trades if momentum is down.
I changed the exit time from the open to the close to help mitigate slippage, as entering and exiting on the close allows the system to participate in the closing price auction.
I added in dynamic position sizing and the ability to rebalance on a weekly or monthly cadence if the position size is X% different from the ideal size. I turned this rebalancing off for my development work, but turned it on once I had the system built the way I wanted at the end of the process. All the plots below are with rebalancing on a weekly basis if position size is off by more than 10%. You can turn this off if you want though, it’s not required.
I increased the position count the system can hold from 5 positions total to 20 total per universe (three universes, so 60 positions total). I didn’t keep it this high in the final system implementation, but this allowed more data into any sort of optimization or robustness test and allowed me to make decisions based on less noisy results. When only a few positions are held by a system, the results of any run can be very subject to luck and the scatter of results can be noisy. Allowing the system to trade more positions helps smooth the results data a little bit. After I was done with the development work, I reduced the position count back to 5 to make it more manageable to trade. And since the system now trades three sub-universes, 5 positions per universe is 15 total, which I am okay with.
None of these changes were made to get a better backtest, or to optimize toward the best parameters, or anything like that. Instead, I implemented these things to have a more robust codebase, better slippage control, better edge case handling, optional modifications like rebalancing, and more diversification across stock universes.
See the backtest below for the new starting point of the system after my modifications.
Modified System Results:
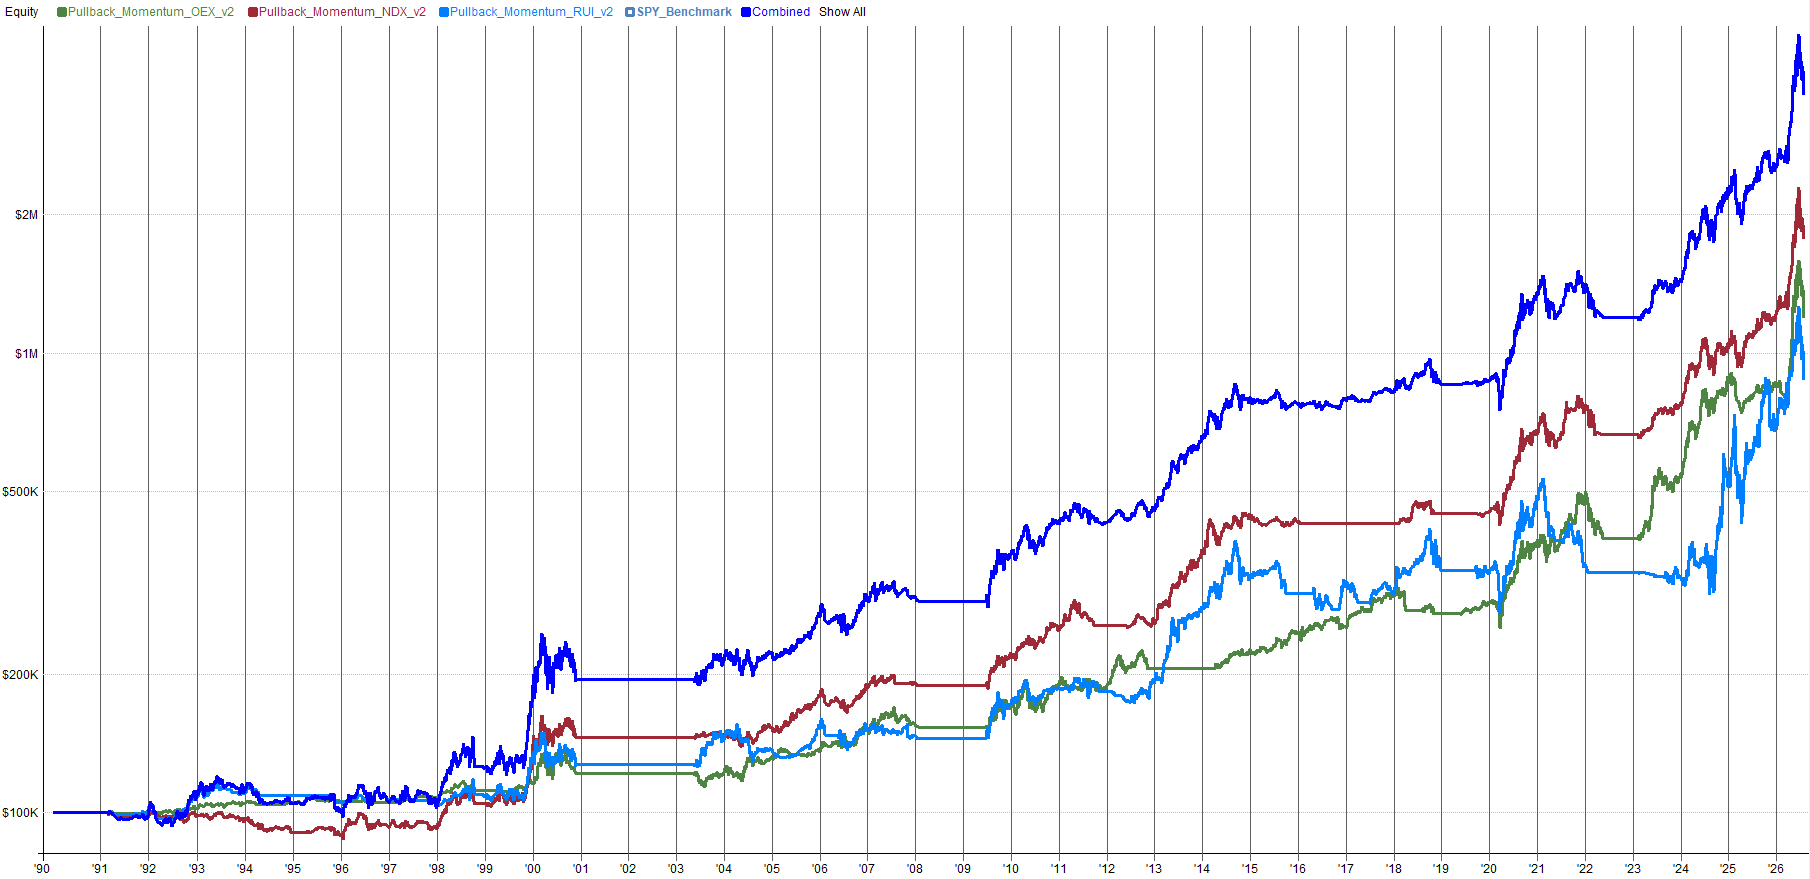

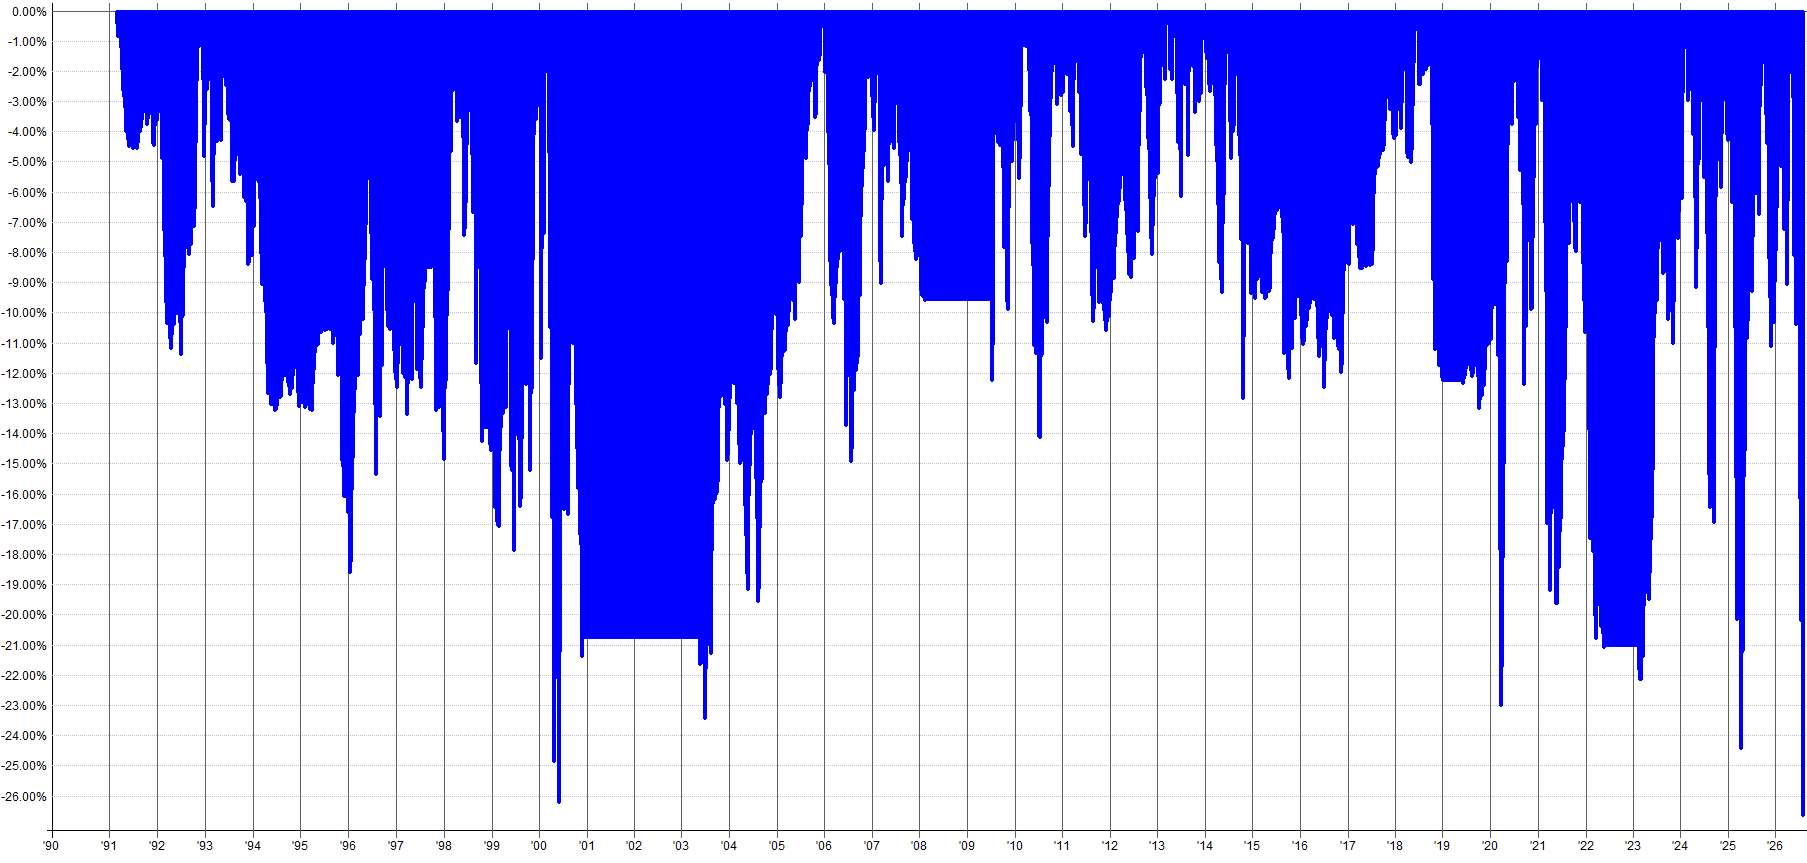
The biggest change was going from a one universe Nasdaq 100 system to a three universe system, with each sub-universe getting one third of the total allocation.
The sub-universes are the S&P 100 (OEX), the Nasdaq 100 (NDX), and the Russell 1000 (RUI).
Now the immediate question becomes:
“Aren’t the S&P 100 and Nasdaq 100 stocks both inside the Russell 1000 already? Are you just taking the same trades three times?”
Fair question.
I actually look into this later in the article to answer it with real numbers. But the theory is that the momentum ranking happens within each universe. The top 10 stocks in the Nasdaq 100 are not the same as the top 10 stocks in the Russell 1000, even though the Nasdaq 100 names may live inside the Russell 1000. Since we are ranking relative to the universe, different universes produce different top-ranked stocks.
The three sub-universe stacking provides diversification within one system. It is the same principle as the mini-portfolio, just at the individual system level.
You do not know what the best universe is going to be in the future. Something might backtest very well historically and then underperform for the next five years. Some other universe might have looked mediocre historically and then skyrocket recently (like the Russell 1000, which has looked the worst historically and one of the best recently).
The Russell 1000 does not backtest as well as other universes, and neither does the S&P 100. But both have had major performance in the past year. Unprecedented compared to the backtest. A lot of traders probably didn’t capture it because they saw these universes’ backtests and chose not to trade them because another universe backtested better.
The funny thing is, going forward, traders may start picking the Russell 1000 or S&P 100 universes because now the backtests will look better. That’s still the wrong way to go about it.
Trade MANY universes.
Then you don’t have to worry about which is better or worse. You’ll get the average, more stable, more robust result. When you do this you don’t have to worry as much about luck, because by casting a wide net to capture outliers you put yourself in the WAY of that luck.
If you only trade one universe, your luck net is small. Any sort of underperformance and you get screwed. But if you cast the luck net across three universes, you are more likely to capture the big market move without needing to know in advance which universe was going to experience it.
System Investigation Results:
Okay, I am going to skip the rule ideation / testing / in-sample out-of-sample / robustness / pass-fail parts of it all. We cover that so often, which is probably good, I just want to do something a little different.
And for what it’s worth, based on working with the system, I personally think it’s robust and a good portfolio addition, and I will be adding it to my own portfolio.
I want to focus on the parts of the system that make it unique and what makes it worthy (or unworthy) of addition to my portfolio and the mini-portfolio, in context with the TSX momentum system we developed in the last article.
Pullback Entry vs. No-Pullback Entry Comparison:
Let's start by looking at where I ended up with the system after I was happy with my re-code, development, and robustness work.
As I mentioned, this US momentum system only enters stocks if they are in a pullback of X%. Let’s dig into that pullback rule and see what effect it has on the system, since that’s the main rule that’s truly unique about this momentum system.
See below for a backtest comparison between the pullback version and no pullback version of this system.
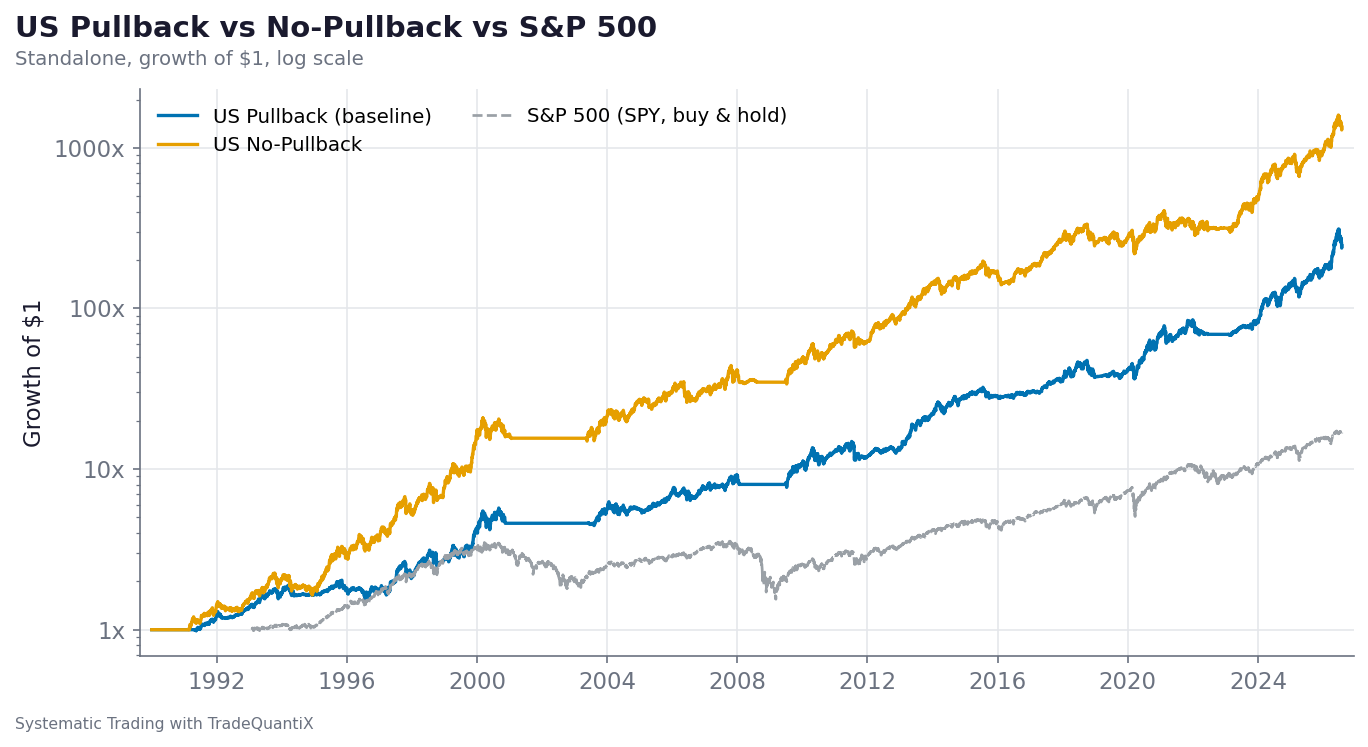
In the backtest above, I am showing the system with the pullback rule implemented and without it so you can see its impact. I am using a pullback of 15%, meaning a high momentum stock must be 15% off the yearly highs to be considered for entry.
I found 15% to be the sweet spot in terms of having somewhat high exposure while still producing somewhat unique results.
As pullback percent approaches 0% you converge to the no-pullback results. As pullback increases, the equity curve starts to be very selective.
You can see what I mean here, where pullback is set to 25% as an example:
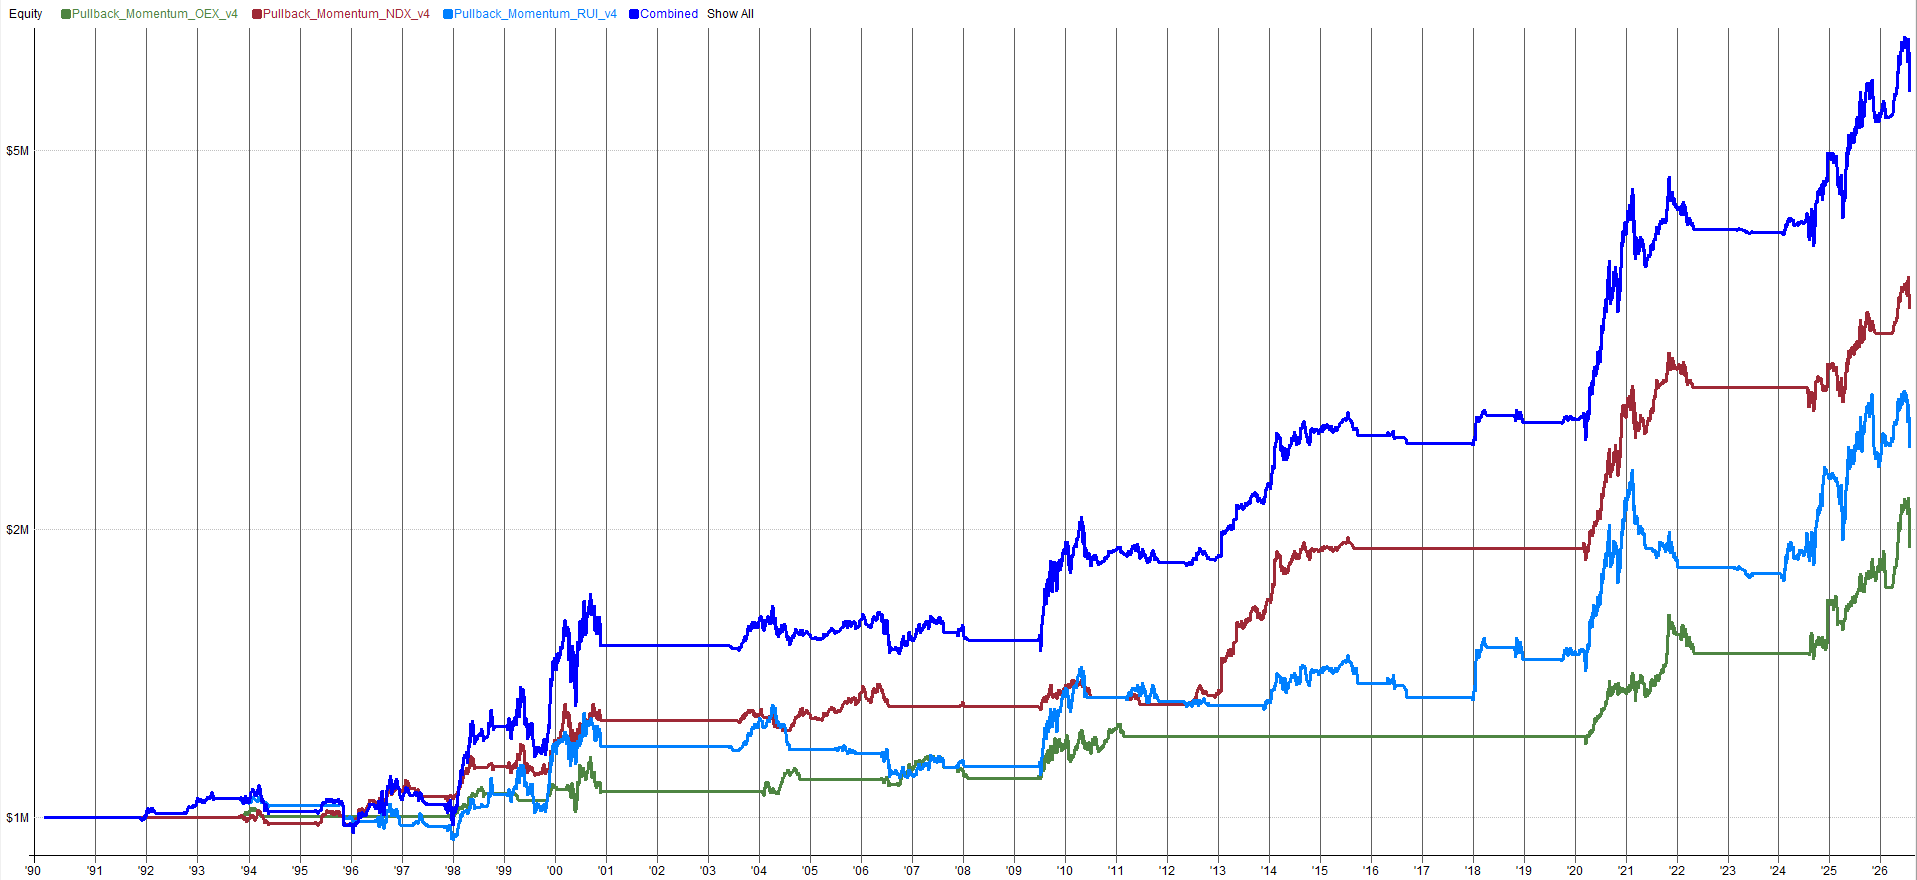
While interesting and maybe useful in some contexts (like if you want specific exposure near V-recovery bottoms in markets), I personally like the results somewhere in the middle of the range. Hence why I chose a 15% pullback.
The good thing is it doesn't really matter what pullback percent you choose, they all work, just to varying degrees of entry strictness. Different portfolios have different needs and different objectives. Do whatever you have to do for your portfolio.
Is the Pullback Entry Actually Worth It?
The interesting thing is you could argue the version with the pullback is worse. And on a side by side metrics comparison and equity curve eyeballing, that’s probably a correct statement.
The pullback system has worse overall metrics on its own than a version without the pullback filter. You can compare the system metrics with and without the pullback entry condition below:
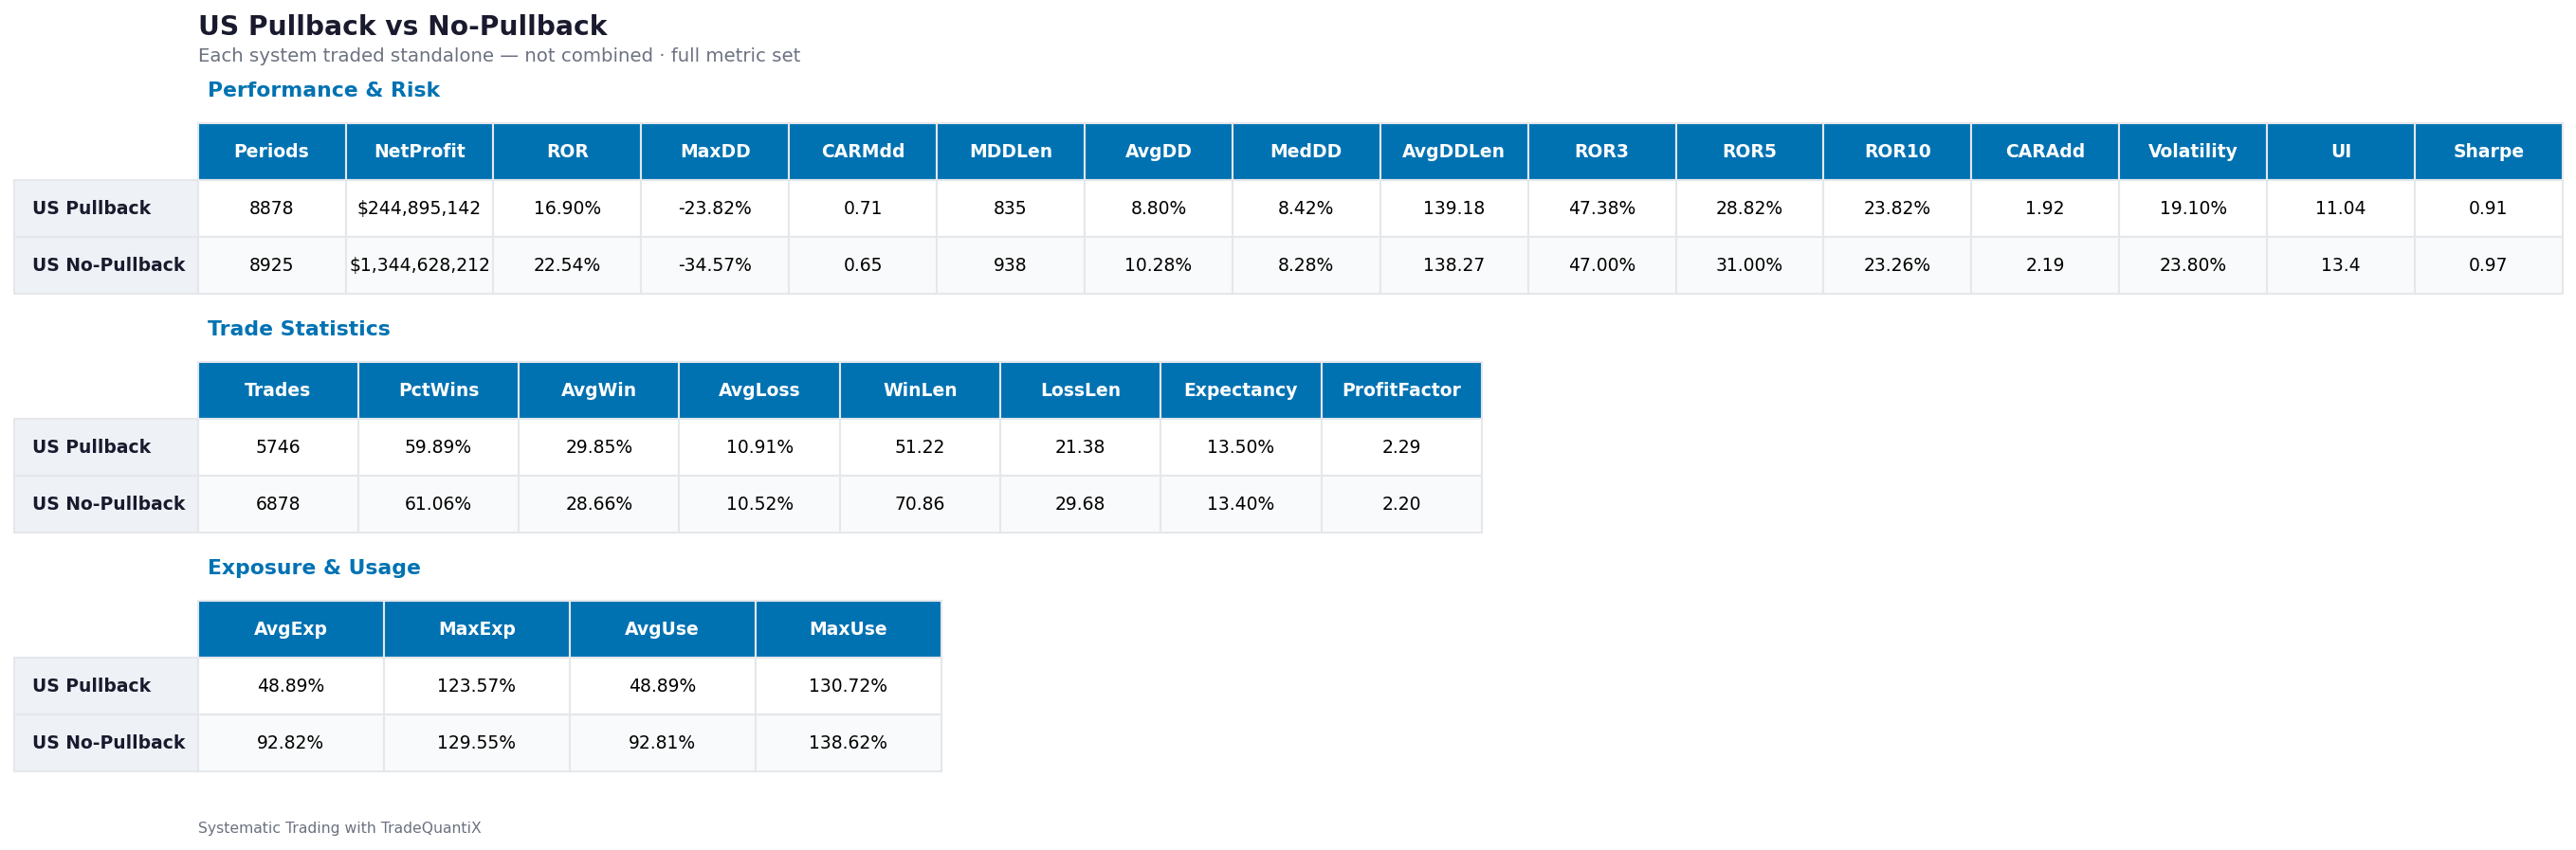
But remember we are working on this system from a portfolio context, not a singular system context. We will be trading many momentum systems, not just this one. So having a momentum system that specializes in getting into momentum stocks at a good value price could still be beneficial when combined with other momentum systems.
Hence, in a bit we will look at how the pullback and no-pullback versions of this US momentum system add to the momentum mini-portfolio when combined with the TSX system we looked at in part 1. But let’s cover a few more things before we do that.
I want to specifically study what the pullback rule adds to the system. So I isolated the pullback filter to see how the system performs when it buys at a pullback then sells at all-time highs.
This basically looks at the pullback’s effect on the system itself. If the equity curve was flat, that would say the pullback adds nothing. If it was still a decent looking curve, then maybe the pullback is a valid entry.
So while most momentum systems are buying at the highs, this study buys the value region and sells into the 252 day highs. Note that I kept the trailing stop in the system too so that losing trades were still accounted for properly.
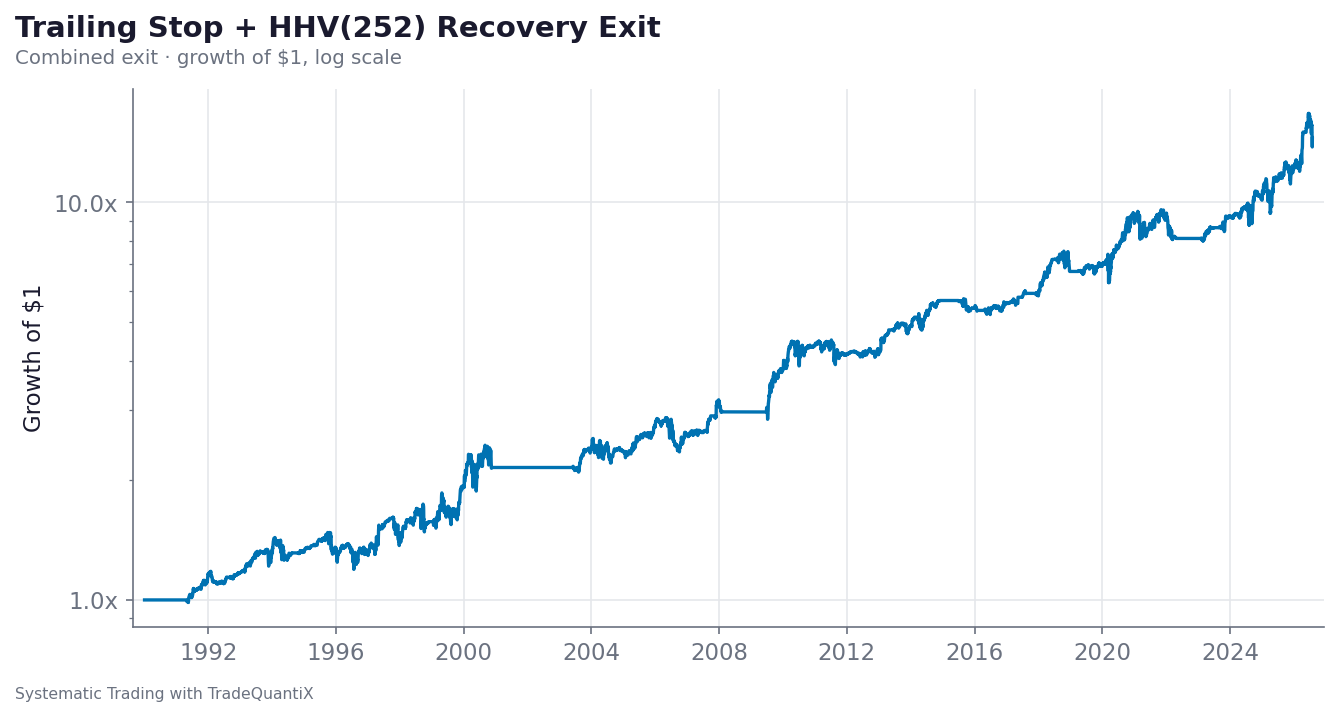
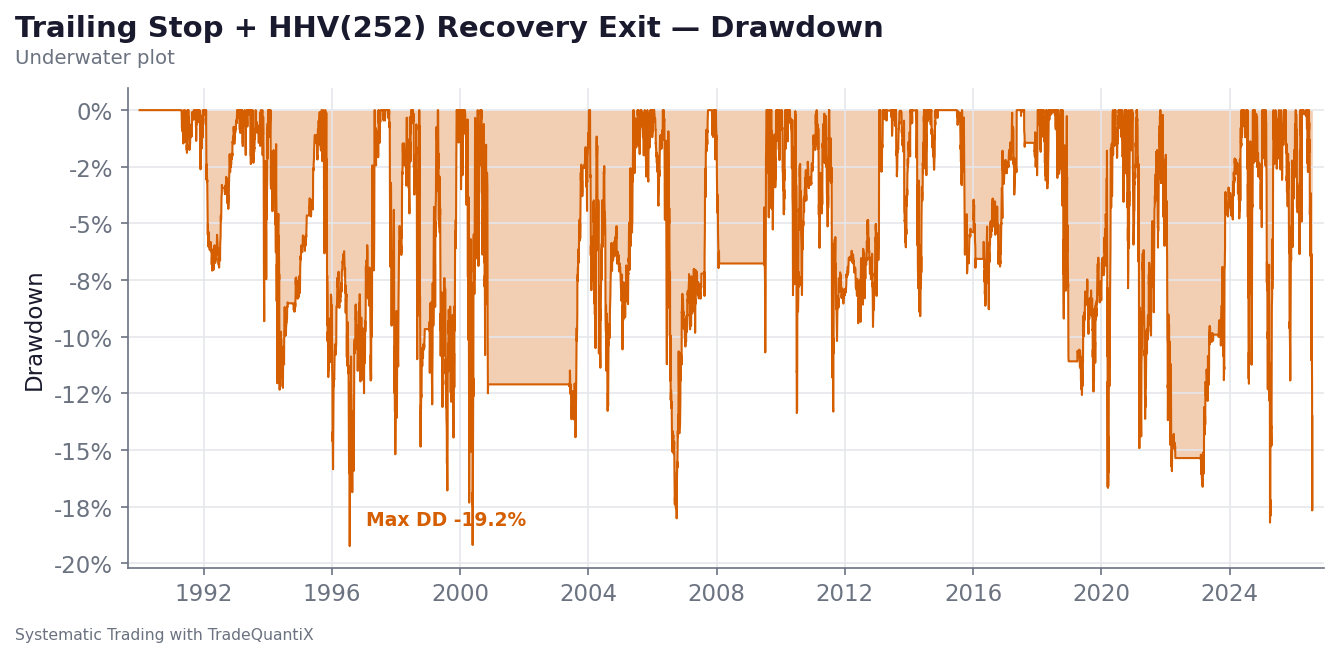
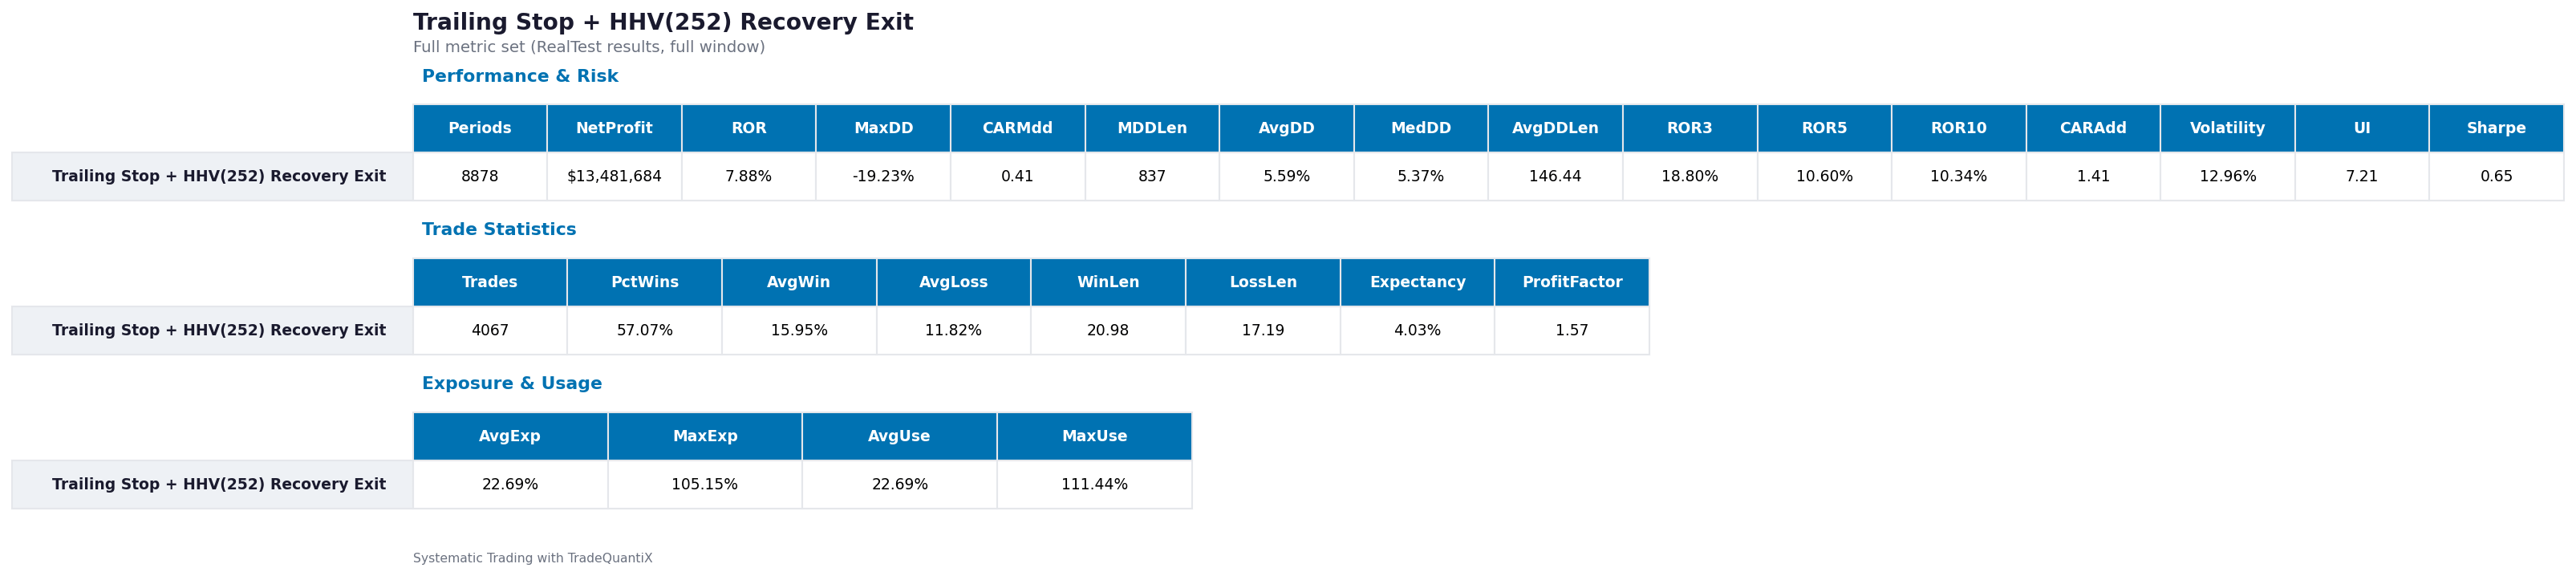
I also studied this with different lookback lengths. The above study looked at the 252 day highs, but I wanted to ensure this result was somewhat consistent across other lookback lengths to make sure it wasn’t a fluke.
The image below shows the result of exiting at N day highs ranging from 20 days to 252 days, along with the nominal pullback system result for reference.
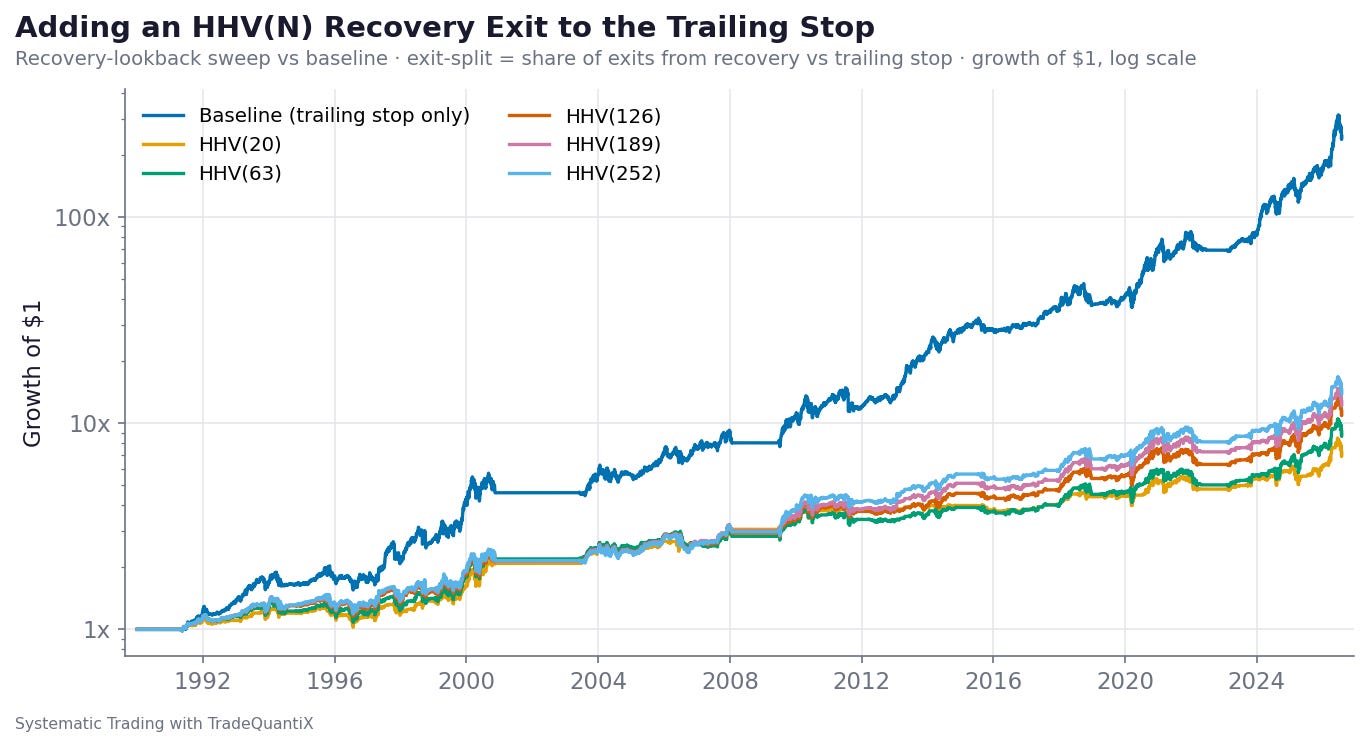
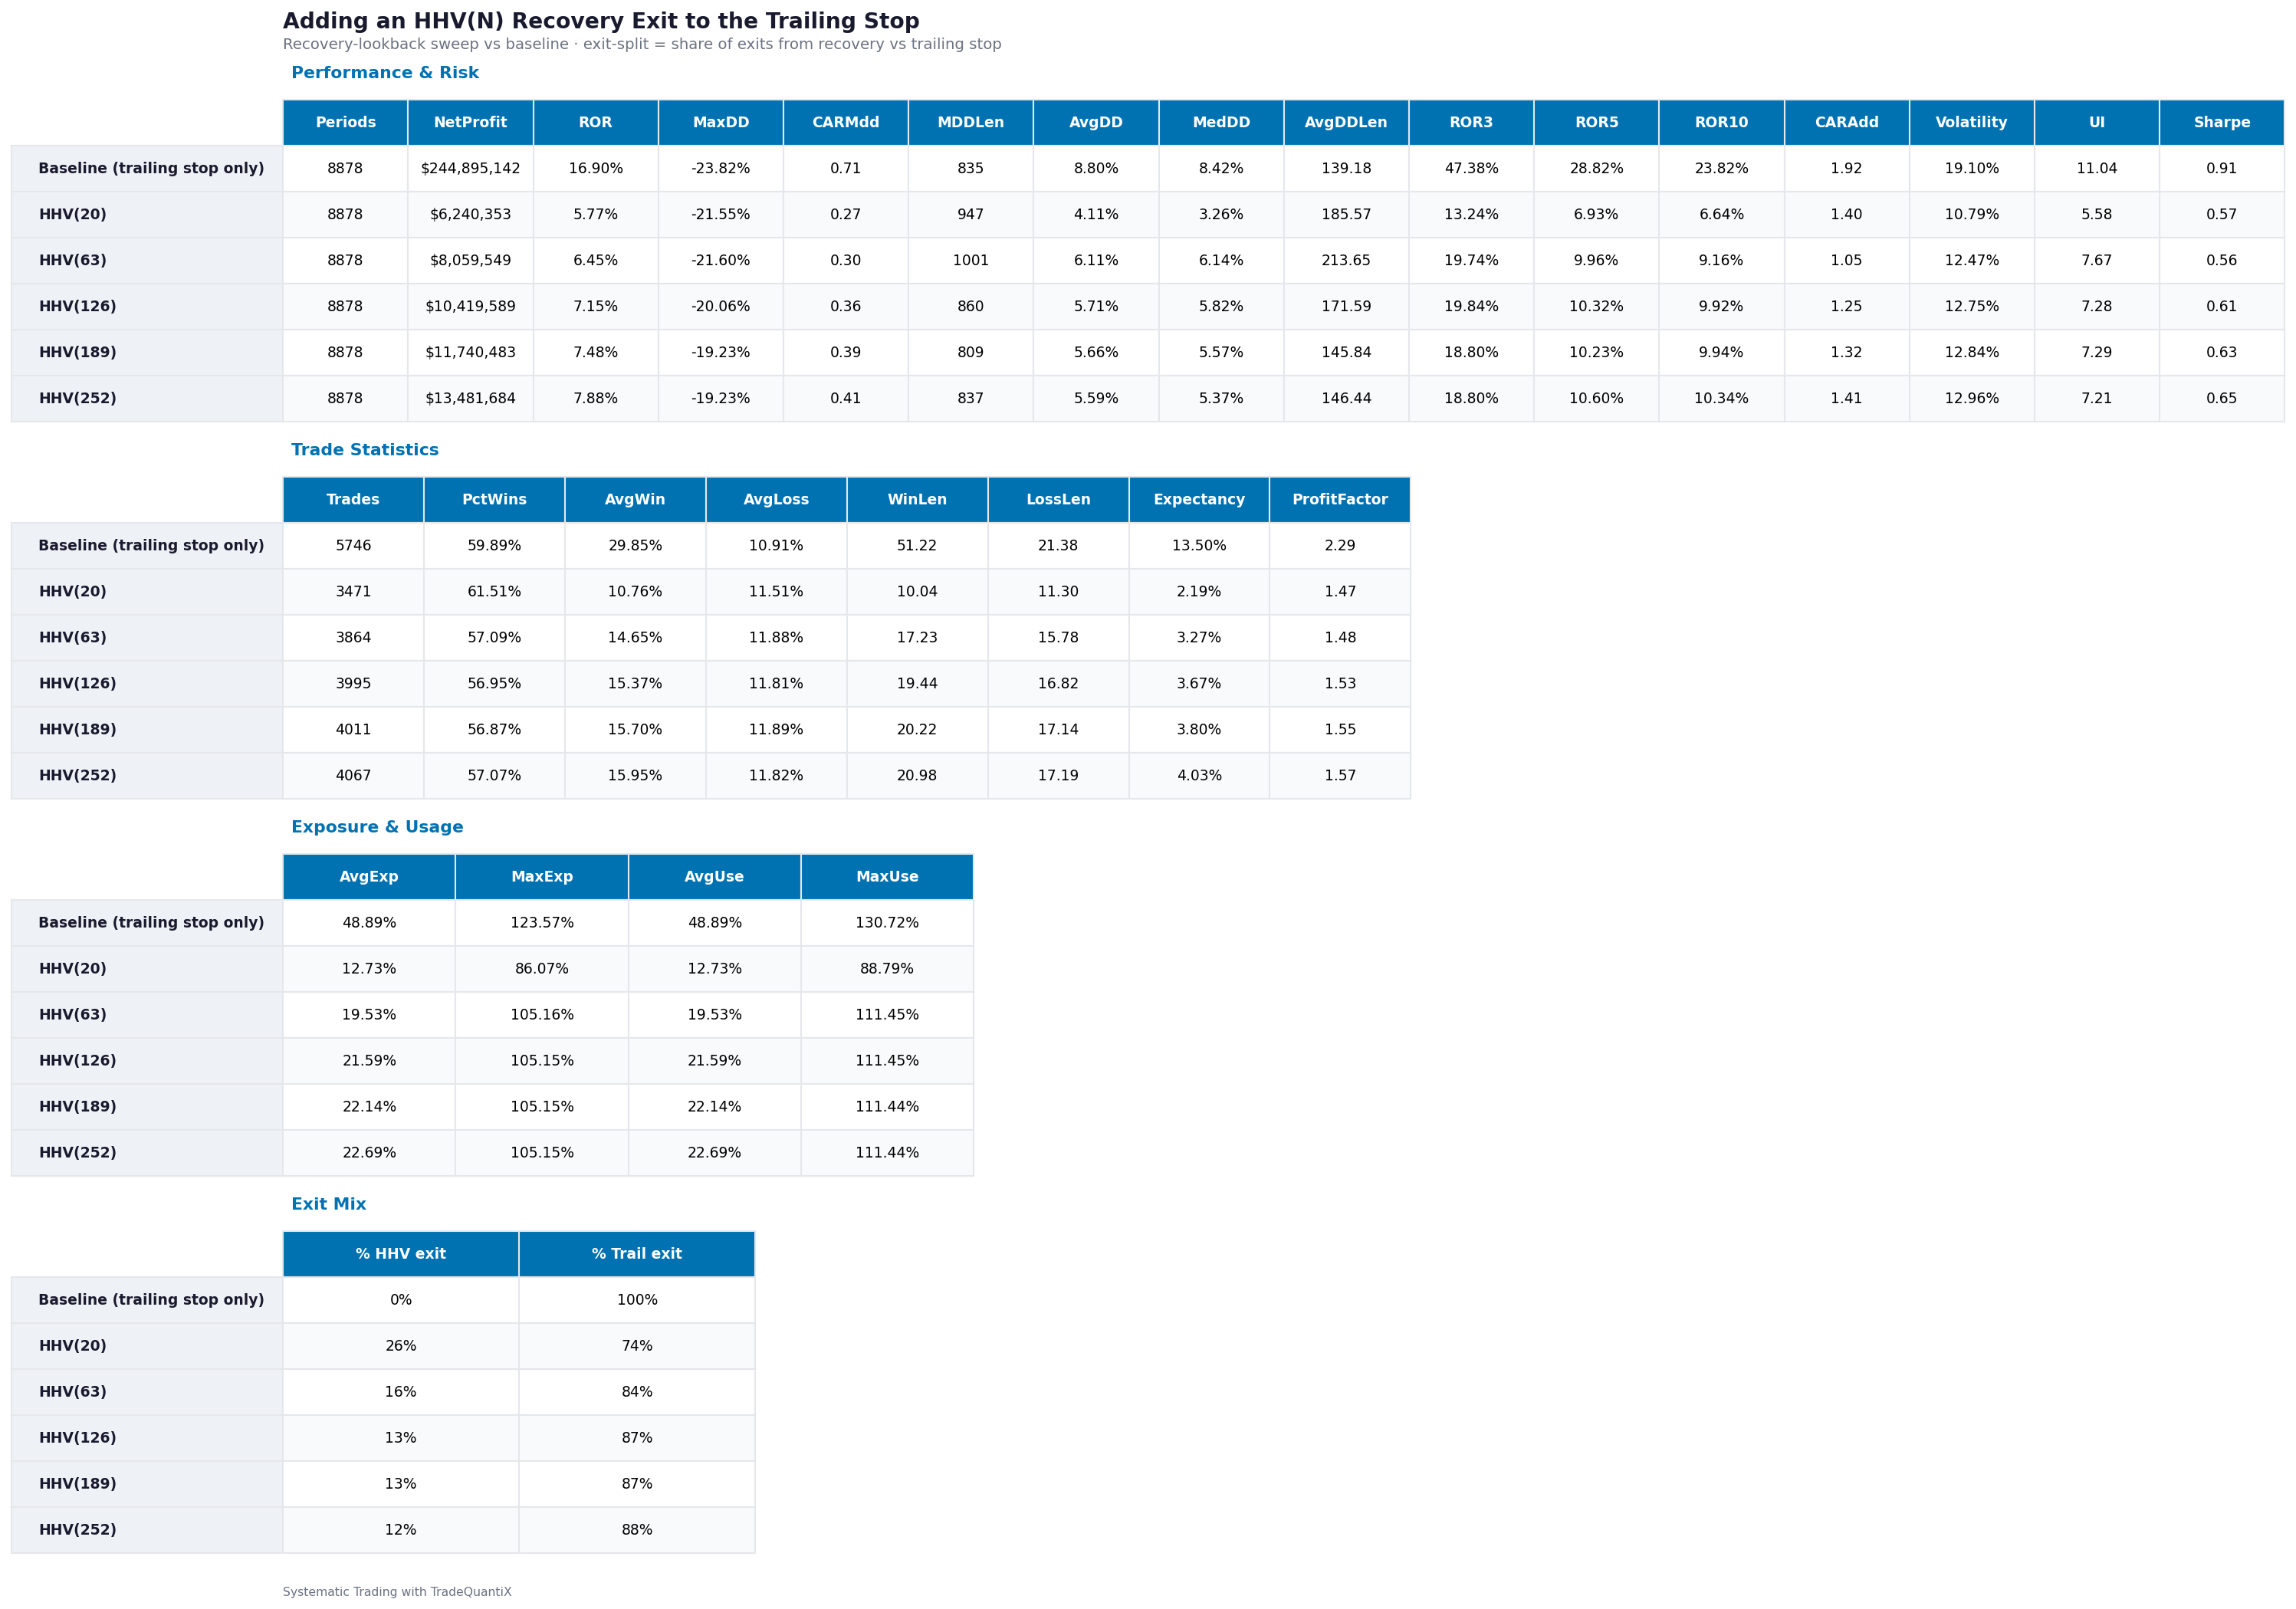
You’ll notice that it doesn’t really matter what N day high lookback we use, they all produce a positive result. This basically shows there is positive expectancy in entering on a pullback and selling into the highs where other momentum systems would be buying.
And here is the result without the baseline pullback system so you can actually see the N day high lookback variants.
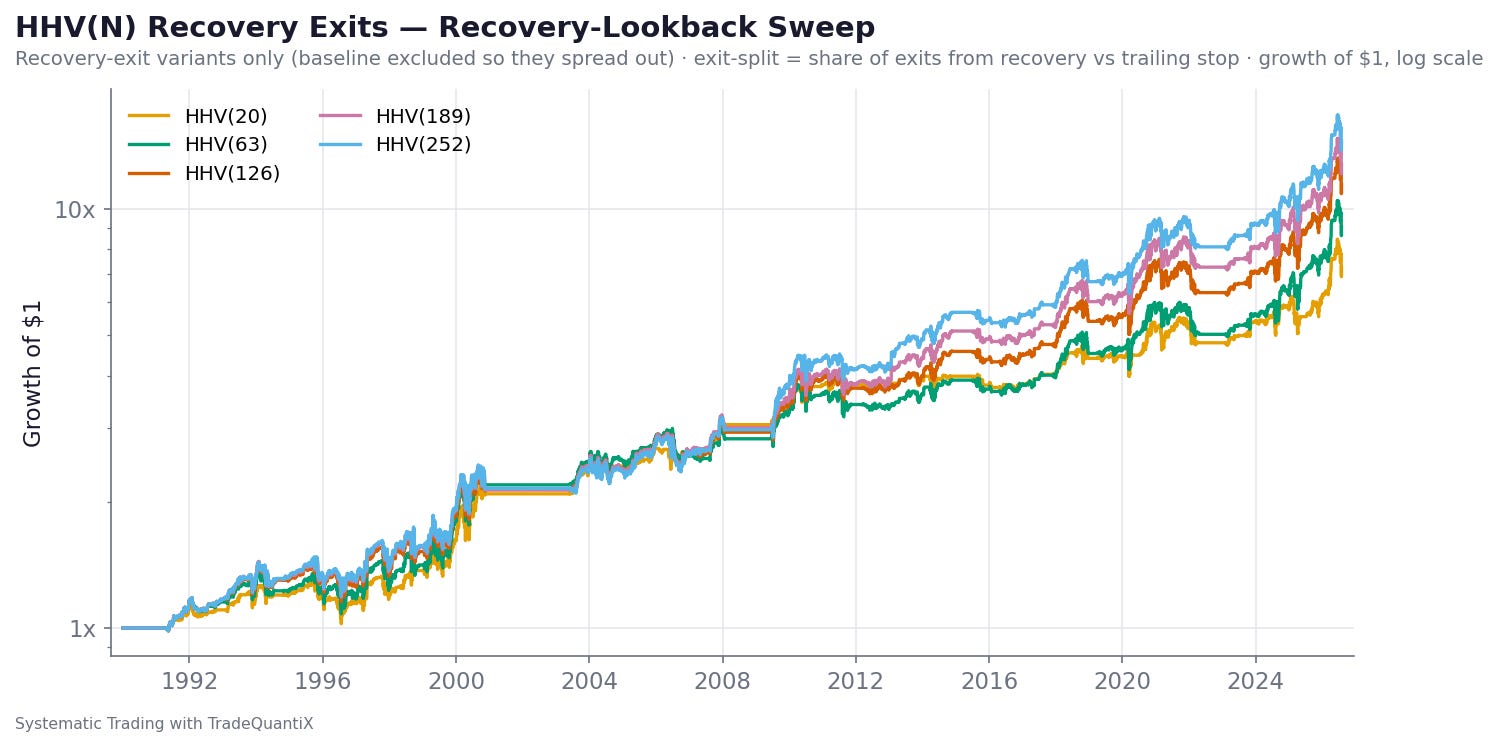
The common sense response here would be:
“No duh it has positive expectancy, you bought at a lower price and sold at the highs. Obviously that would have edge”
I guess maybe using the words “edge” or “positive expectancy” isn’t quite right. Rather, I am trying to show that entering in the pullback value area doesn’t result in a grossly negative skew or long holding periods waiting for the reversion to the highs (and then hopefully more continuation to higher highs after that).
Looking at the average winning trade length for each N day high variant, a winning trade spans from 10 days to 20 days on average. This shows the reversion back to the highs in these high momentum stocks seems to happen relatively quickly, just a few weeks on average.
And these reversions are pretty deep. Remember, this is a 15% pullback minimum. So a roughly 15% reversion back to the highs is the size of the move, which is approximately the average win for most of the different lookback length variants tested.
The baseline pullback system has an average win of 30% and an average winning trade hold time of 51 days. So basically, after all-time highs are hit, the average winning trade tends to continue upwards for 1.5 more months and make another 15% return on top of the 15% made from the pullback itself.
What this tells me is that the pullback helps the system get green on the trade very fast (15% return within a few weeks), then it makes another 15% return over the next few months.
So the pullback interestingly results in winning trades that get in the green fast like a mean reversion system, but doesn’t have the nasty negative tail of a mean reversion system, as the equity curve doesn’t show the aggressive and quick downside events most mean reversion systems have. And losing trades tend to be around a 10% loss on average, which is pretty manageable.
The next thing I did to look at this effect in a slightly different way was to use a time based exit. I ran this time based exit with N = 5, 10, 21, 63, and 126 day holds. No trailing stop, just exit after N days. This study would basically show whether the pullback value entry had an edge quickly, or whether the stock tended to linger in the pullback or pull back further after entry.
If the shorter term holds (N = 5 and N = 10 days especially) showed zero to negative edge, that would be a bad sign for the fidelity of the pullback entry. We are considering the pullback entry because ideally it should add something at the system level AND the portfolio level. So we want to see some positive expectancy fairly quickly after the entry.
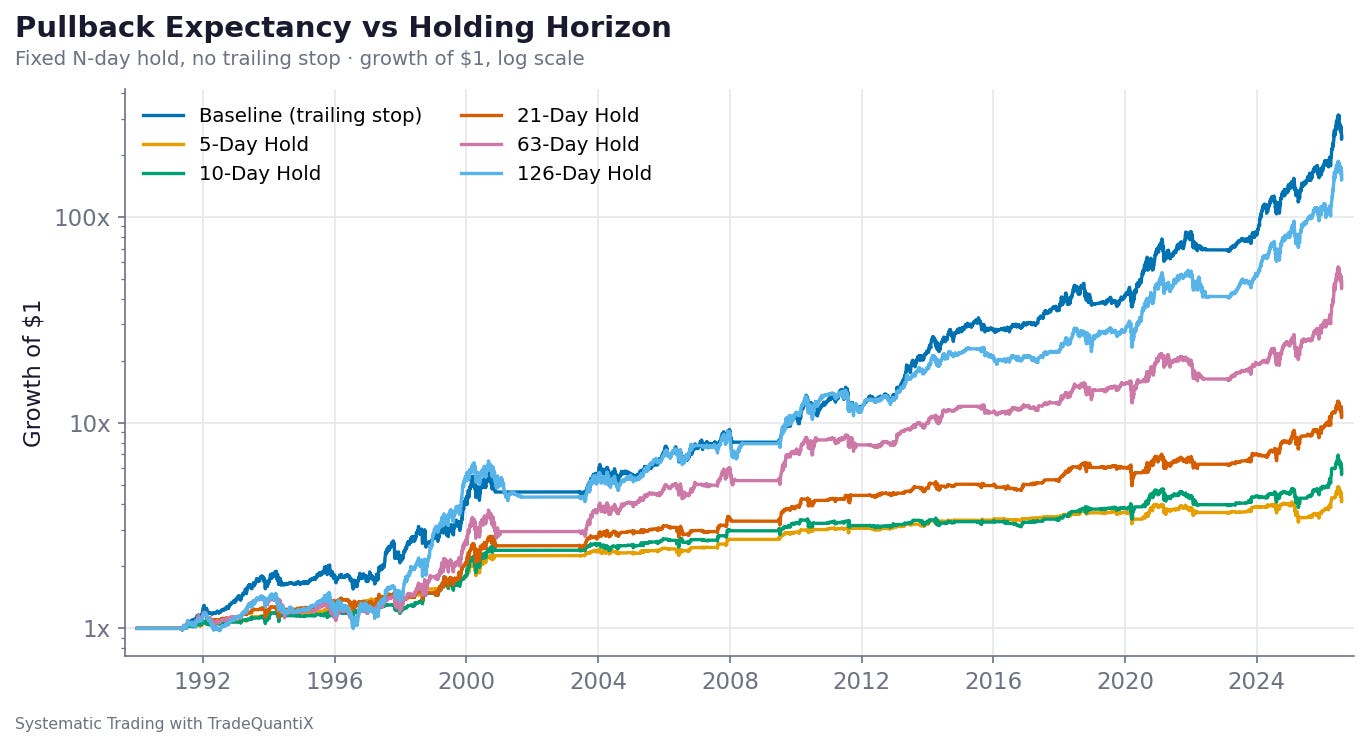
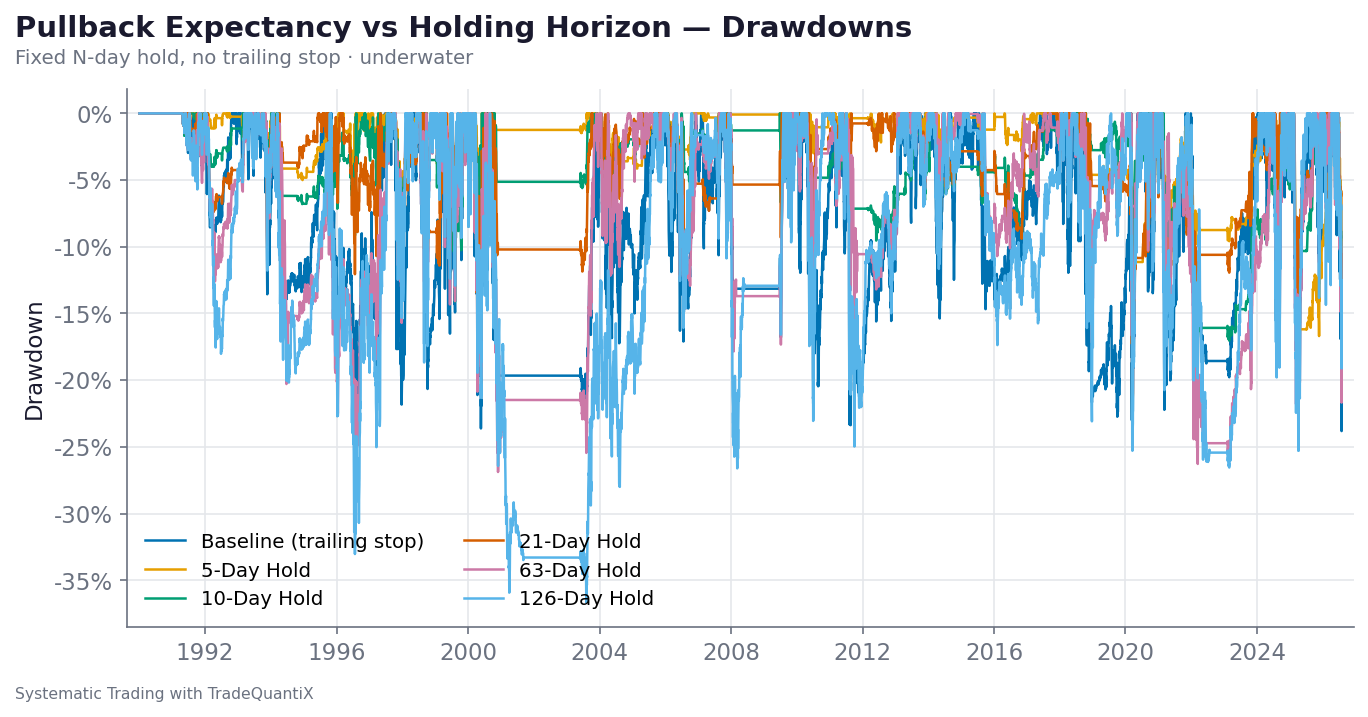
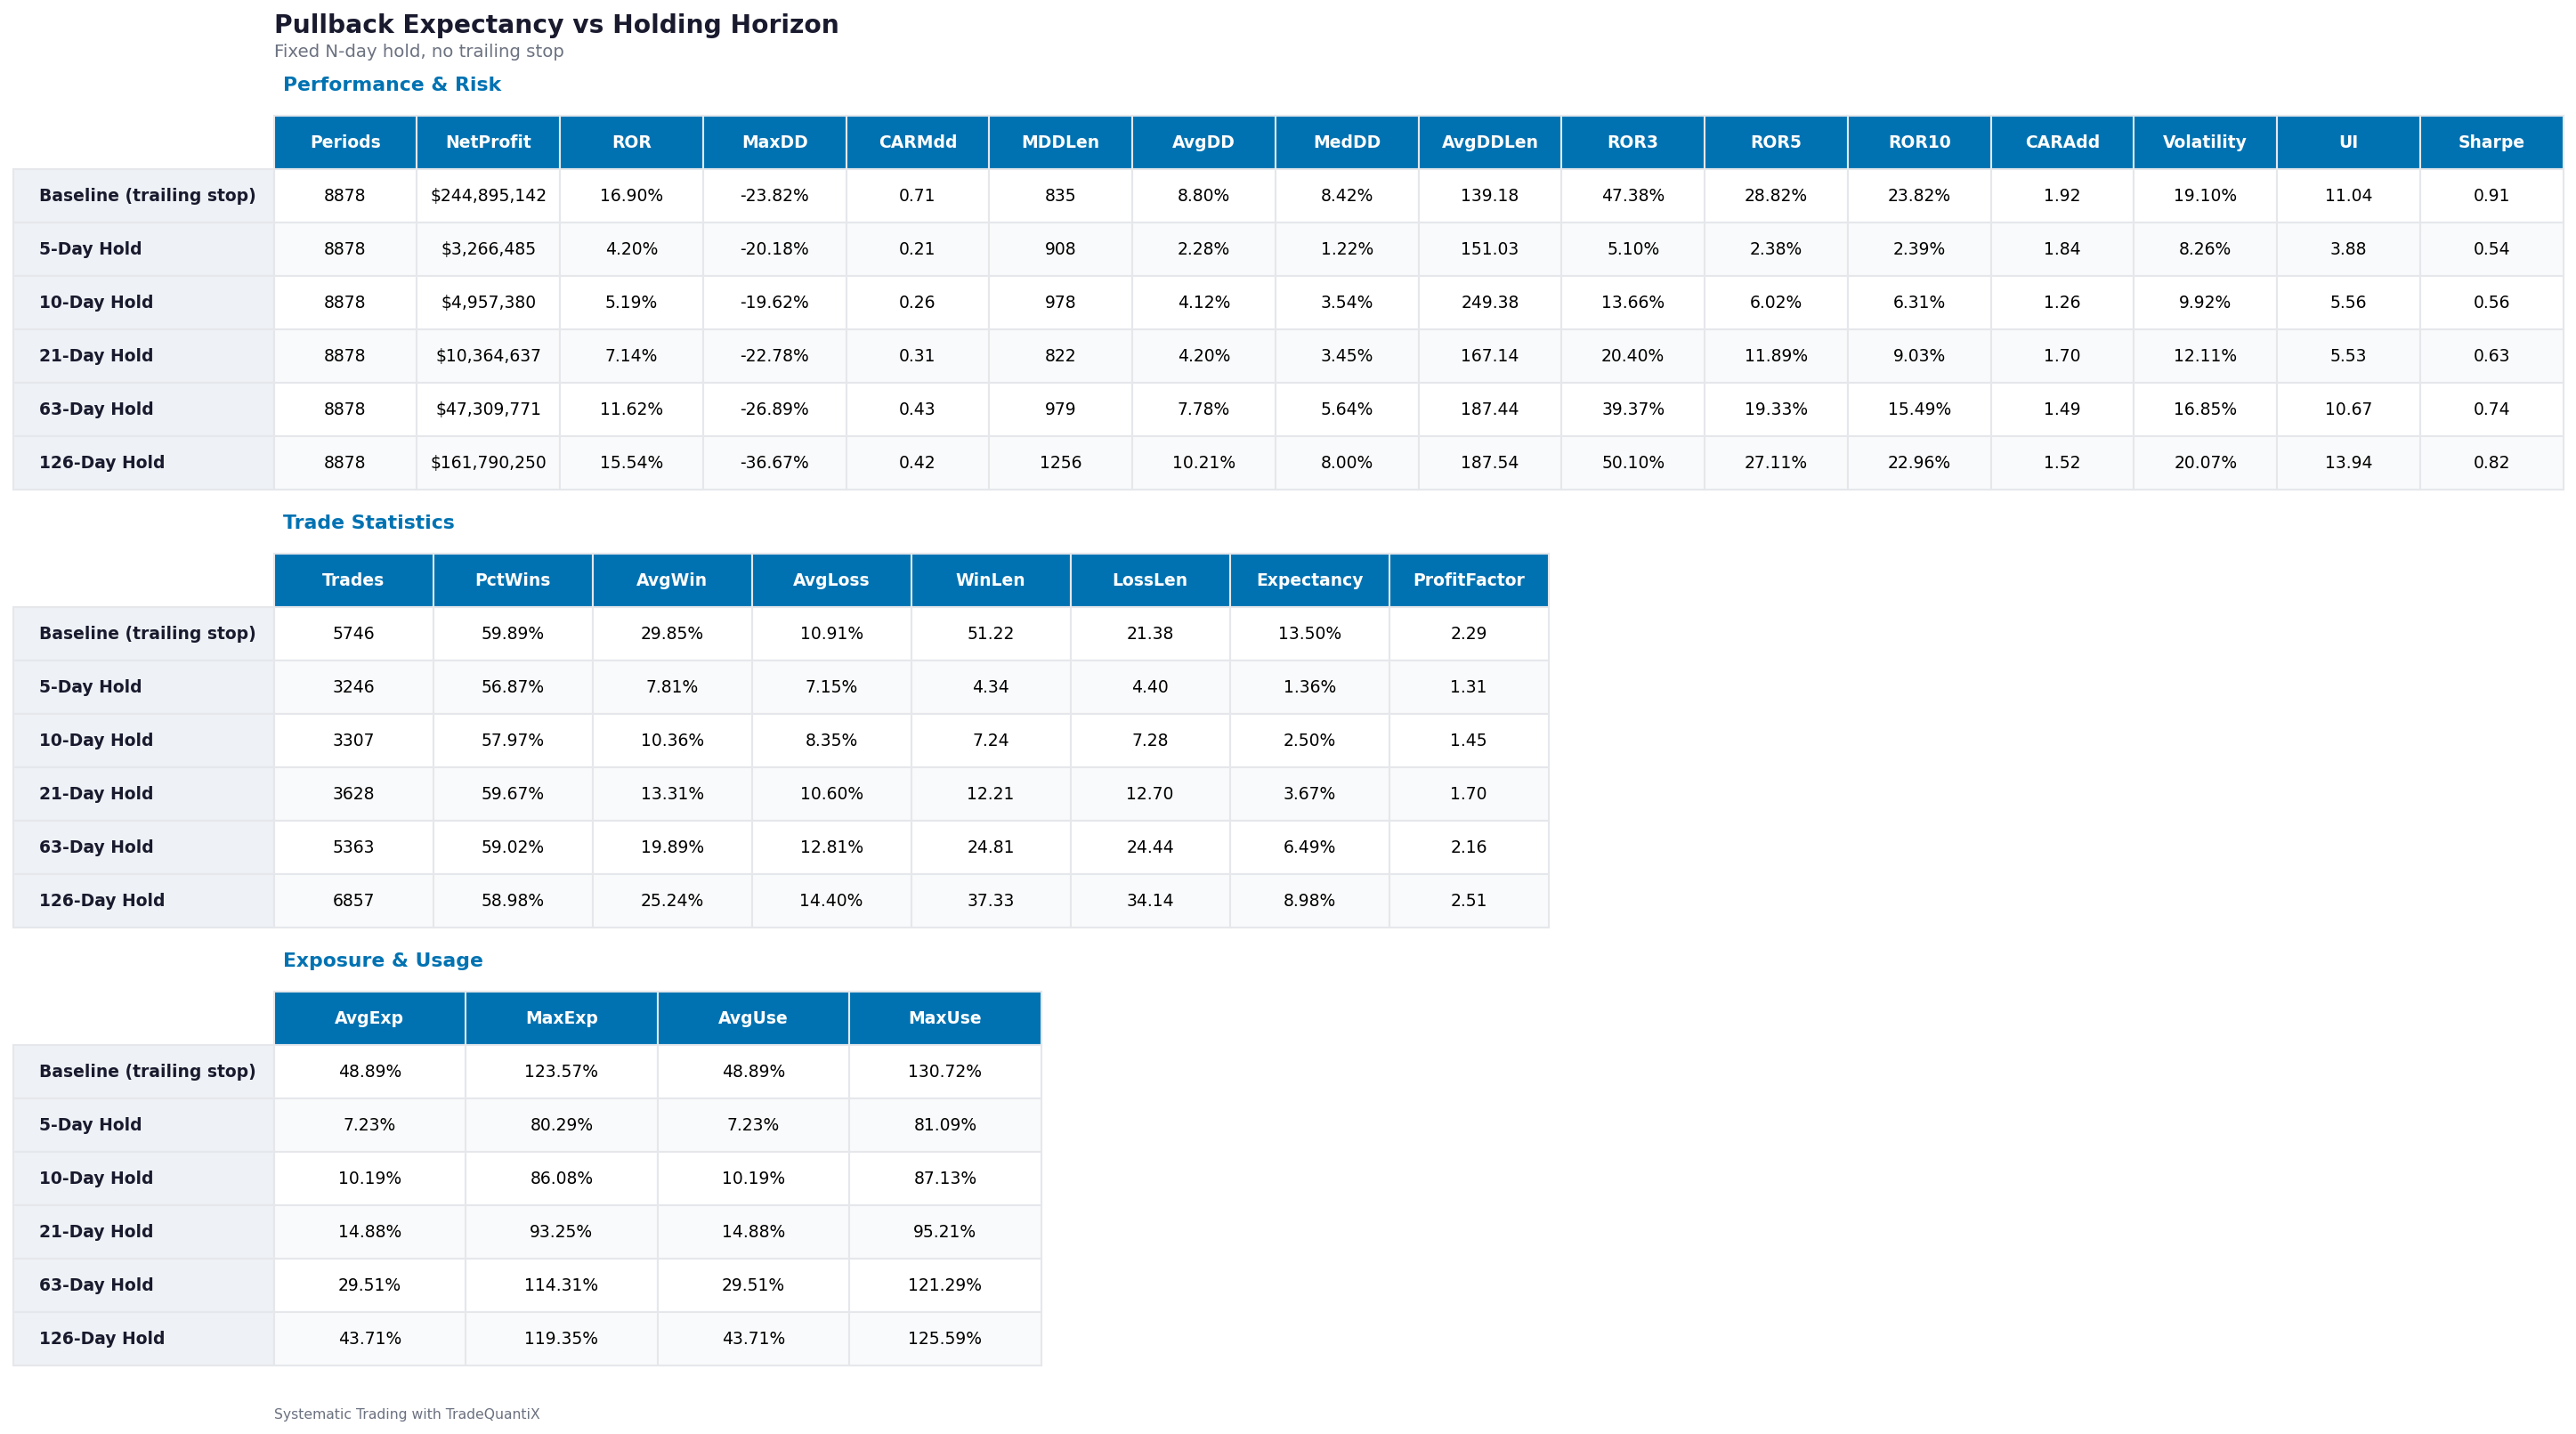
This time based exit is good at showing how quickly the system’s edge comes to fruition. In this case, all N day exits show positive expectancy. That’s a good sign for the pullback entry mechanism. The longer the system holds, the larger the return/edge it captures, which makes sense as market beta has more time to play out.
But the part that’s important, at least to me, is that the pullback entry has positive expectancy even just 5 to 10 days after entry. This gives me more confidence that this rule could be a real adder to the system and isn’t just complexity for the sake of complexity, or complexity for the sake of diversification.
I don’t want to add rules to a system that don’t make sense just for diversification’s sake. That just adds noise to the system that’s not real.
If I am going to have a rule in a system that helps provide diversification, I want that rule to still actually be robust.
In this case, we showed in two different ways that the pullback rule seems to result in positive expectancy quickly. And once the stock hits new highs, which is when most other momentum systems are entering the trade, this system is already 15% in profit and holding for the continued move to higher highs.
Pullback Entry vs. No-Pullback Entry Correlations:
Now let’s talk about correlations.
Here are some plots showing a month by month correlation scatter of returns and drawdowns for the momentum system with the pullback at 15% vs. a version without the pullback rule at all:
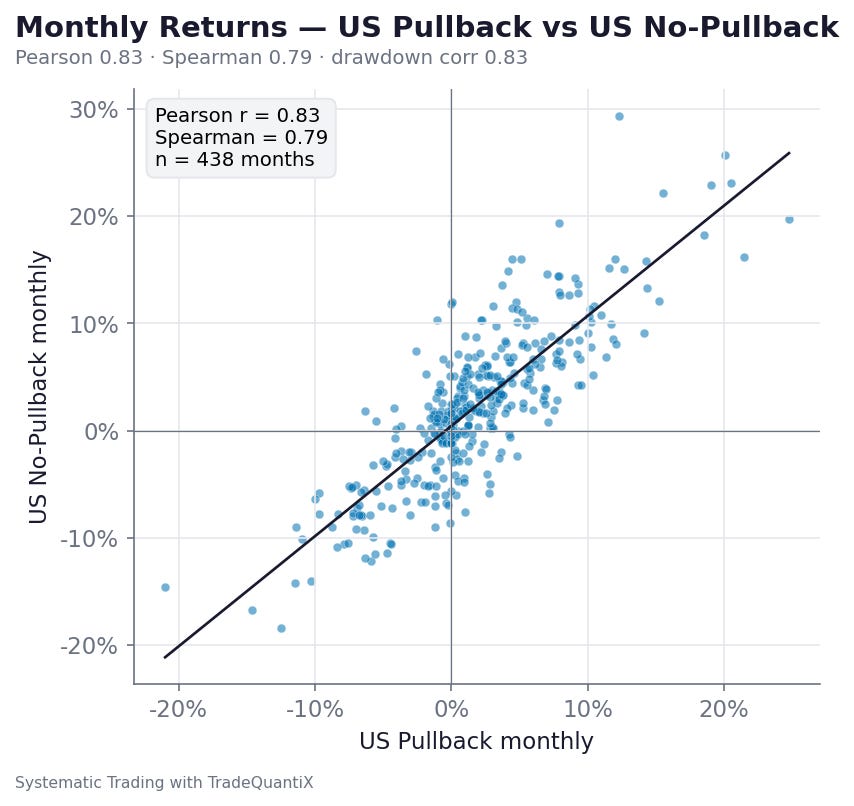
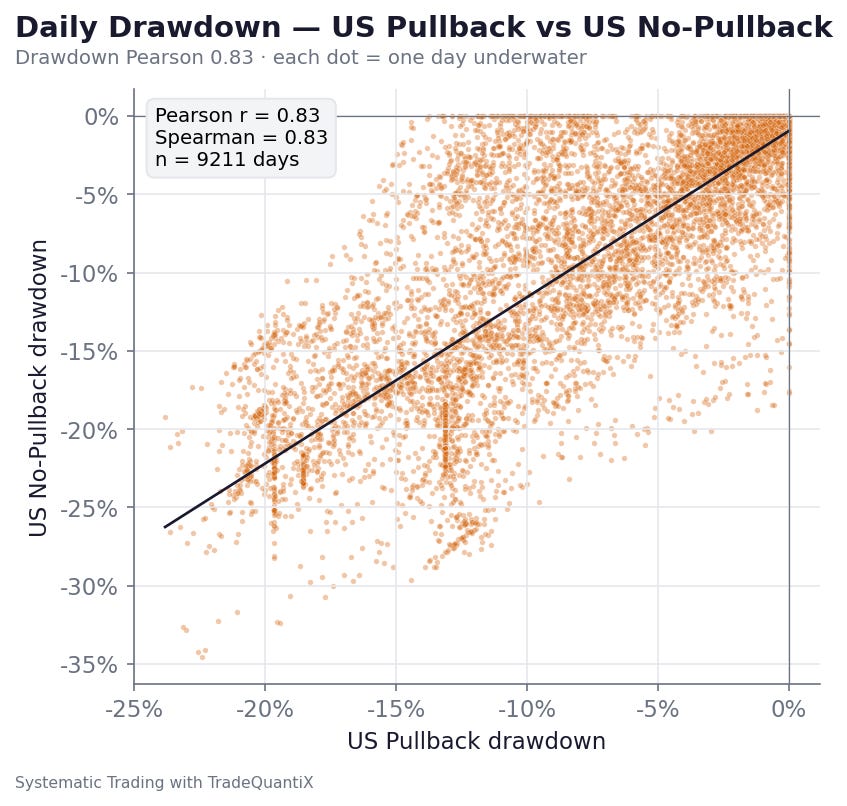
And here is the 12 month rolling correlation between the two systems for returns and drawdowns:
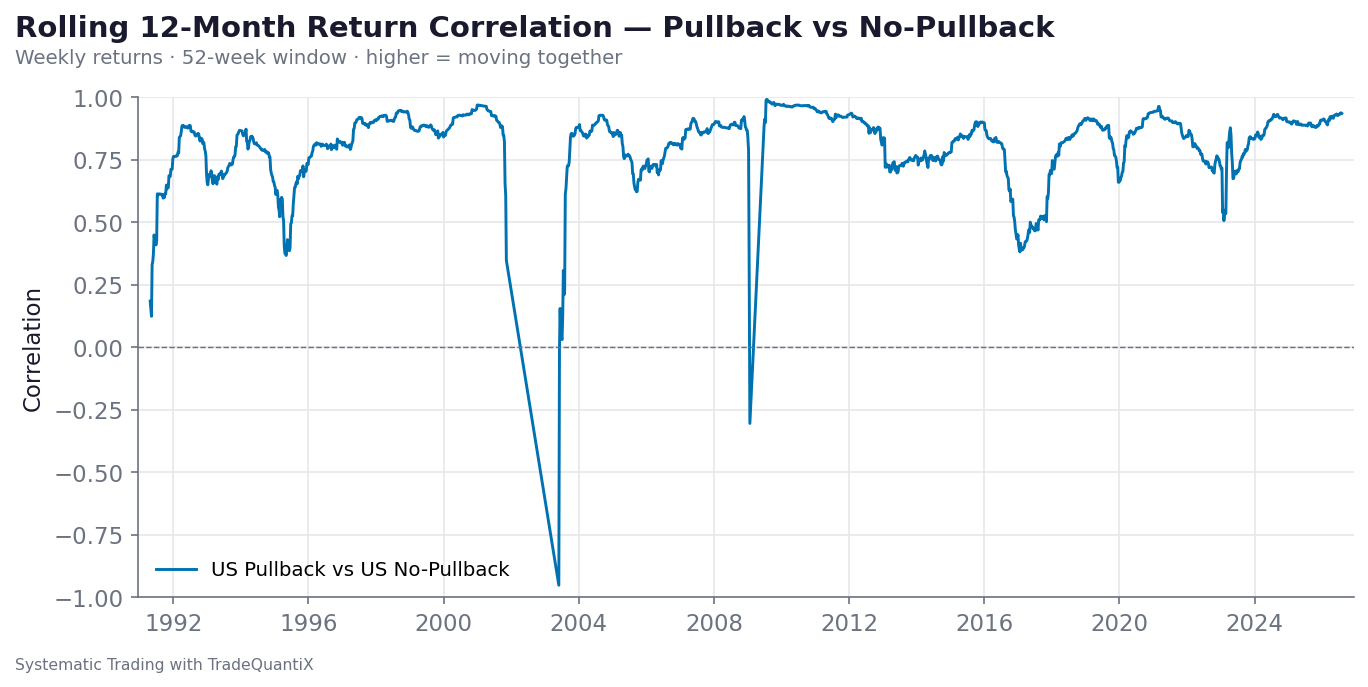
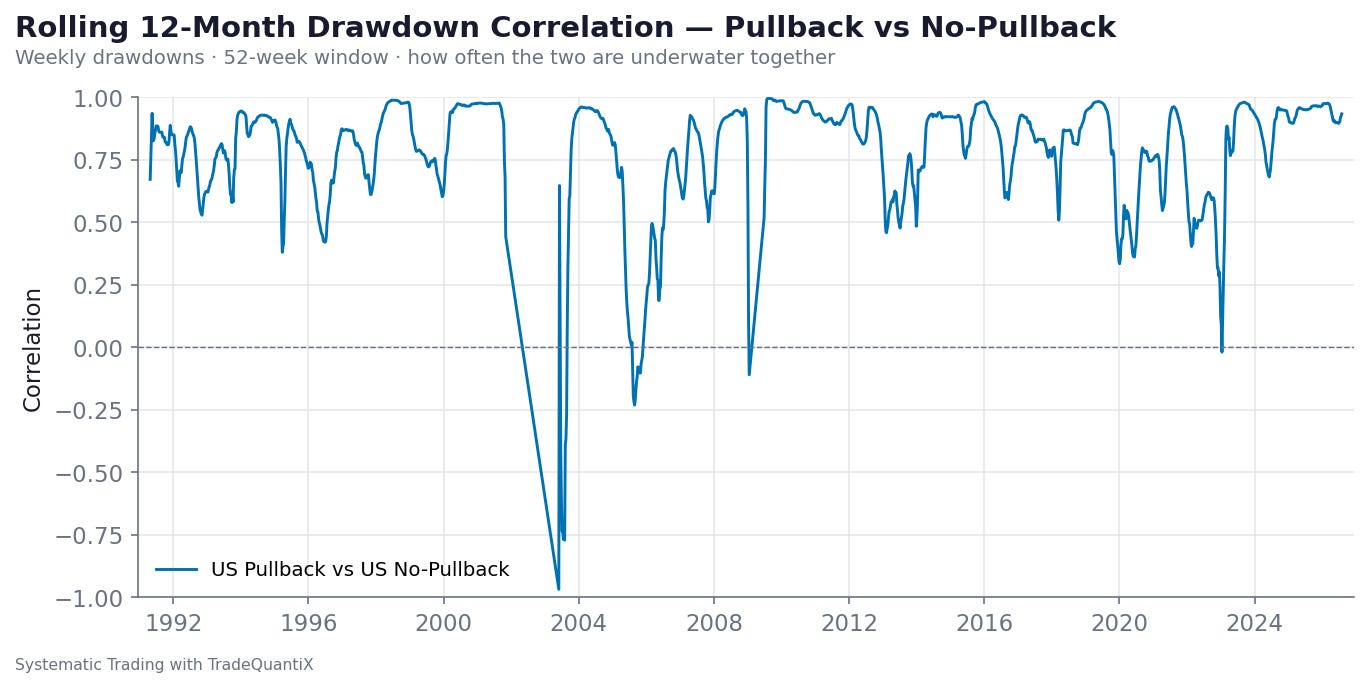
Correlation is interesting because ideally you want your systems to have low correlation. Near zero, or even negative.
Negative correlation would act like a hedge of sorts, where one system is going one way while the other is going the opposite way.
A zero correlation simply means the two systems are doing different things at different times, and the result is the average of the two, which is a smoother portfolio equity curve.
When correlation is 1.0, you have both systems doing the same thing at the same time. You are not really getting any equity curve smoothing. Your portfolio just becomes an amplified version of one system.
So if you have a bunch of systems laying around and you are trying to figure out which one to add to your portfolio next, the simplistic answer is whichever one has the lowest or most negative correlation to what you’re already trading is probably the best choice.
But if you already have a portfolio of many systems, maybe 20+, you do not always NEED a low correlation system to still get some benefit.
Don’t get me wrong, low correlation robust systems are generally great adders to a portfolio, but once you have a sufficient base of trading systems, adding another uncorrelated (or correlated) system isn’t going to move the needle much. You’ve kind of hit the point of diminishing returns in terms of portfolio smoothing.
In my eyes, once you’ve hit 20+ systems, the reason you’re adding more systems to your portfolio isn’t to smooth your equity curve anymore (by this point it’s probably 90% to 95% of the way to as smooth as it will ever be), you’re adding more systems to protect yourself from what a backtest can’t show you.
Those things could be:
Tail events
Curve fitting
Unlucky parameter selection
Strategy decay
These are not things a backtest can tell us or predict. There are tools and methods we can employ to look for warning signs, but there is nothing a backtest can predict about the next tail event, or whether the market will shift and the 200 day lookback won’t be nearly as good as the 100 day lookback over the next 5 years. Or our strategies may start to decay as the market gets more efficient, etc.
We can develop our systems properly, robustness test them thoroughly, create a portfolio of diversified systems with zero or negative correlation, size the systems sensibly relative to their volatilities, and do all these things right… and the portfolio could still lose money over the next 5 years!
Whether that’s due to being unlucky, accidentally curve fitting a few systems, strategies decaying, or the markets crashing like 2008 but worse, these are things that can make an otherwise textbook-perfect portfolio crash and burn.
So bringing this back to today’s discussion, the pullback momentum entry vs. a normal no pullback momentum entry, there is a reason why we might consider trading both of these strategies even though their correlations may be high. It’s to account for those things the backtest doesn’t show us.
Sure, the math says the correlation is pretty high between the two versions of the momentum system. But the correlation math can’t tell us if next month the pullback version of the system will buy the bottom of a sell-off before a rip higher, while the non-pullback version sits in cash and misses the whole move (which is exactly what happened in my own portfolio!).
The correlation math can’t tell us if buying all-time highs will become more reversionary as time goes on and markets get more efficient, while maybe pullbacks will revert harder in the future due to the never ending retail “buy the dip” mentality and the never ending institutional bid on mega caps.
The correlation math can’t tell us that when the next 2008 or 2020 like event comes, one system will get burned while the other will sidestep the whole downside move.
Basically, what I am trying to say is there is no amount of backtesting or portfolio math you can do to say that one of these systems deserves to be traded more than the other. They both deserve to be traded because they get you into different stocks, at different prices, at different points in the trend cycle, etc.
Adding both system variants to an existing portfolio of 20 systems vs. adding just one of the momentum systems to that portfolio probably won’t make a meaningful difference to portfolio stats. But it does make your portfolio more robust, less susceptible to luck, and at least allows me to sleep better at night knowing I have many “pairs of eyes” observing and trying to trade the same market phenomena in slightly different ways.
It’s just another pair of eyes looking for that next massive trade, the one that makes your whole year. Having more systems increases the likelihood that you capture that trade.
All that said, we are making a momentum mini-portfolio, so we will have other momentum systems on other markets which have lower correlation than the pullback vs. no-pullback US momentum systems have to each other.
Here is the US momentum pullback vs. no-pullback vs. TSX momentum system from the part 1 article in this series, side by side in terms of correlations:
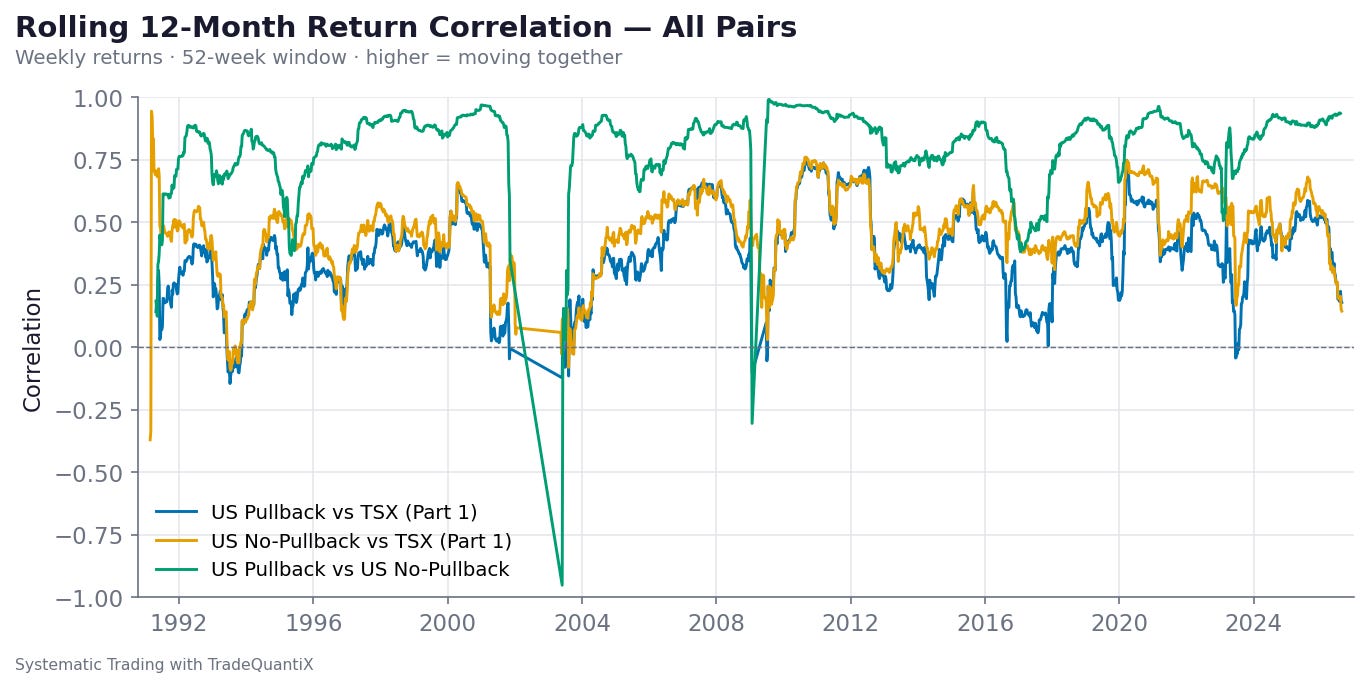
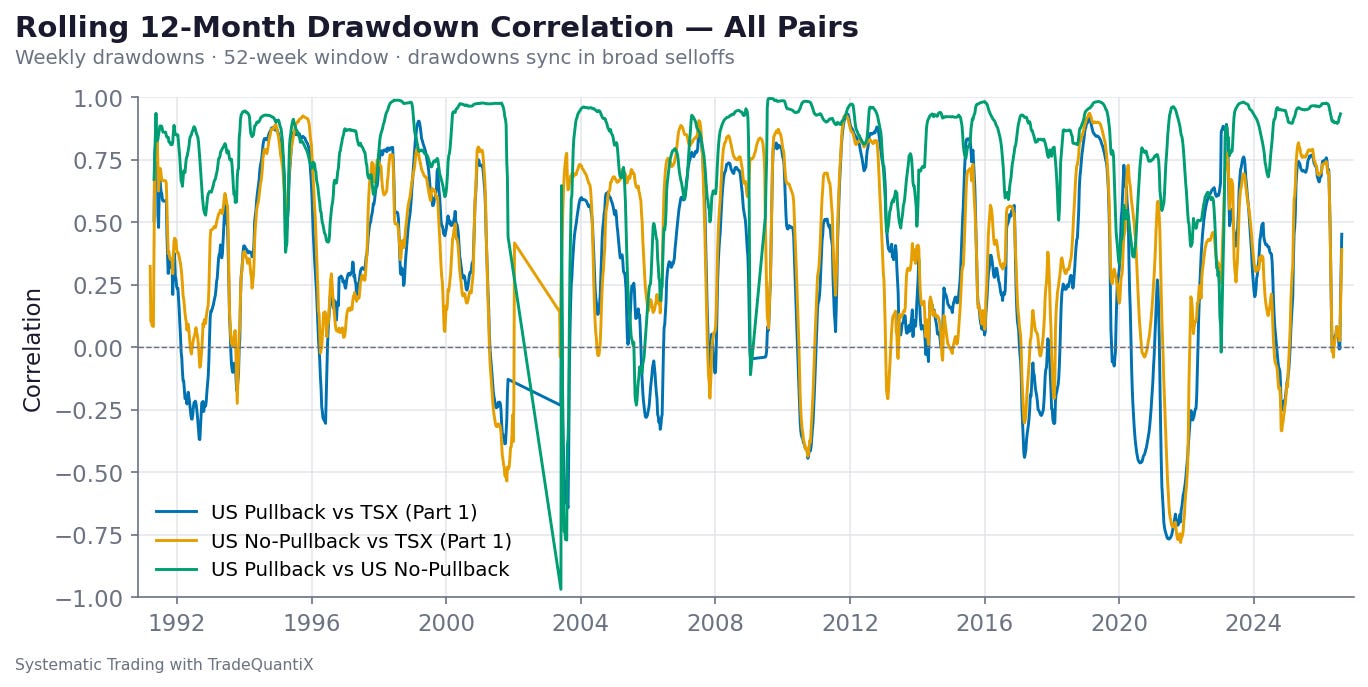
The TSX momentum system compared to either US momentum system has a lower correlation than the two US momentum systems compared to each other. So we will get a diversification / portfolio smoothing benefit having the TSX system in there as well.
My argument above is that rather than trying to figure out which US momentum system you should trade, just trade both. This is because they cover you from two angles and serve different purposes (buy momentum at highs vs. only in pullbacks).
There is no way this can do anything other than make your portfolio more robust to system decay and luck (or more like un-luck).
The Pullback Rule Is Tunable:
The cool thing I noticed about the pullback rule is there isn’t really a region of stability vs. instability in parameter values. Rather, the rule just further restricts the trades that get taken as the pullback threshold increases, and the system doesn’t necessarily get worse or decay, it just becomes more selective.
The plot below shows how many stocks in each of the three universes are in a 10%, 15%, and 20% pullback or more.
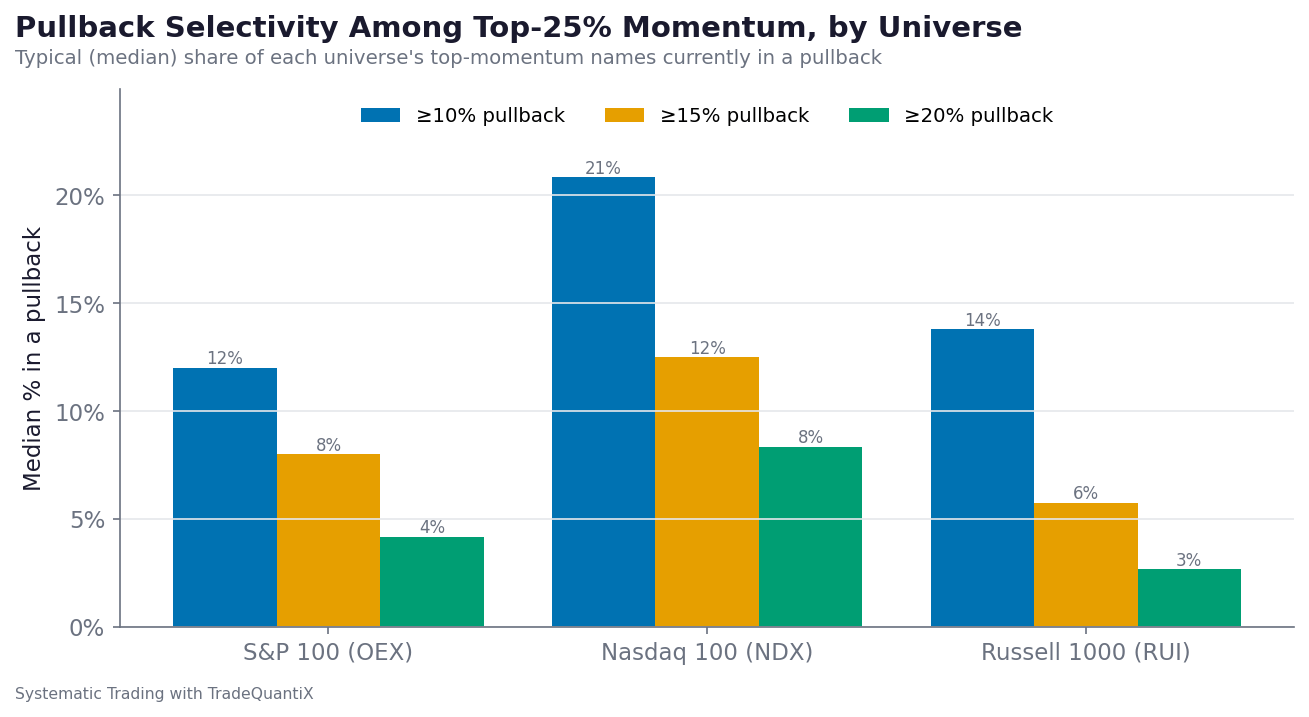
Obviously, the higher the pullback, the fewer the stocks to pick from for trading, so the less the system will be invested as you require a higher pullback percentage.
To illustrate this, I plotted 10 variations of the system below, all with different pullback percent thresholds: 0% (no pullback), 12.5%, 15%, 17.5%, 20%, 22.5%, 25%, 27.5%, and 30% pullback.
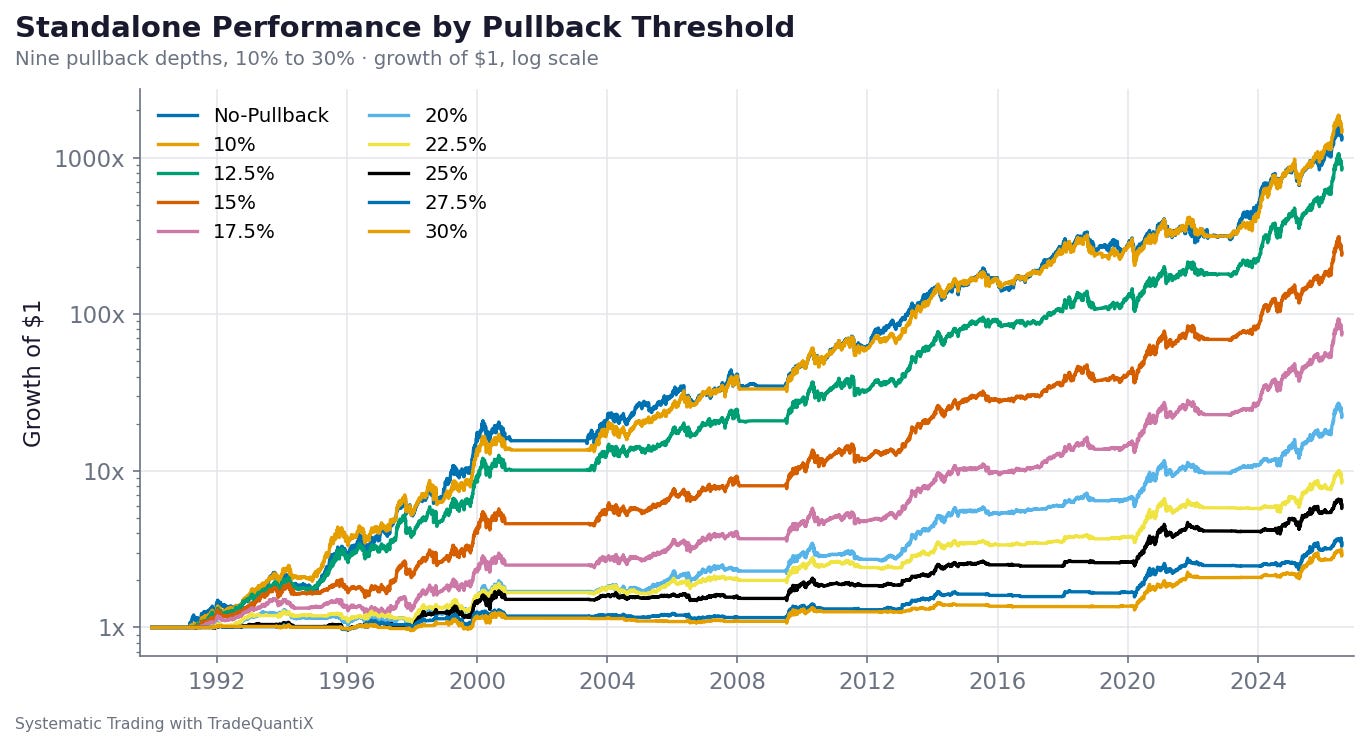
Higher pullback percentages result in more time with idle capital. Lower pullback percentages result in higher exposure on average.
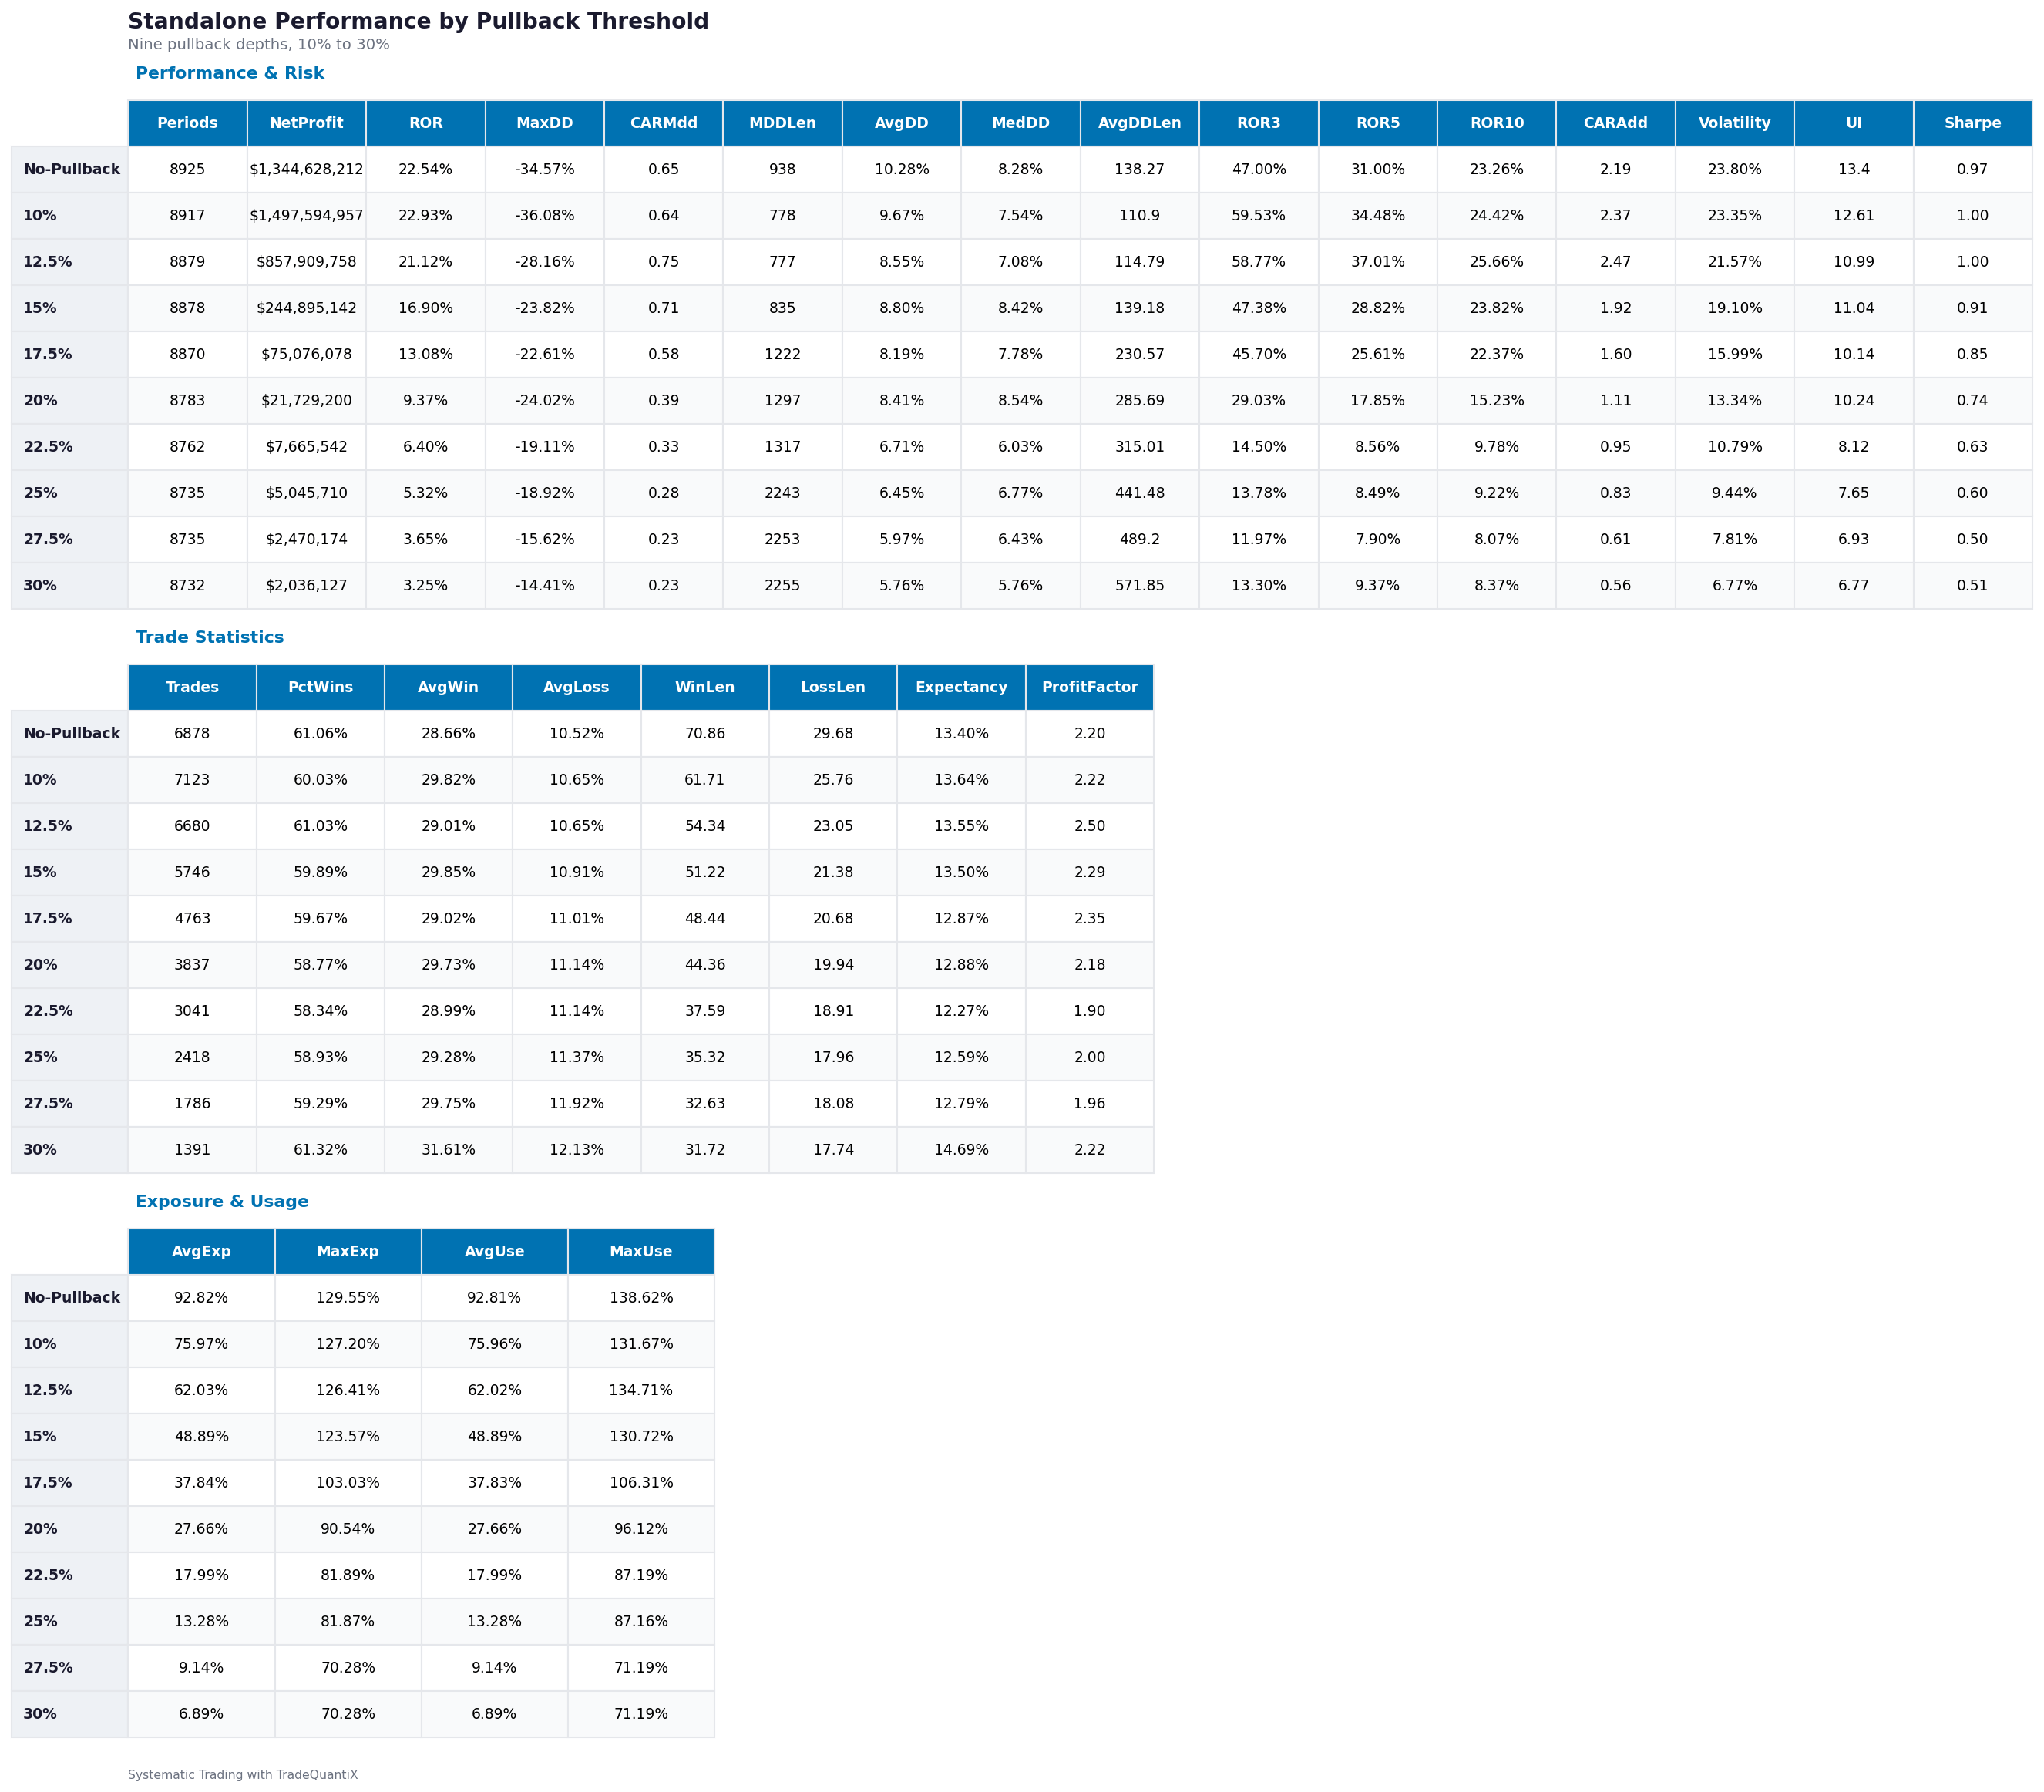
If the table below is large enough to be readable (hopefully you can zoom in!), you’ll notice the trade statistics are relatively consistent.
This means the quality of trades holds up as pullback percent increases. But average exposure decreases as pullback percent increases, and therefore returns (and drawdown) decrease with average exposure.
In the equity curve plots above, the super deep pullbacks were maybe a bit hard to see as they get drowned out by the higher returns of the shallower pullback variants. So the plots below may help you see the equity curve results a little better.
I split the results into two groups: shallower pullbacks (0% to 20%) and deeper pullbacks (20% to 30%).
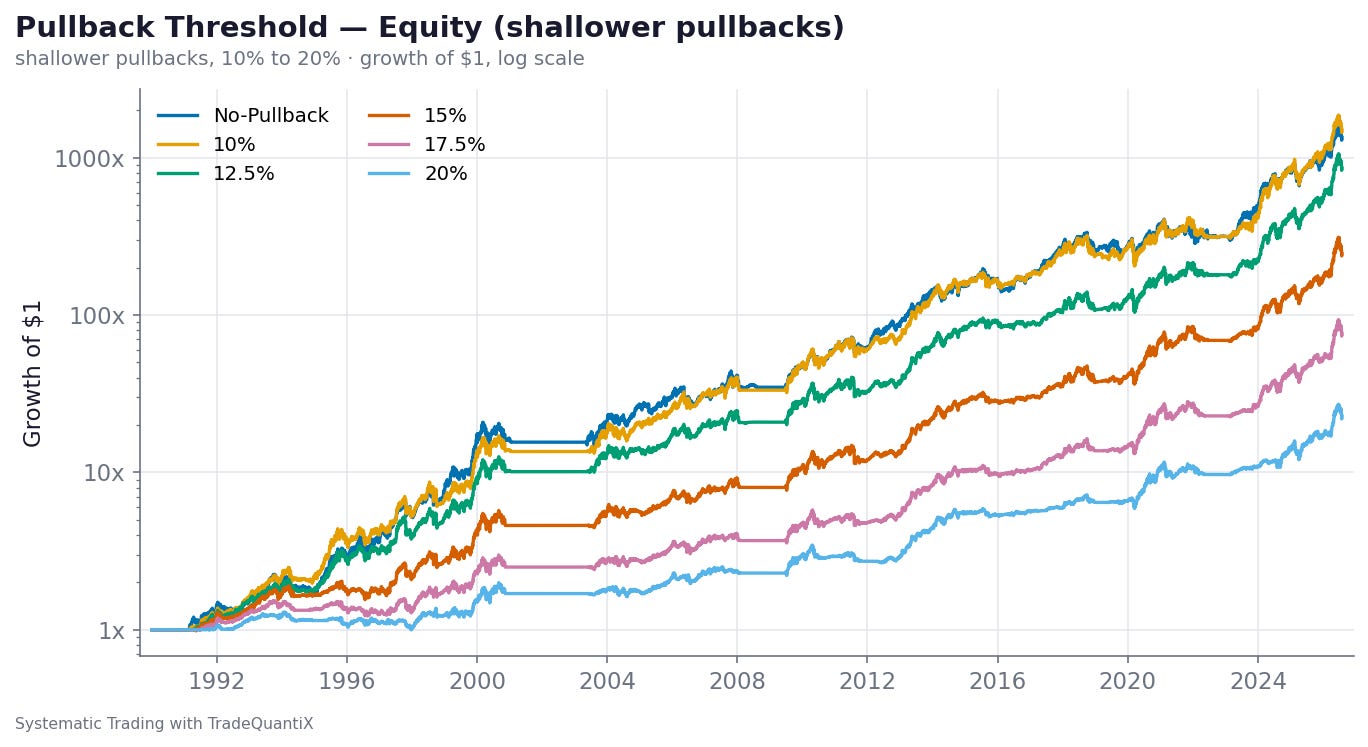
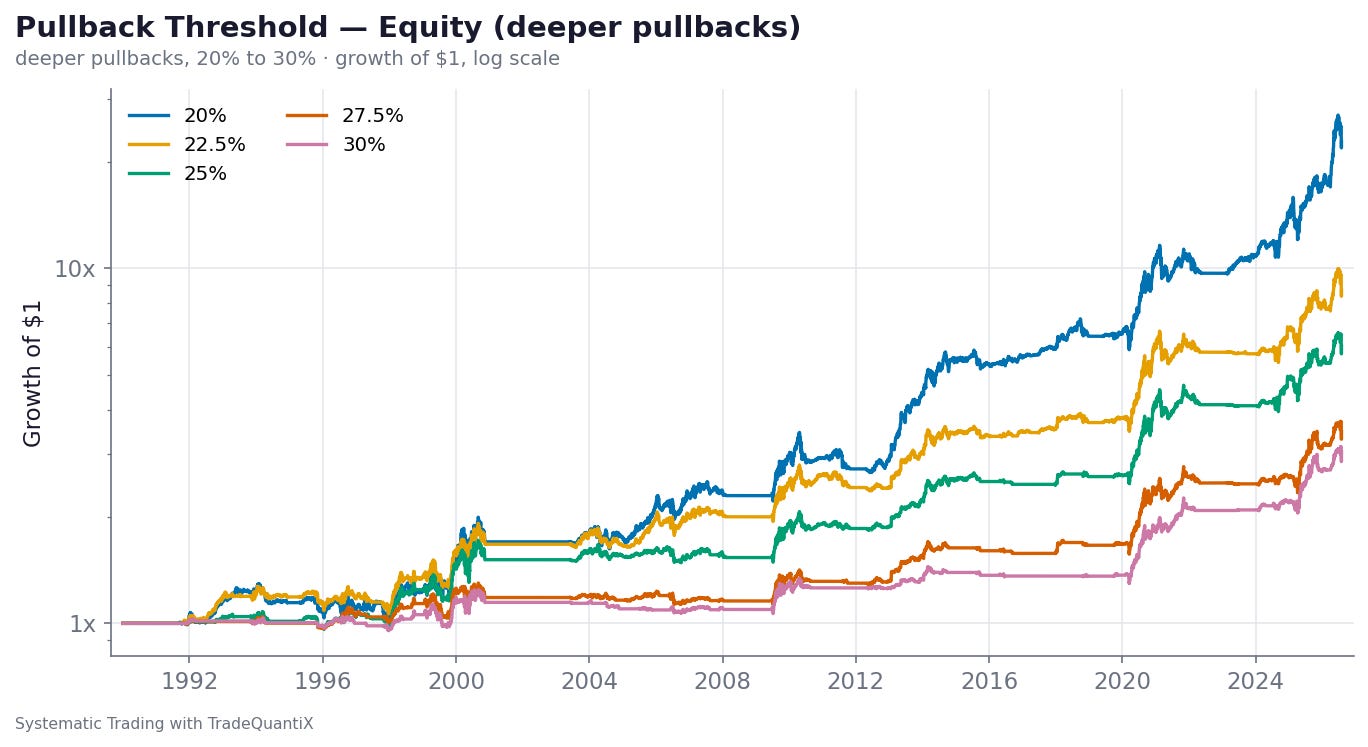
The cool thing about the deep pullback variants is they could be used to directly add exposure to your portfolio during market rebounds after deep corrections and capture those V shaped recoveries. They tend to sit flat with idle cash, then explode during market recoveries like after the 2008, 2020, or 2022/2023 bear markets.
This is another argument for the pullback entry criteria. You don’t have to use the 15% pullback threshold like I’ve been showing for the whole article up until this point. You don’t have to use the same parameters as me.
You can tune the system to be more or less selective based on what suits your portfolio’s needs best. I’ll always push you, the reader, to do your own analysis and determine the best use case for your specific scenario yourself. I just try to lay out a case for why I am doing something and what I looked at to get to that conclusion.
You can agree with everything I do, disagree with all of it, or reside somewhere in between. Either way, I still recommend you study a given system yourself, and please let me know if you find anything I missed, because then I can dive into it and share the updated findings with the community so we all benefit.
Nasdaq 100, S&P 100, and Russell 1000 Universe Overlap Study:
So I talked about how this system trades the Nasdaq 100, S&P 100, and Russell 1000 as three sub-universes within the one system. A question I had is how much do these universes overlap.
I made the case earlier in the article that the system uses a cross sectional ranking within the given universe to pick the highest momentum stocks. Thus, if we are looking at different universes independently, we are performing that cross sectional ranking on different sets of stocks, so different stocks rise to the top as the strongest relative to the others in that given universe.
But how big of a difference does it actually make to have the three universes rather than just one?
Other than the fact that trading only one universe leaves us more susceptible to luck in outcomes (what if that universe underperforms expectations relative to other universes) and bias (selection bias and survivorship bias), what is the measurable outcome of trading multiple universes?
That’s basically what I am attempting to answer below.
First, I wanted to know if the system still had decent edge when stocks in each universe were considered “uniquely”. Meaning if the Nasdaq 100 universe had Apple stock in it, and the Russell 1000 also had Apple stock in it, then Apple stock couldn’t get traded at all.
Not only does this prevent the system from being doubled or tripled up on the same stock and inflating the backtest due to concentration risk, but it also removes the strongest stocks from the backtest.
The stocks that have performed well enough to get into all three universes are not even in this backtest. The Apples, Nvidias, Microsofts, etc. are not in this backtest. This will be a true test of how the system picks winners when the biggest winners historically are not allowed to be traded.
Ideally, the “unique universe” as I call it still results in a half decent backtest. If the unique universe backtest looked terrible, that would indicate the system gets very concentrated in the same stocks across each universe and there really isn’t much benefit from a diversification standpoint in having all three universes.
If the unique universe backtest still looked half decent, that would be an indicator that the three universes still add benefit to the system with their respective unique stock baskets. And that the system can still pick up on quality trades when the best of the best stocks that sit in multiple indices are removed from the trade basket.
The “unique universe” backtest of the 15% pullback momentum system is shown below:
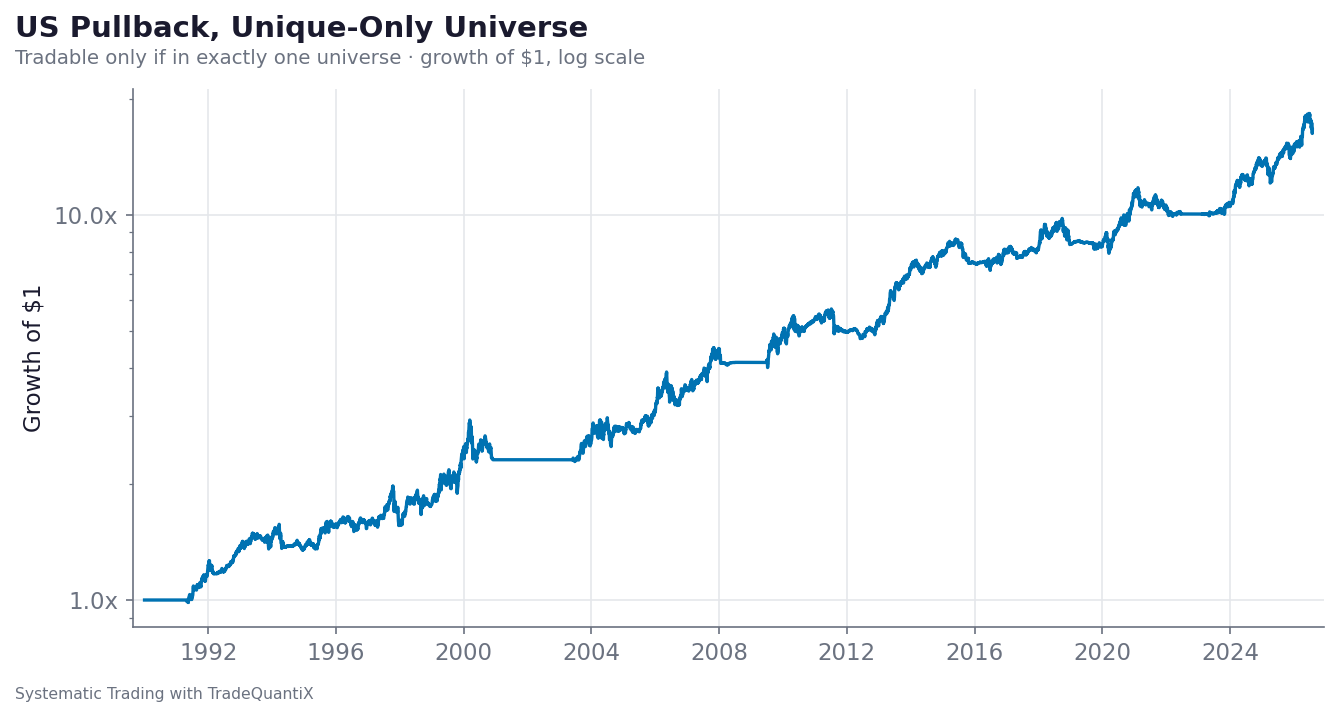
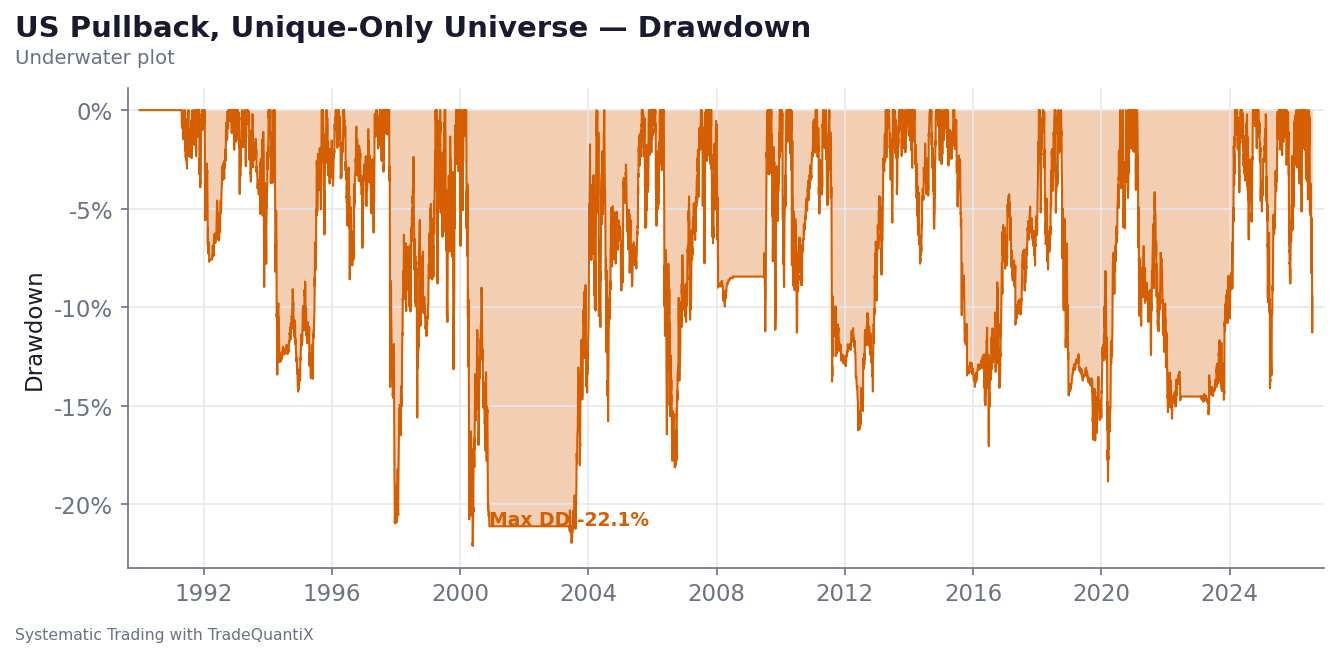
Thankfully, the system held up. It would have been annoying to find out this system’s only edge was derived from a few mega outperformers over history.
Below is the unique universe backtest compared to the same nominal pullback momentum system trading all three universes as it normally would.
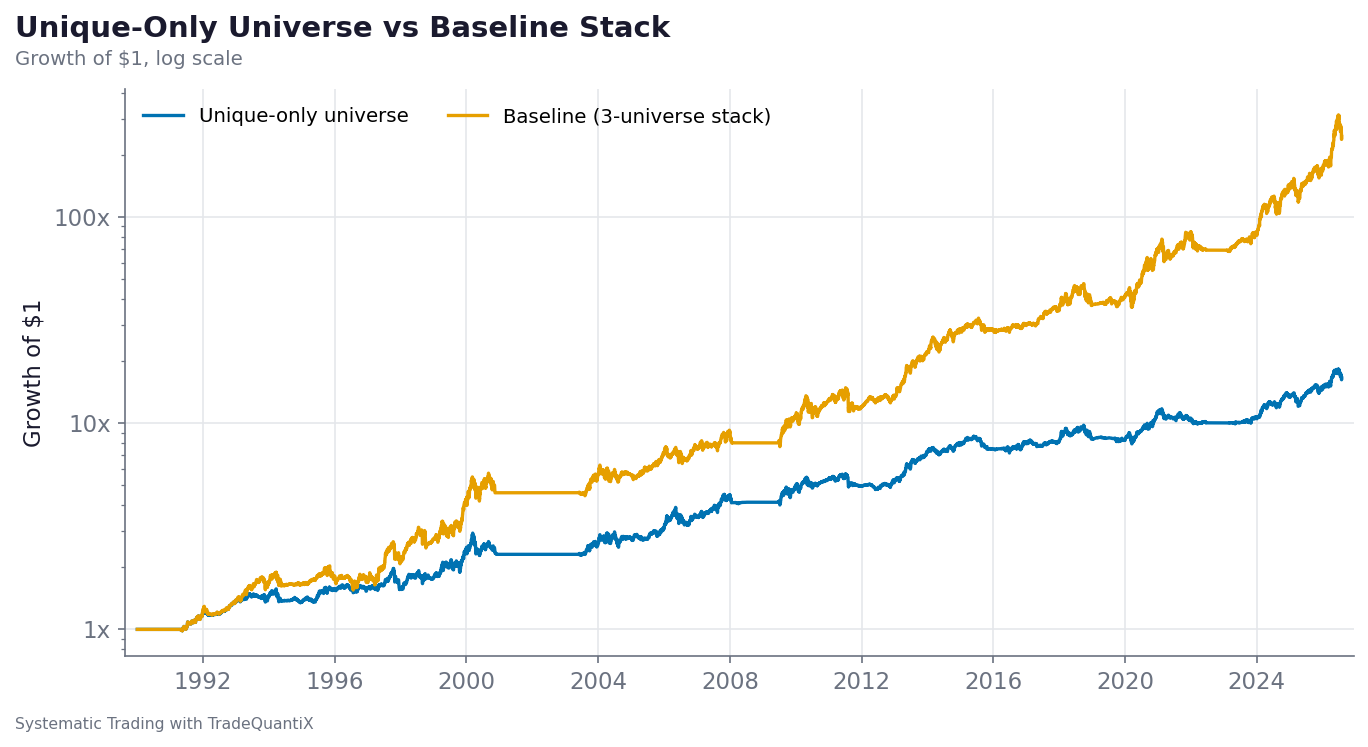
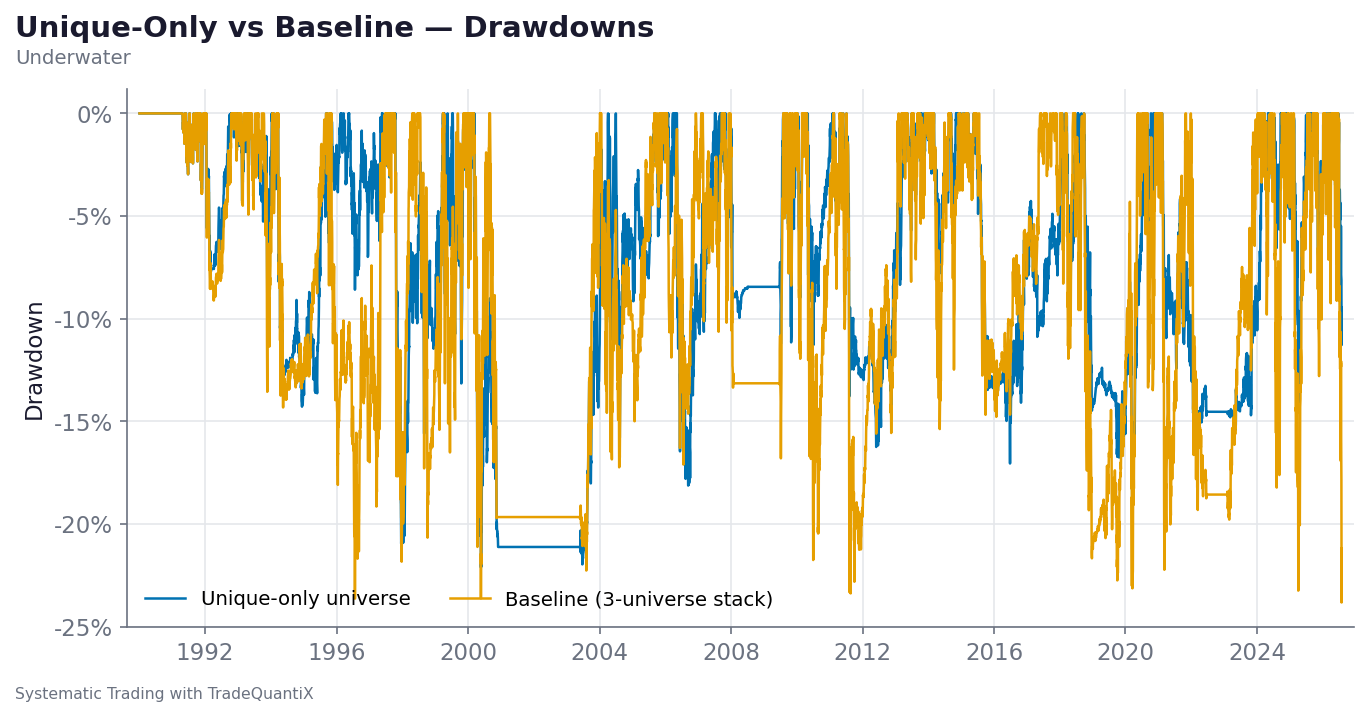
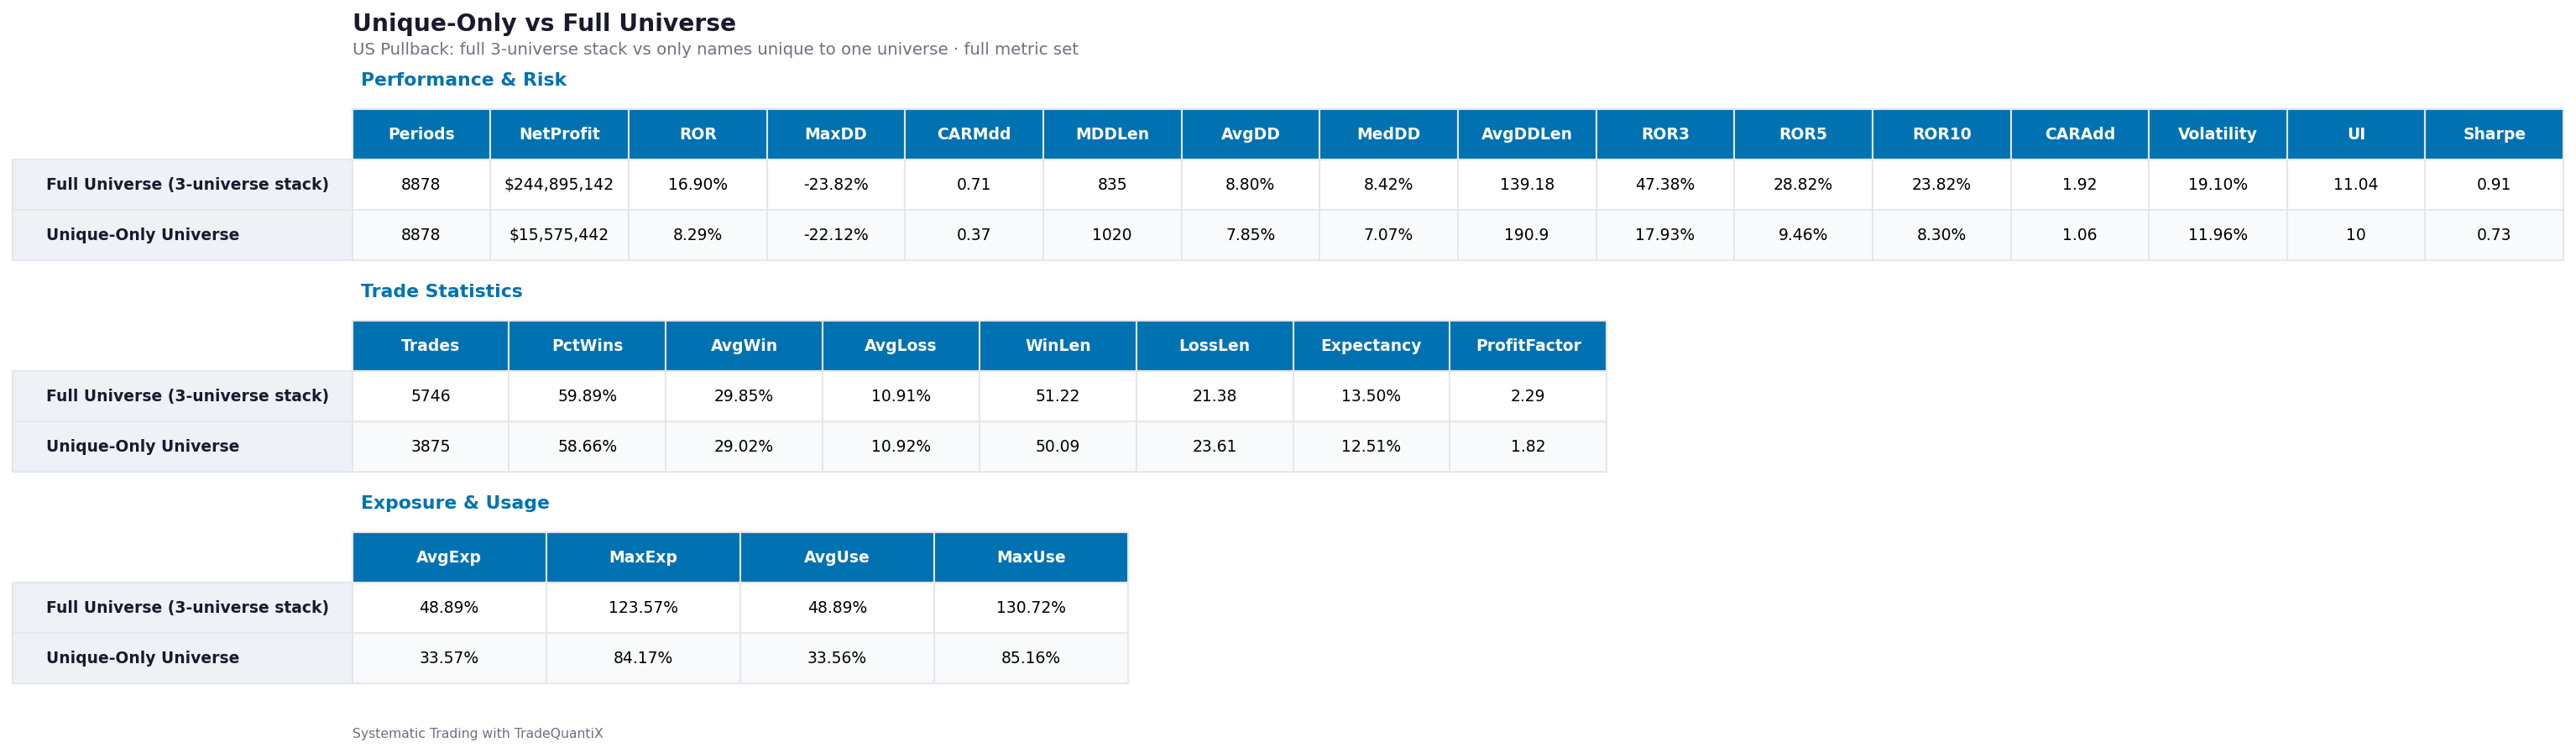
Obviously, when you allow the stocks that are in more than one universe back into the trading pool (i.e. the stocks that have probably performed the best), you end up with better results. But that doesn’t diminish the fact that the system held its own when the unique-only universe was tested.
The next thing I looked at was how much overlap there was in the stocks traded when comparing the pullback vs. no-pullback system variants. This study was done with the three full sub-universes restored, each trading independently with no restrictions.
The question to answer is:
“Does the pullback variant of the system produce a different trade list than the non pullback variant?”
I’ve been saying trading both variations will provide some trade level diversification, but is that actually true or did I just assume it? Well, to be fair, I did assume that was the case for at least a little bit, but I decided to put in the work to ensure I wasn’t full of it (and by “put in the work”, I mean ask Claude to do the comparison work with the Skill I’ll be sharing in the GitHub).
The plots below show a comparison of stock overlap between the no-pullback version of the system and the pullback version for different pullback depths (20%, 15%, and 10% pullbacks).
The blue line shows the number of unique stocks in the pullback system variant.
The yellow line shows the number of unique stocks in the no-pullback system variant.
The green line shows how many stocks held by the system show up in both system variants.
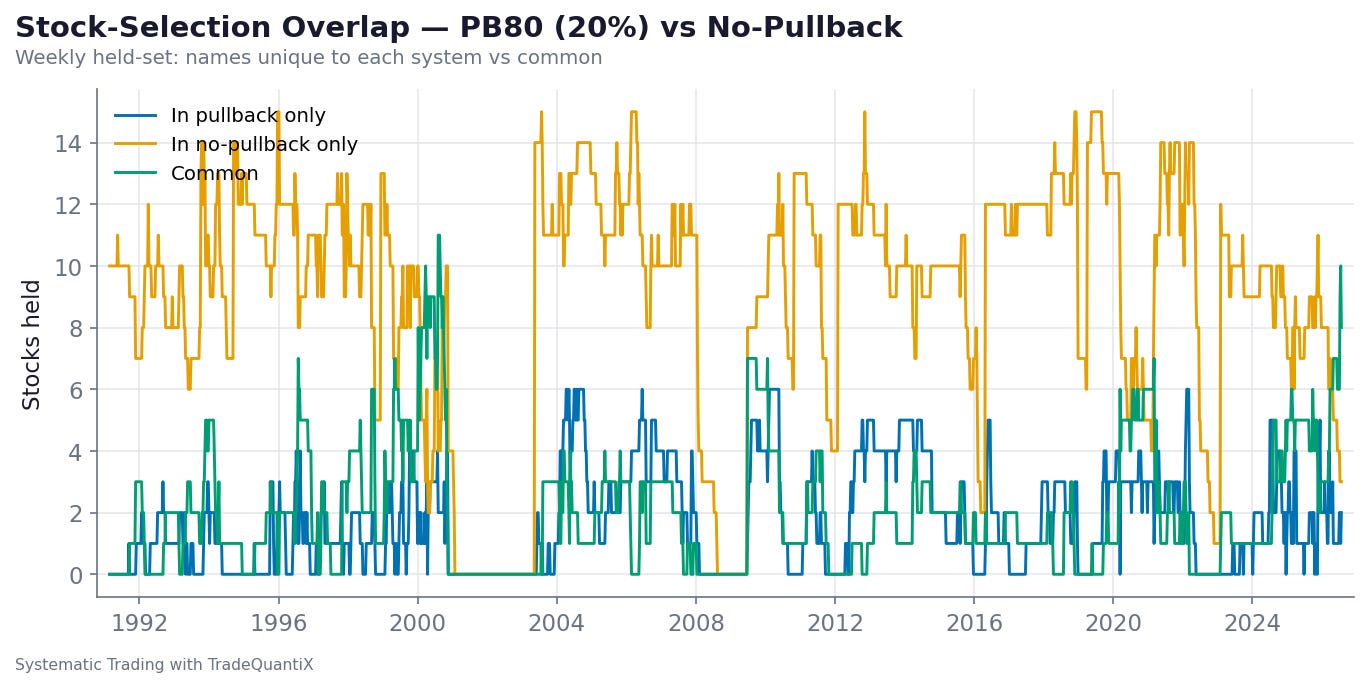
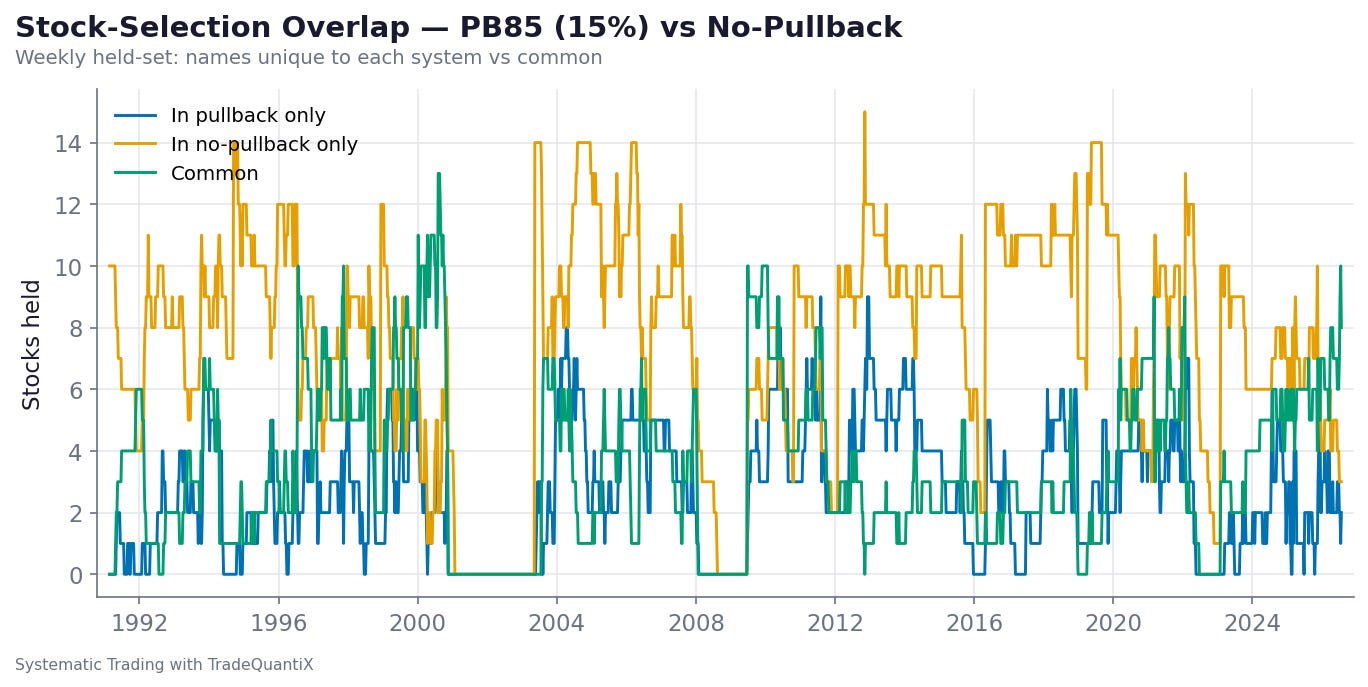
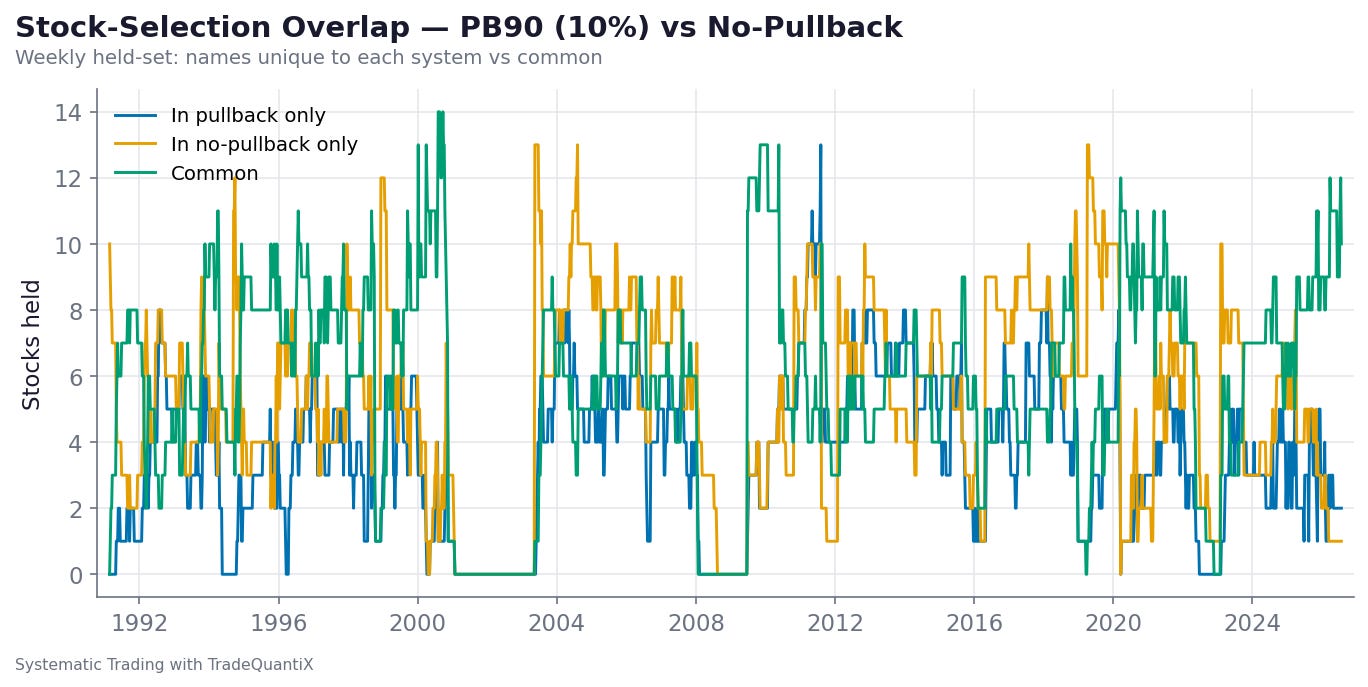
As the pullback gets deeper, the number of stocks unique to the pullback system relative to the no-pullback system gets higher. Meaning the number of stocks held in common decreases.
As the pullback gets shallower, the two system variants start to overlap more in common stocks held, but they still hold 5-10 unique stocks at any given time.
This proves that what I have claimed multiple times, that trading the two systems gives you stock selection diversification, is actually true.
By trading both systems you get a more diverse set of stocks held, thus diversifying your portfolio further. You never know when a sector shift will occur in the markets and the stocks currently at all-time highs revert while the ones currently in a reversion start to rip higher. Hence, being exposed to both sets of stocks (at highs vs. in a pullback) can be beneficial.
Starting To Build The Momentum Mini-Portfolio:
While this may be getting a little ahead of ourselves, because we have more momentum systems to develop still as part of this momentum mini-portfolio, we can start to play around with simple allocations just to see what happens.
Below is a bunch of different combinations of the US Pullback Momentum system, the US No-Pullback Momentum system, and the TSX Momentum system from part 1.
All equity curves are combined via a simple 50/50 allocation for two system combinations or a 33.3/33.3/33.3 allocation for three system combinations.
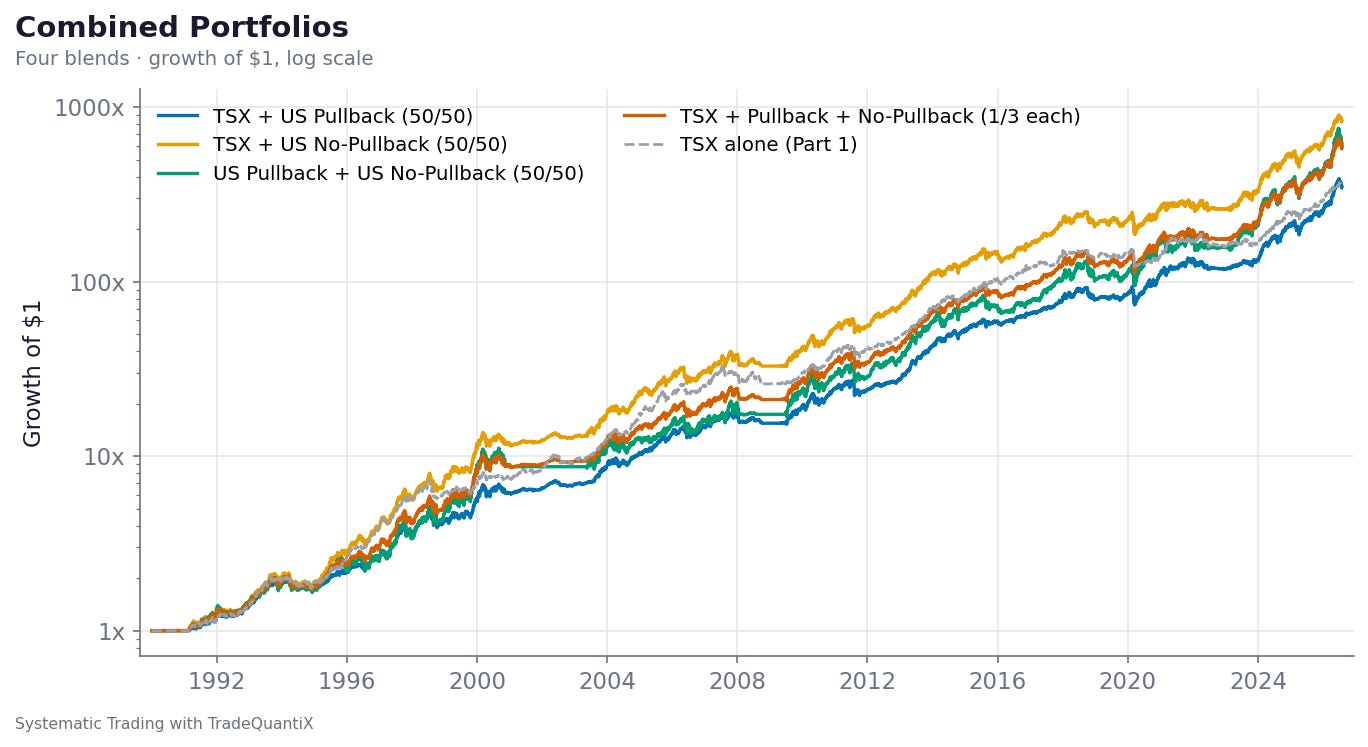
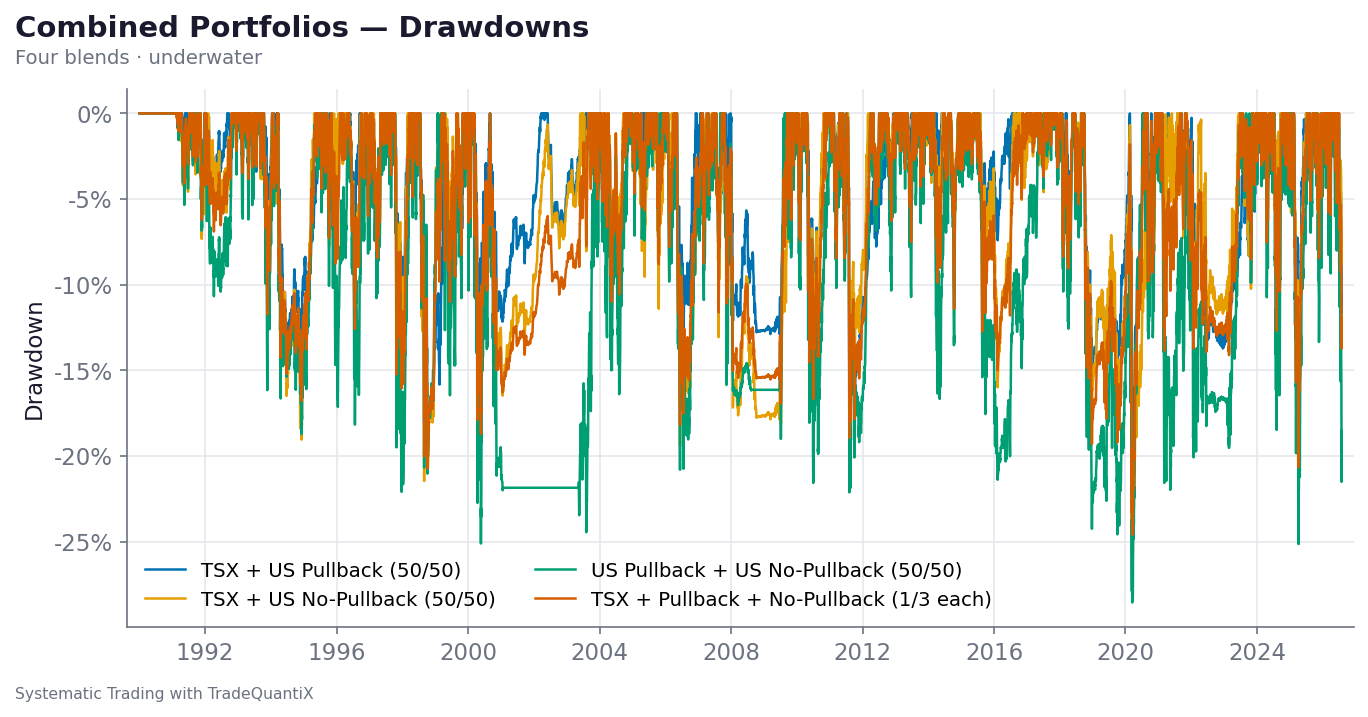
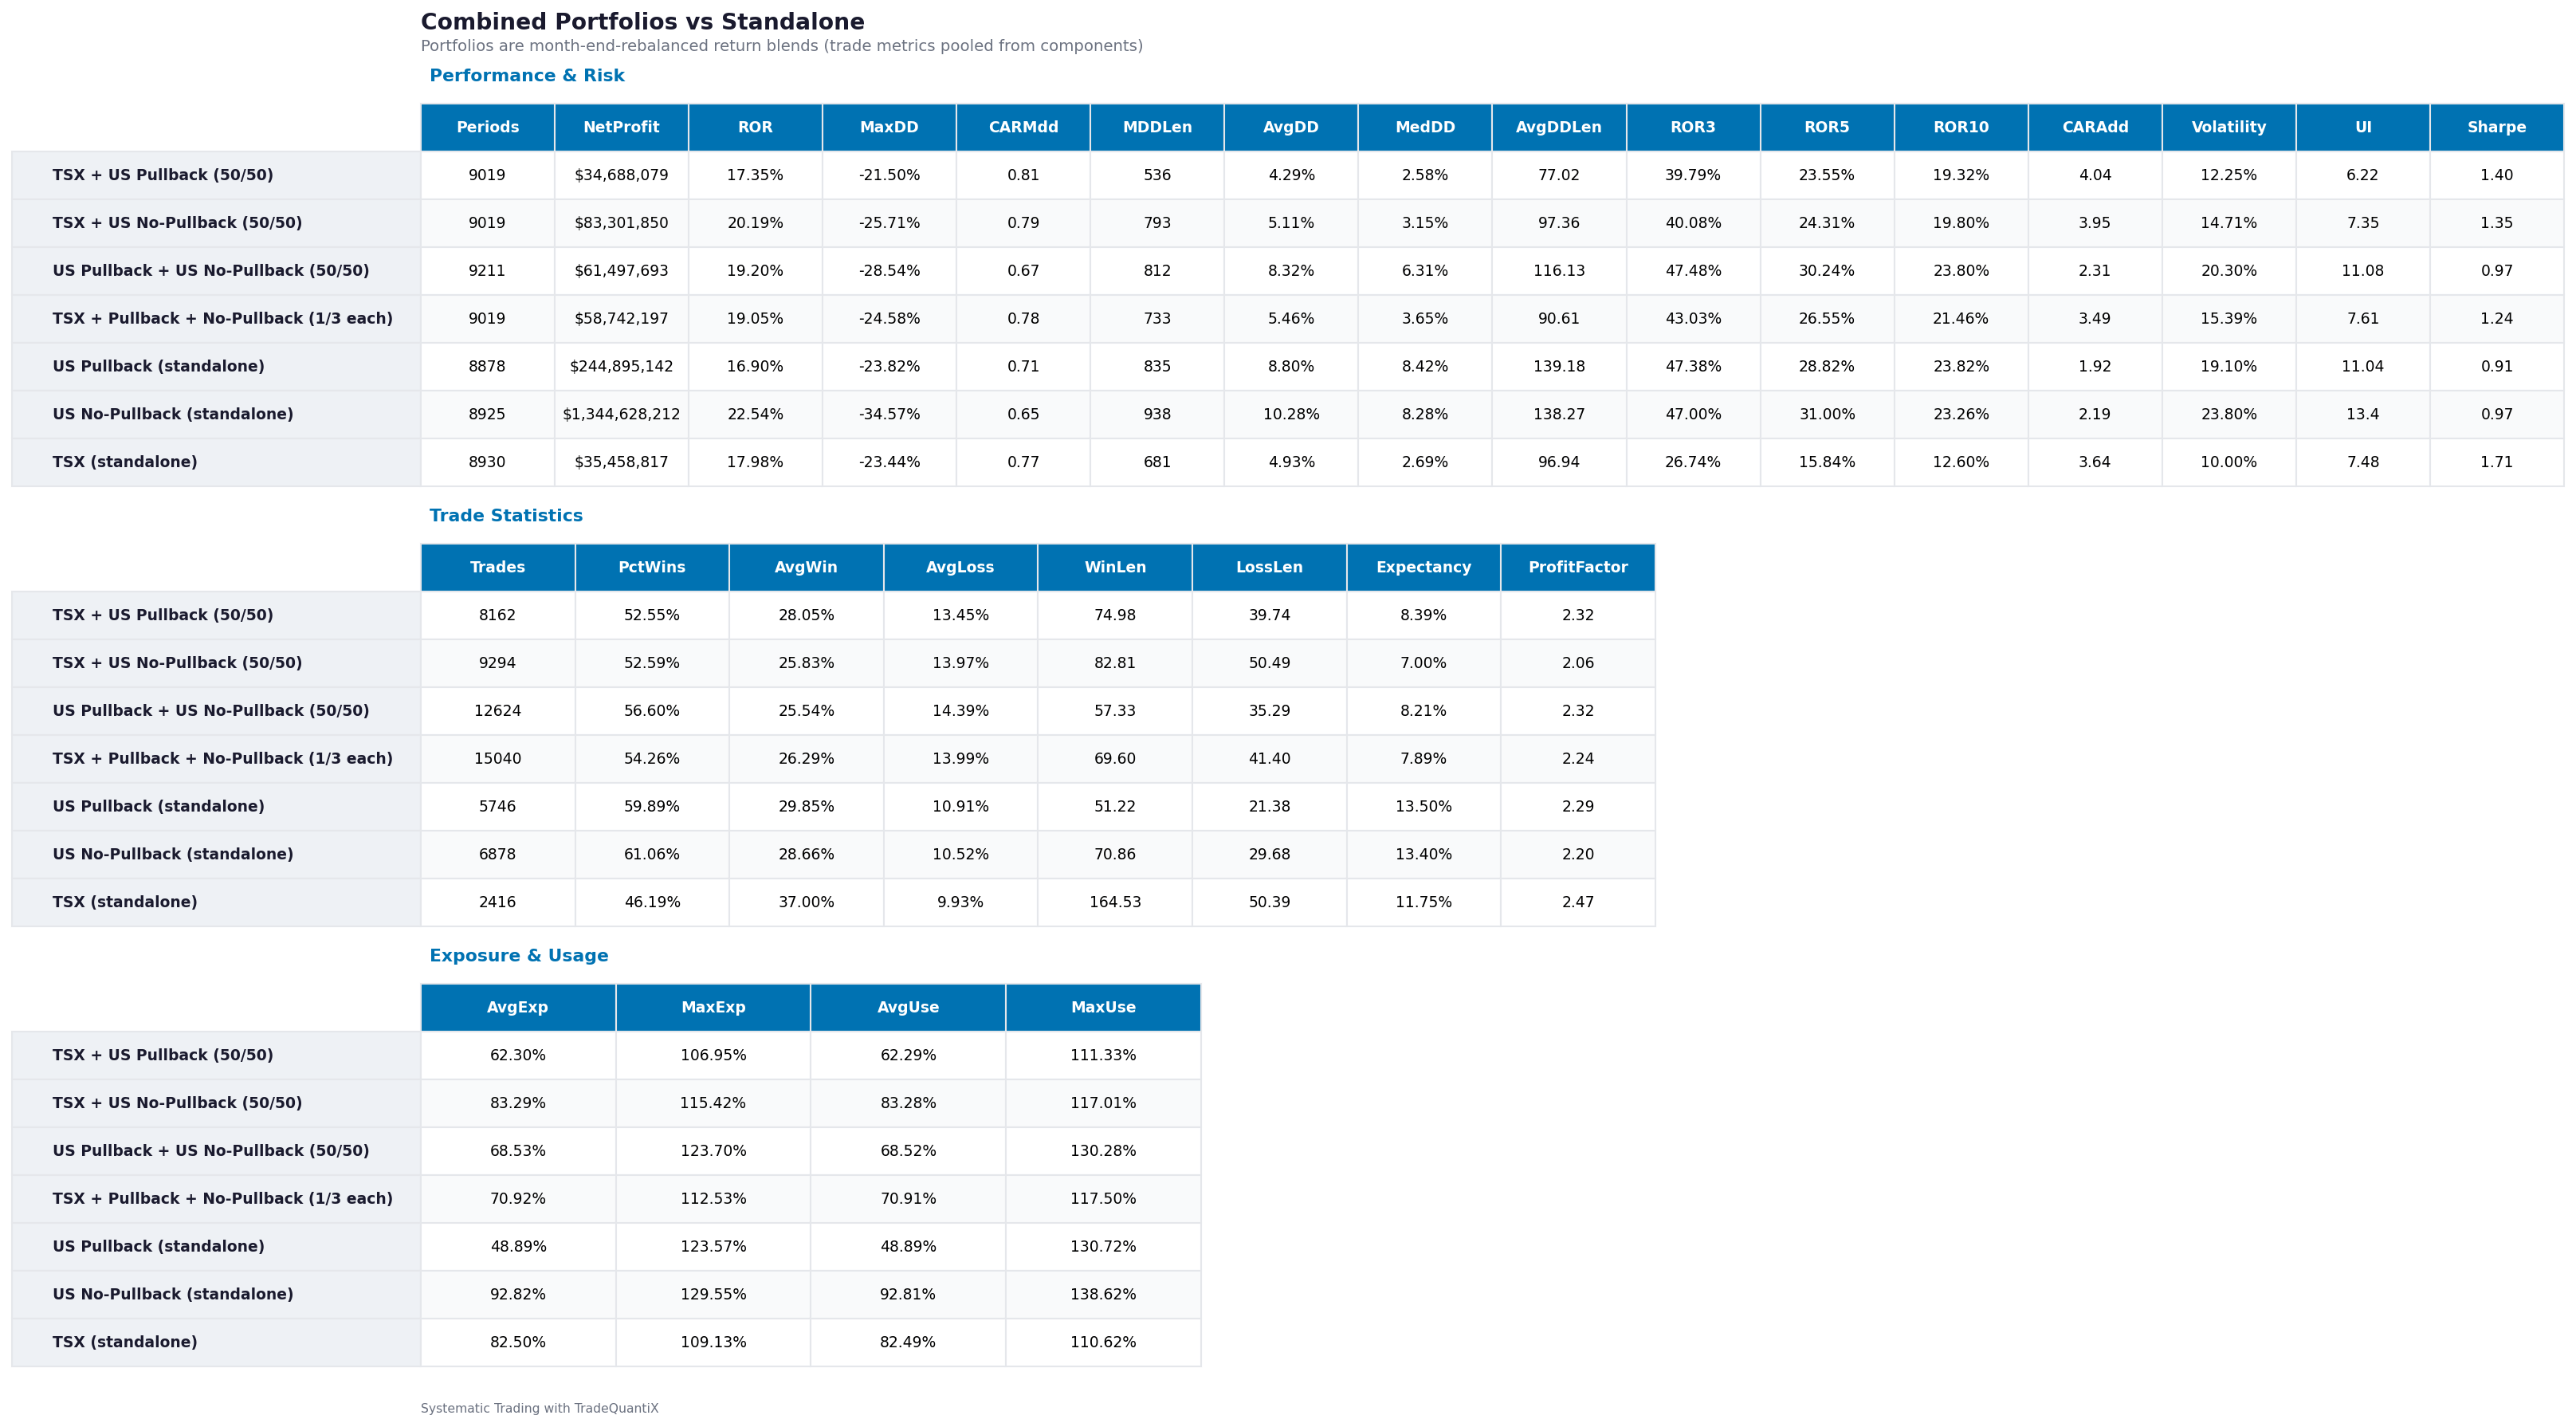
If we focus on the different sets of combined results, specifically the risk adjusted metrics like Sharpe and Calmar ratio, the TSX momentum system + the US Pullback momentum system are the best combination.
I would still probably trade all three system variants (TSX + US pullback + US no-pullback) for all the reasons laid out in the article. Also, the performance of the three systems combined is still more than acceptable, only slightly worse in terms of risk adjusted metrics.
I don’t plan to spend much time on portfolio combinations yet, just wanted to give a brief look of where we are thus far.
Conclusion:
This US pullback momentum system started as a back-and-forth idea in our Discord and ended up being a legitimate addition to the momentum mini-portfolio (and my own portfolio soon).
On its own, you could argue the no-pullback version has the better metrics, and you’d probably be right. But that’s single-system thinking, and we’re building a portfolio here.
The pullback entry gets the system into high momentum stocks at a different price, at a different point in the trend cycle, and in a partially different set of stocks than a standard buy-the-highs momentum system.
We showed the pullback entry gets positive expectancy quickly (even at just 5 to 10 day holds), the winning trades bought in the pullback revert back to the highs within a few weeks, and the trade quality holds up across a wide range of pullback thresholds. That’s not just added complexity for diversifications sake, instead it’s a real entry mechanism that has it’s own unique and robust market view.
The other big takeaway is the sub-universe implementation. Trading the Nasdaq 100, S&P 100, and Russell 1000 as three independent sub-universes casts a wider luck net, and the unique universe test showed the system still holds up even when the Apples and Nvidias of the world are removed entirely.
So the edge isn’t due to just a handful of mega cap outliers carrying the backtest. Also, the sub-universe trade overlap study showed the pullback and no-pullback variants genuinely hold different stocks over time.
So the momentum mini-portfolio now has three systems:
The TSX momentum system from part 1
The US pullback momentum system
And the no-pullback momentum system
In the next article we will continue by working on a momentum system for the ASX market, ideally looking at the phenomenon of momentum from another unique angle.
As always, don’t take my parameters, conclusions, or assumptions as correct. Study the system yourself, tune it to your own portfolio’s needs, and if you find something I missed, let me know so we can all benefit.
Disclaimer
The information and services provided by the Systematic Trading with TradeQuantiX newsletter are for educational and informational purposes only and do not constitute financial advice, investment recommendations, or guarantees of trading performance. Any information provided is general in nature and does not take into account your individual circumstances. Trading involves significant risks, including the potential for substantial financial losses, and past performance is not indicative of future results. The information is provided ‘as is’ without warranty of accuracy or completeness. All decisions and actions based on the information provided are the sole responsibility of the reader. You should seek independent professional advice before trading. The Systematic Trading with TradeQuantiX newsletter is not liable for any losses, damages, or outcomes resulting from the use of this information or our services.
RealTest Code:
The final system code is below. If you want all the code used to generate the plots and to perform all the sensitivities above, that is provided in the GitHub.
I also uploaded to the GitHub a Skill for using RealTest with Claude to control the software and create summary output plots and tables based on what you tell it you want to see.
This Claude Skill is NOT meant to be used for prompts like:
“Make me a system with 30% returns a year”
Rather it’s meant more for things like:
“I want to study the effect of xyz rule on the system, run a parameter sweep for this rule to understand the parameter selection sensitivity. Then see how significant the rule is by comparing the system results with and without the rule. Also add some noise to the rule to see if it still outperforms not having the rule at all”.
It’s like having an assistant to speed up the grunt work, not to outsource your systematic thinking abilities.