

Trading System Investigation Series 2 - Part 1
A deep dive into a short side day-trade system found online. Is it worth trading?


Welcome to the “Systematic Trading with TradeQuantiX” newsletter, your go-to resource for all things systematic trading. This publication aims to equip you with a complete toolkit to support your systematic trading journey, sent straight to your inbox. Remember, it’s more than just another newsletter; it’s everything you need to be a successful systematic trader.
Introduction:
Welcome to the Trading System Investigation Series 2, Part 1. In this series, we will investigate an interesting trading system found online. We will examine this system by first attempting to replicate the baseline results as published and understanding the system rules. From there, we will determine if the system is potentially tradable or if it deserves to be thrown in the dumpster.
We will have to figure out if the system is merely an artifact of data mining, has faulty biases built into it, is missing important components (like slippage and commissions), or contains various other issues. Once we understand the premise of the system, validate the results ourselves, and believe the system has promise, we will attempt to improve it by taking it through an in-sample and out-of-sample validation process.
The system we will be investigating in this series is a short-side mean reversion day trading system. This system seeks to profit when a stock is overextended to the upside, aiming to capitalize on the pullback. It holds the position for no longer than one day, selling market-on-close on the same day as entry. We will start by laying out the system rules and understanding its objective.
Baseline System Rules and Objective:
The first step in investigating any system found online or in a book is to understand and attempt to reproduce the system’s results yourself. Many times, you’ll find you can’t reproduce the results, though. It’s very common for trading systems publicly available to have one of the following issues:
Heavy curve fitting
Lookahead bias
Survivorship bias
Failure to account for slippage or commissions
And many other problems
Due to these issues, you’ll often find that when you code up a trading strategy found online, the system doesn’t work at all. Hopefully, that is not the case with this short mean reversion day trading system. The rules of this system as published online are as follows:
Entry Rules:
Stock is within the Russell 1000
Stock has an average volume of 1,000,000 shares or higher over the last 50 days
The stock is $10 or higher
The 39 day percent normalized ATR is within 1% to 8%
The 2 day percent normalized ATR is within 1% to 20%
The 5 day ADX is higher than 35
The day before entry had an up move (measured from open to close) of more than 5%
Place a limit order 5% above yesterday’s close
Position Size Rules:
The system holds a maximum of 10 positions
The system holds equal weight positions (10% each)
If there are more than 10 setups, rank by 10 day percent normalized ATR
Exit Rules:
Cover the position market-on-close on the same day as the entry (no holding positions overnight)
The first thing I notice looking at this list of rules is that there may be excessive complexity within the system. In my opinion, there seem to be a lot of rules. I have a feeling we might be able to get away with fewer rules when we dig in and tear apart the system. Also, a 39 day ATR? That seems oddly specific. I tend to get a little suspicious when very specific parameters like that are used. Why not just round to an even 40? We will get to the bottom of that eventually.
Before we get too bogged down by the number of rules and specificity of some parameters, let’s continue with understanding the system. The premise is as follows: define a trading universe of stocks priced $10 or higher that have had an average volume of over 1,000,000 shares traded per day and within the Russell 1000 index. That’s a relatively liquid basket of stocks, and higher-priced stocks generally means slippage is less of an issue on a percentage basis—so far, so good.
Now, using that stock universe, filter based on stocks whose short-term volatility resides in a range from 1% to 20% and whose long-term volatility resides in the range of 1% to 8%. Also, ensure there is a trend in the stock measured via the ADX filter being greater than 35. Finally, if the stock has a green candle of 5% or greater today, place a limit order 5% higher than today’s close to potentially be executed tomorrow. If that limit order is executed the next day, the system will sell the position market-on-close, ensuring nothing is held overnight.
The general premise behind the system is nothing new or novel, but an idea doesn’t necessarily have to be unique to be profitable. I think a day trading short-side system is interesting because shorting is inherently risky; the less time I have to hold a short trade, the better. The longer I hold a short position, the more time it has to go against me and result in a massive loss (remember, you can lose more than 100% of the trade value when shorting). So I like the fact that this system holds a position for no longer than one trading day.
For deeper learning opportunities in systematic trading, consider signing up for the Systematic Trader School.
📈 This will consist of 10, 1-on-1 consulting sessions with me! By the end of the 10 consulting sessions, you’ll have a robust portfolio of 3–5 designed, developed, and implemented systematic trading strategies.
🥇 These aren’t theoretical trading strategies—you’ll develop real, tradable strategies for use with your trading account.
🚀 I’ll guide you step-by-step, from planning your portfolio and developing your own trading strategies, to conducting robustness testing and implementing the portfolio live.
📚 To learn more, check out the Systematic Trader School page. Also, you can book a free 30 minute consultation. During the call, I’ll explain exactly how it works and the transformation you can expect:
👉[Click here to learn more about the Systematic Trader School!]👈
👉[Click here to book a free 30 minute consultation!]👈
Replicating The Baseline System Results:
After understanding the system and its rules, I opened my backtesting software and began coding the rules in an attempt to match the baseline system performance. While this may seem like a daunting task, if you do it enough, it’s actually relatively straightforward. Like any task, the more you do it, the easier it becomes.
I’ve coded systems found online or in books enough times that the process is generally pretty quick—it only took about 20 minutes. In my early days, this process might have taken a few hours, but with time and practice, you can become much more efficient at coding trading systems.
Sometimes you have to fiddle with backtest assumptions and rules to get your results to match what’s published online, but in this case, it was relatively straightforward, and I was able to more or less match the results without much fuss.
For benchmarking purposes, here are the baseline results as presented with the trading system online, which I attempted to match:
Baseline Online System Results (Orange Line):


Now, here are the results of my attempt to replicate the baseline system with the backtesting software I use, RealTest:
TradeQuantiX Results:
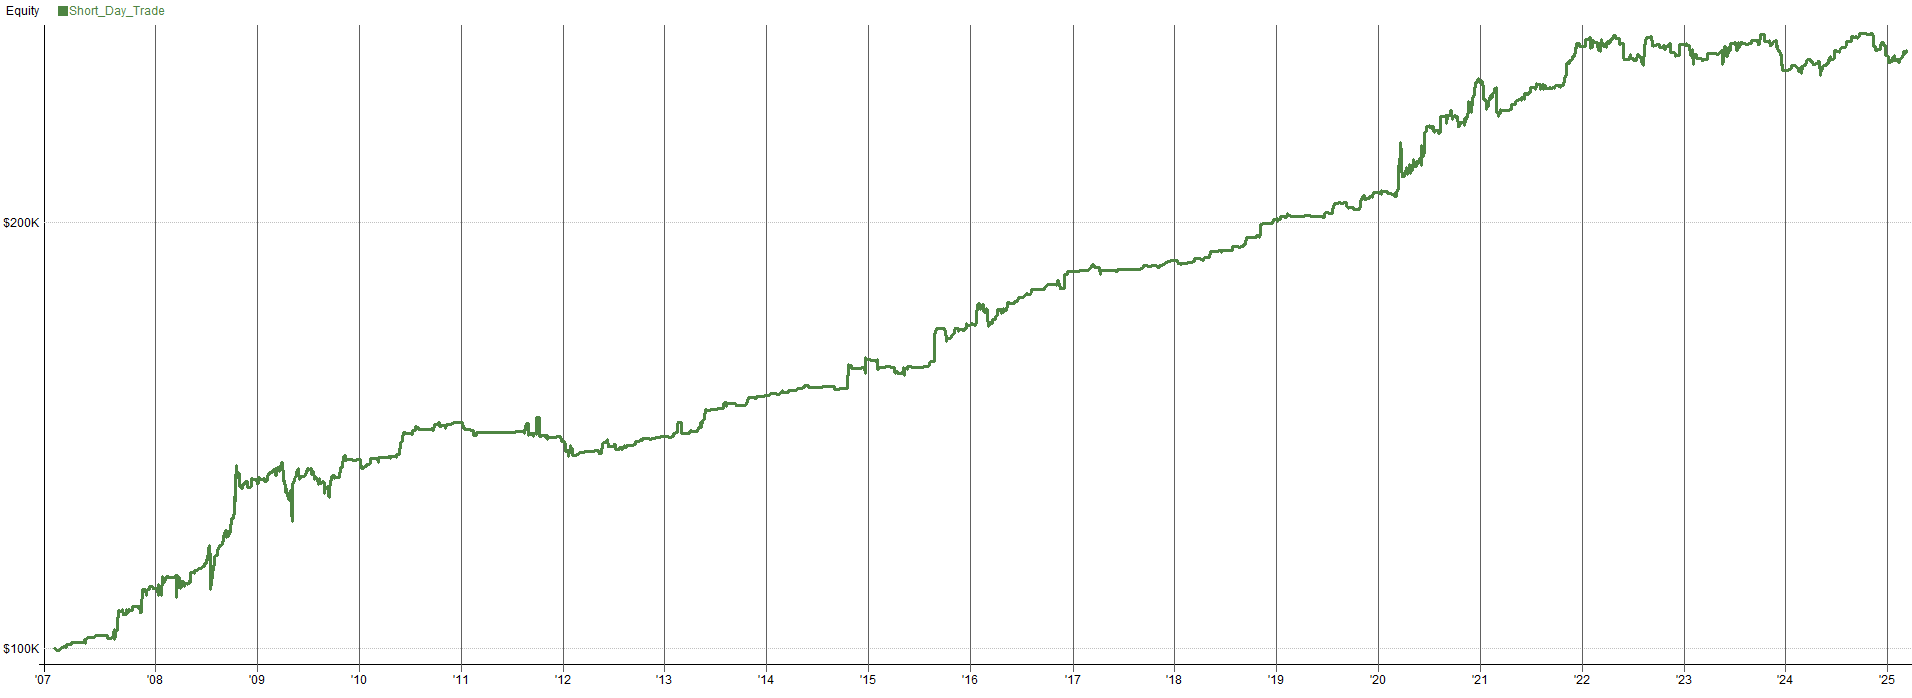

I was pleasantly surprised that my results actually matched the baseline system relatively closely. I was fully expecting this system not to work. In my experience testing short-side systems found online, they tend not to be profitable. Many times, people backtest these systems with some sort of error or bias in the code, as discussed above. This system shows to be profitable, especially during bear markets, which is always a positive—especially for those with a lot of long only systems in their portfolios (like me!).
Assuming the system holds up to the scrutiny I’ll eventually put it through, I think it could potentially be a fantastic addition to my own portfolio. I’m always looking for ways to profit in bear markets or other market corrections. Since my portfolio is heavily weighted to the long side, I tend to get pretty excited if I find new ways to hedge downside risk.
Hypothetically, even if this system were not profitable in bull markets and was only profitable in bear markets, I’d be happy with that performance because everyone wants downside protection. The interesting thing is this system appears to make money in both bull and bear markets, which piques my interest. I’d want to dig in to understand more about why the performance works in both market types
System Pros and Cons:
Let’s start with a positive outlook and discuss some pros. One pro, for me at least, is that this system is on the short side, which is likely uncorrelated to most other systems within my portfolio. Another pro is the system only holds each position for one day, so the risk of a position going hundreds of percent against you is much lower. A stock can only move so much in one day (famous last words, right?). The last pro is that the system trades relatively high-volume and high-priced stocks, which makes it more likely to get the shares to borrow to place the short. It also potentially makes the short fees cheaper, on average, if the stock is higher-priced and has higher trading volume.
With every set of pros, there are some cons. One con associated with the system is that it has relatively low expectancy per trade, so if short-sale fees, commissions, or slippage are higher than modeled, the system could lose its edge. We want to ensure we have what we think are valid short-sale fees, commissions, and slippage are modeled into the system. The good thing is this is a day trade system and I believe most brokers only charge short sale fees for anything held longer than one day, so we may be okay there. Another potential con is that the system is fairly active and places a lot of orders into the market everyday, so if you don’t have automated order management software, it may be very time-consuming to manually place all the orders this system generates.
Another observation is that the past couple of years of this system’s performance has been pretty flat. This flat performance may be fine—it may just be due to a market shift or temporary underperformance—but it will be worth exploring whether the system is losing its edge or not. The last con, which is my biggest concern, is that the system appears to have a lot of rules and parameters. I’m not a fan of needless complexity. Yes, complexity has its place, but being complex and having a lot of rules and parameters just for the sake of it is not a good idea. So, we’ll need to figure out which rules/parameters are actually meaningful and remove those that aren’t to reduce the complexity of the system.
Trade Examples:
Now, let's look at some example trades so you can see how this system might behave day-to-day.
Average Winning Trade:

Large Winning Trade:

Breakeven Trade:

Average Losing Trade:

Large Losing Trade:

Here’s a short on GME during the meme stock craze. Imagine holdings this trade overnight! Just one day away from a massive gap against you. This is why shorter holding periods with short side trading systems can be very beneficial.

Conclusions:
Overall, this system provides a solid starting point, and there’s definitely a possibility of creating something interesting out of it, assuming it passes all checks and scrutiny. That said, there’s also a possibility that this system ends up in the trash bin due to a variety of reasons, but we won’t know until we dig into it and find any potential issues. That’s the fun of trading system development. We can do hours of work just to find out it was a waste of time—that’s just part of the game.
In the following article, I’ll tear the system apart and then put it back together, attempting to uncover any hidden issues, further refine, and improve the system through an in-sample and out-of-sample approach. Stay tuned for Part 2 of this article series to follow along.
See you there! Happy trading!
Do you have ideas/suggestions for future articles? Let me know what you want to read about by clicking the button below and submitting your suggestions. Your suggestions are greatly appreciated as they help tailor this newsletter to what you want to read about.
Disclaimer
The information and services provided by the Systematic Trading with TradeQuantiX newsletter are for educational and informational purposes only and do not constitute financial advice, investment recommendations, or guarantees of trading performance. Any information provided is general in nature and does not take into account your individual circumstances. Trading involves significant risks, including the potential for substantial financial losses, and past performance is not indicative of future results. The information is provided ‘as is’ without warranty of accuracy or completeness. All decisions and actions based on the information provided are the sole responsibility of the reader. You should seek independent professional advice before trading. The Systematic Trading with TradeQuantiX newsletter is not liable for any losses, damages, or outcomes resulting from the use of this information or our services.
Real Test Code:
Import:
	DataSource:	Norgate
	IncludeList:	.Russell 1000 Current & Past
	//IncludeList:	.S&P 500 Current & Past
	//IncludeList:	.Nasdaq 100 Current & Past
	IncludeList:
	StartDate:	1/1/1990
	EndDate:	Latest

	SaveAs:	ShortDayTrade.rtd


Settings:
	BarSize:	Daily
	AccountSize:	100000
	DataFile:	ShortDayTrade.rtd

	StartDate:	1/1/2000
	EndDate:	Latest


Parameters:
	MaxPos:	10
	MinVolume:	1000000
	MinVolumeLookback:	50
	MinPrice:	10

	MinVolatility:	0.01
	LongTermMaxVol:	0.08
	LongTermLookback:	39

	ShortTermMaxVol:	0.20
	ShortTermATR:	2

	ShortTermLookback:	5
	ADXValue:	35

	OverBoughtThresh:	5

	LimitDistancePct:	5
	FactorLookback:	10


Data:
	Rule1:	InRUI
	Rule2:	MA(V, MinVolumeLookback) > MinVolume
	Rule3:	C > MinPrice
	Rule4:	ATR(LongTermLookback) / C > MinVolatility AND ATR(LongTermLookback) / C < LongTermMaxVol
	Rule5:	ATR(ShortTermATR) / C > MinVolatility AND ATR(ShortTermATR) / C < ShortTermMaxVol
	Rule6:	ADX(ShortTermLookback) > ADXValue
	Rule7:	((C - O) / O) * 100 > OverBoughtThresh

	Entry:	1
		AND Rule1
		AND Rule2
		AND Rule3
		AND Rule4    //Significant
		AND Rule5    //Not significant
		AND Rule6   //A little significant
		AND Rule7    ///Make or break


	Factor:	ATR(FactorLookback) / C

Library:

	Exit:	1

	LimitPrice:	C * (1 + LimitDistancePct / 100) //H + ATR(ShortTermLookback)

Strategy: Short_Day_Trade
	Allocation:	S.Equity
	Side:	Short
	MaxPositions:	MaxPos

	Commission:	Min(0.01 * FillValue, Max(0.005 * Shares, 1))
	Slippage:	0
	LimitExtra:	0.01

	Quantity:	100 / MaxPos
	QtyType:	Percent

	SetupScore:	Factor
	EntrySetup:	Entry

	EntryLimit:	LimitPrice
	EntryTime:	Intraday

	ExitRule:	Exit
	ExitTime:	NextClose