

Trading System Investigation: Series 1 - Part 1
A deep dive into a short term trading system found online. Is it worth trading?

Hey, TradetroniX here, welcome to the first article of a four part mini series where we will do some trading system investigation. If you enjoy the content, please feel free to subscribe. Also, if you feel inclined, constructive criticism is always welcome, so let me know if you have any. Finally, the liability notice: everything discussed is for educational purposes only and not meant to be used as investment advice. With that out of the way I hope you enjoy, now let’s jump into it!
Introduction
One thing that systematic traders stumble across often are online articles or videos sharing trading strategies for free. This is great for the idea generation process, but how do we know if we can actually trade these free strategies? Well, we need to code them up and test them ourselves! Never blindly trust a strategy (free or paid), we must always put in the work to prove these strategies are real, robust, and worthy of our hard earned capital. Most strategies published online are garbage in my experience, but sometimes there is some good stuff out there. The only way to find out is to investigate the trading system ourselves, which is what this mini series is going to do.
Today, I am going to go over a strategy shared for free publicly in a webinar by Laurens Bensdorp and Alexei Rudometkin. I will perform the following:
Introduce the rules of the system they shared
Code the system into my backtesting platform (I use Real Test)
Show some trade examples
Discuss strengths/weaknesses of this strategy
Share the code of the system I coded attempting to reproduce the results shown in the free webinar
Then, in article parts 2, 3, and 4, I will continue the investigation of this system with the following items:
Try to improve the strategy with an In Sample and Out of Sample approach
Test the improvements on out of sample data
Discuss robustness of the strategy
Talk about how to modify the trading system to make it fit your needs
And of course, share the final system code
You may be thinking to yourself “huh? this article isn’t starting from an original idea? He’s leveraging something from someone else?”. Yes, that’s correct. Many if the trading systems I trade live are derived from some idea someone else shared. I take those shared ideas, try to emulate them to ensure I understand them, then try to modify the idea to make it unique to me and fit my objectives. Not every idea has to be 100% original. What’s important is you validate the idea is sound, do your own due diligence, and make the idea work for you. This article series is going to go through exactly how to do that.
Before I go any further, let me just say I have the upmost respect for Laurens Bensdorp and Alexei Rudometkin. They are real traders who provide a mentoring service to help beginners become better traders. Any comments I make in this article series are not in any way meant to be disrespectful to either Laurens or Alexei. With that said, lets begin!
The Baseline System Rules and Initial Thoughts
First, let’s introduce the baseline system which was discussed in the webinar. The idea behind the system is a short term mean reversion approach on the long side. The system buys well performing stocks when they are slightly oversold in the short term, holds the trades for a few days, then exits at a small profit or a small loss, depending on how the trade behaves.
The entry rules are as follows:
Stock is in the S&P 500 universe
Stock is greater than $1
Stock dollar volume is in the top 50% of current S&P 500 stocks
Stock percent volatility (defined by 10 day ATR/C) is between 1% and 40%
Stock has returned at least 10% in the last 100 trading days
3 day RSI is below 20
Stock has had two down days in a row
7 day ADX is greater than 30
Hold up to 10 equally sized positions at a time
If there are more than 10 candidates available for trading, rank by the one year highest rate of change (place orders for the stocks that have gone up the most in one year)
Enter the next day with a limit order 1% below the close of the previous day
The exit rules are as follows:
Intraday initial stop of 2 ATR’s (10 day ATR)
Intraday 2.5 ATR trailing stop (10 day ATR)
Intraday 4% profit target
My initial thought is this system has a lot of rules. A handful of the rules are used to define the universe the system will trade, which is important. For a short term system like this one, I would expect the expectancy to be on the lower end, so you want to ensure the universe being traded has sufficient liquidity to mitigate slippage. Still, there are many other entry rules and three exit rules. From personal experience, the more rules a system has the easier it is to curve fit. That being said, I am still interested to see if we can match the performance of the published system, so before having too many judgements, let’s code it and see what happens. We may be able to simplify and even improve the system performance later.
The Baseline System Performance
It is worth noting, while the free webinar gave a list of trading rules, it did not provide any code. So, there were many assumptions I had to make when coding this system up. I interpreted and coded the system based on the information provided to the best of my ability. It only took about 20 minutes to code the system in by backtesting software called Real Test (code is provided at the end of the article). The back-to-back results of the trading system shown in the free webinar compared to the system I coded up on both the S&P 500 and NASDAQ 100 are shown below:
Note: For this comparison I left out the effect of slippage and commissions. The pessimist in me just assumed any trading system shown online ignores those friction effects. Later I will implement slippage and commissions (don’t worry the system does not fall apart).
The provided results from the free webinar on the SP500:


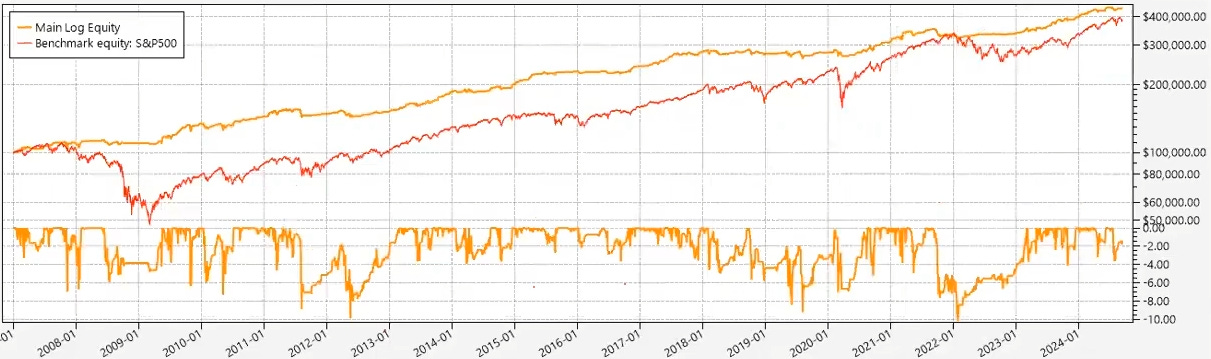
The results of the system on the S&P 500 when I attempt to code it:


In general, the equity curves look very similar. There’s a couple differences in the equity curve “bumps and lumps” but high level the system is within the range of error I would expect when comparing backtest results between two different backtesting softwares. The original system has a compound annual return (CAR) of 10.43%, the system I coded has a CAR of 9.26%. The drawdowns are somewhat different, the original system had a max drawdown of 17.03% (which occurred in 2012) and my version of the system had a max drawdown of 21.13% (which occurred in 2009). So, there are some differences when it comes to drawdown as you can see a large downward spike in my equity curve in 2009 where the original system does not have this downward spike.
The provided results from the free webinar on the NASDAQ 100:

The results of the system on the NASDAQ100 when I attempt to code it:


The NASDAQ 100 results used the same code as what was used for the S&P 500 example, the only difference is the trading universe. In general, the equity curves look similar in shape, but there’s a couple differences I see. First, the returns in my version of the system are a little lower, but so is the drawdown. The percent of winners in my version is also slightly lower as well. With that said, again the system is within the range of error I would expect when comparing backtest results between two different backtesting softwares. Also note, I could have misinterpreted a couple rules, which would cause some differences in results. In fact, there’s a pretty good chance a rule I used was slightly different than what was used in the original system. Having differences like this is pretty common when trying to emulate trading systems found online.
Honestly, the system I coded up vs. the original system are very close in the grand scheme of things. I have tried to code up other systems in the past I found online just to realize the developer left out key rules and the system performance was not reproducible. I have also had situations where the system online had major errors or biases in the backtest and in reality the system isn’t even profitable. So I am happy to move forward with how close the original system vs. my version of the system performs.
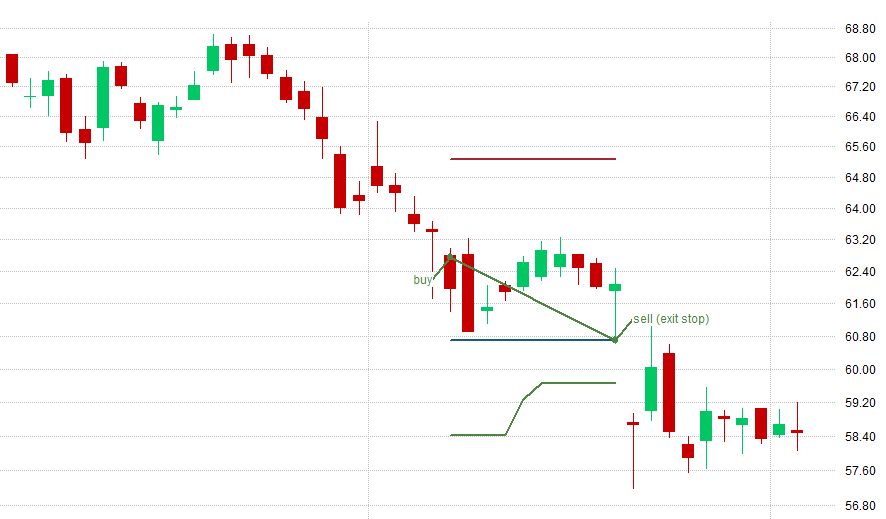
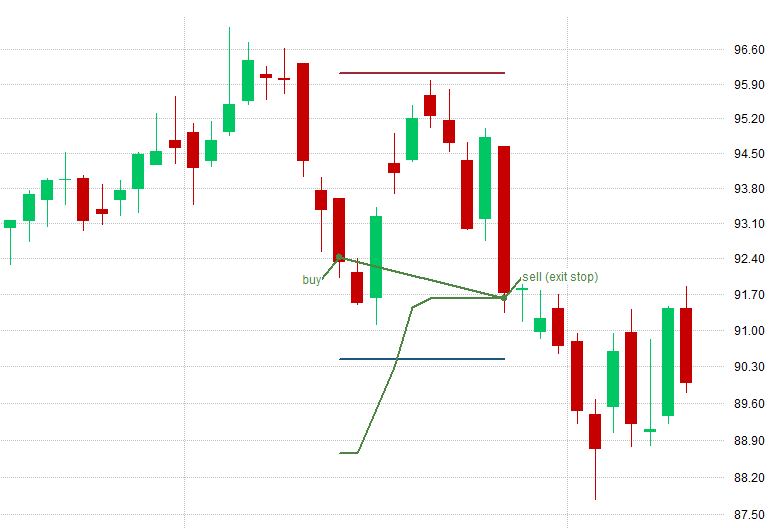
Below you can see a couple trade examples to help visualize how this system works. The blue line is the initial stop loss, the green line is the trailing stop loss, and the red line is the profit target
Profit Target Exit:

Initial Stop Loss Exit:
Trailing Stop Loss Exit:
Okay so we have the code working, we understand what a typical trade looks like, now what are the strengths and weaknesses of this strategy?
Strengths:
The logic of the system is simple, no complex calculations were used
The system trades large/mega cap stocks, so slippage will be minimal
Even though this system is public, it trades large/mega cap stocks which means the edge is not likely to go away if multiple people are trading the system
The system can be coded into other backtesting softwares and the performance is reproducible (many times this isn’t the case with systems found online!)
The system provides buy and hold like returns with much less draw down (i.e. risk adjusted performance is better)
The system has good risk management and cuts losers short with a tight stop loss (many times mean reversion systems use massive stop losses or no stop loss at all, which could lead to catastrophe)
Weaknesses:
In my opinion, the system has too many entry rules. I think simplicity is king, we can likely improve this system while also removing rules and parameters.
The use of two stop losses may be overkill and overly complex. It would be worth investigating if we can remove one of the stop loses and reduce complexity
The system performance is similar to buy and hold, but due to the frequent trading, there could be short term tax implications depending on where you live.
This system has a relatively low expectancy, so too much slippage will be problematic
Overall, I am definitely interested in continuing the exploration of this system. While this system may not be absolutely amazing on its own, as part of a diversified portfolio of many systems it could have some real potential.
Before we adjourn from part one of this investigation of the short term mean reversion system, let’s ensure this system is potentially tradable after accounting for market frictions. How do we do that? Simple, add the impact of slippage and commissions! I added the commission structure of Interactive Brokers to the system code and a slippage assumption of 0.025% on entry and exit (remember this system trades some of the largest stocks in the US market, slippage should generally be very small, if any at all).


The system definitely still holds up. Some degradation was seen and is expected, but the system is still profitable. The expectancy of the system before slippage and commission was 0.61%, after applying slippage and commissions expectancy is 0.53%, definitely still a small edge there.
Now that we have a working version of the baseline system code, we have a foundation to improve the system from. So stay tuned for part 2 of this article series where we will try to simplify, improve, and robustness test the trading system. Spoiler alert, the performance of the system was able to be dramatically improved. You definitely don’t want to miss that, so be sure to subscribe so you are notified when part 2 is available (code of the final system will be shared)!
The code of the baseline strategy for RealTest is shown below. If you have any questions about syntax or how this code works, do not hesitate to reach out!
Import:
	DataSource:	Norgate
	IncludeList:	.S&P 500 Current & Past
	//IncludeList:	.Nasdaq 100 Current & Past
	IncludeList:	SPY

	StartDate:	Earliest
	EndDate:	Latest

	SaveAs:	ShortTermTrend.rtd

Settings:
	DataFile:	ShortTermTrend.rtd
	StartDate:	1/1/2007
	EndDate:	Latest
	AccountSize:	100000
	BarSize:	Daily


Data:
	Rule1:	InSPX

	Rule2:	C>1

	Rule3_1:	#PercentRank MA(C*V, 20)
	Rule3_2:	Rule3_1 >= 50

	Rule4:	ATR(10) / C > 0.01 AND ATR(10) / C < 0.4

	Rule5:	ROC(C, 100) > 10

	Rule6:	RSI(3) < 20

	Rule7: 	C<O AND (C<O)[1]

	Rule8:	ADX(7) > 30


	AllEntryRules:	Rule1 AND Rule2 AND Rule3_2 AND Rule4 AND Rule5 AND Rule6 AND Rule7 AND Rule8


Strategy: ShortTermTrend
	Allocation:	S.Equity
	MaxPositions:	10

	Quantity:	100 / 10
	QtyType:	Percent

	SetupScore:	ROC(C, 252)
	EntrySetup:	AllEntryRules
	EntryLimit:	C * 0.99

	ExitStop:	max((C - 2*ATR(10))[BarsHeld], HHV(C - 2.5*ATR(10), BarsHeld))
	ExitStopTime:	Intraday

	ExitLimit:	FillPrice*1.04
	ExitLimitTime:	Intraday

	//Commission:	Min(0.01 * FillValue, Max(0.005 * Shares, 1))
	//Slippage:	FillPrice * 0.00025


Benchmark: SPY_Benchmark
	EntrySetup:	Symbol=$SPY


Charts:
	InitialExit:	if(BarsHeld>0, (C - 2*ATR(10))[BarsHeld], nan)
	TrailingExit:	HHV(C - 2.5*ATR(10), BarsHeld)
	ProfitTarget:	if(BarsHeld>0, FillPrice*1.04, nan)
Definitely too many parameters. Trying to adjust them for better results will probably lead to overfitting. I also think that’s those stop losses could lead to problems. Possible to do better. Thanks for the post. From a new subscriber.
Just a question. What is your live execution trading platform ?
Excited for the second part. I thought exactly the same: too many rules for the entry setup