

The TradeQuantiX Portfolio
A deep dive into my personal systematic trading portfolio

When somebody says they trade systematically, that could mean so many different things. Are they trading one strategy or multiple strategies? Are they intraday trading or trading on a daily/weekly/monthly timeframe? Are they trading stocks, futures, forex, or crypto? Are they fully automated or not automated at all? There are so many different styles/methods of systematic trading out there. In this article I want to go over how I trade systematically. I will talk about the kind of strategies I trade, the timeframes, the markets etc. I will do this by going through and showing each component of my current portfolio. That way, you can get an idea of one way to trade systematically. It will also provide insight into how I think about my trading and why I do things the way I do.
My Personal Portfolio Philosophies:
First, let’s go over my thought process when it comes to systematic trading, starting with goals. Goals are very important to understand because my portfolio construction is governed by what my long term goals are. If my main performance goal was getting the highest outright returns, then my portfolio would look very different than if my goal was achieving the best risk adjusted returns. My high level goals are:
Outperform the S&P 500 over the long term (multi year timeframe) with an average compounded annual growth rate of 25% or more
Do not exceed a drawdown of more than 25%
Do not have a drawdown longer than 1 year
Ensure my trading does not interfere with having a day job
Grow my account through trading to the point where I have the ability to quit my day job, if I want, in the next 7-10 years
These are the very high level goals I have set for myself with my systematic trading. There are definitely more specific sub-goals within these main goals that are needed to keep me on track, but these main goals are enough to start defining how I operate as a systematic trader. The first three goals all work together as they are defining the performance I am looking for. The fourth goal defines the lifestyle my trading has to fit within. The final goal is the outcome of achieving all the other goals. If I outperform the broad stock market, with drawdowns that are small in depth and short in duration, and I am able to do all this while having a day job, then I should be able to grow my account enough to where one day I can become an independent trader and quit my job if I desire. All of these goals work together. It is worth noting that some of these goals are performance related goals. I cannot control what the markets will do and what performance the markets will give me. I am sure the markets are going to give me some good but also some crappy years in the future. All I can do is develop my systematic trading portfolio such that I am in the best possible position to reach those goals.
So, how do I position myself to be in the best possible position to achieve these main goals? Well doing that with just one trading system is going to be difficult because the holy grail trading system doesn’t exist. Also, I am not going to be able to find consistency with high returns and low drawdown in every market environment with only one system. So, the best way to achieve consistency is with a portfolio of many uncorrelated trading systems. What does this mean? Trading a portfolio of many uncorrelated trading systems is when you trade multiple systems at the same time where each system seeks to profit in a different market environment and/or a different market phenomena.
Each trading system within the whole portfolio holds its own mini portfolio of stocks, and the combination of all these trading systems holding mini portfolios works together to create the whole portfolio. Kind of a funny concept, it’s basically a portfolio of portfolio’s. Since all of these trading systems are uncorrelated to some degree, this gives me portfolio diversification. Diversification allows me to control my risk and keep my drawdowns within my desired tolerance. The more systems I have that profit from different market environments and phenomena, the less likely I am to be in large drawdowns and the more likely I will be pulled out of drawdowns sooner. The sooner I am pulled out of drawdowns then faster my portfolio grows. Thus, this portfolio approach helps me achieve my first three goals in my systematic trading.
The fourth goal is achieved in a slightly different way. I have a day job, therefore I am not able to trade during the market hours. So how do I trade then? Well, I definitely can’t trade intraday, at least not without a complex order management automation software, which I don’t have. So I am restricted to only placing orders outside of market hours, when I am home in my free time. How this works is I have my portfolio of systems, each one of those systems is coded up and there is no discretion within the system itself. These trading systems use daily data and generate buy and sell signals for the next day after the market closes. Every morning, before I leave for work, I can run all my trading systems which output the orders I need to place for that day. I then place those orders with my broker, the broker holds the order for me until the market opens, which is when those orders are executed. This is the general framework of my whole process, which is tailored to my personal situation. It allows me to trade even though I am at work during the normal market hours. If I could be home all day and not have a day job, I may do things very differently. This framework allows me to trade consistently everyday even though I am not available during market hours.
While my overall process does not guarantee I hit these goals, what it does do is place me in the best position to get there. I cannot force the markets to make me money, all I can do is position myself in the best possible way to take advantage of what opportunities the markets will give me. If I position myself to meet the first four goals, then the fifth goal of quitting my day job falls into place. You should have a think about what your long term goals are for your trading. Then think about how you are going to position yourself and your portfolio to achieve these goals.
How I Constructed My Portfolio:
Alright, that’s enough of my philosophies and thought process. Let’s dig into the good stuff and dissect my systematic trading portfolio. I achieve diversification via four main methods, trading different universes, trading different systems, trading different timeframes, and trading long and short.
The Markets My Portfolio Trades:
USA stock market:
NASDAQ 100
S&P 100
Russell 1000
All USA stocks
ASX stock market:
All ASX stocks
TSX stock market:
All TSX stocks
You’ll notice I have systems on the USA stock market that trade different sub universes within the overall stock market. For example, some systems trade all USA stocks while other systems trade stocks specifically in the S&P 100. For the ASX (Australian stock market) and TSX (Canadian stock market) I trade all stocks, I do not currently trade any sub universes within those markets; but one day that could change as I add more trading systems.
Note: All these systems have liquidity filters, so when I say a system trades all stocks in the universe, that means it trades all stocks with sufficient liquidity within that universe. A subtilty, but worth noting.
The System Types My Portfolio Trades:
Time series momentum (Trend Following)
Cross sectional momentum
Mean Reversion
These are what I would classify as the main three system types I trade. Time series momentum buys stocks performing the best in relation to its own history. Cross sectional momentum buys stocks that are performing the best in relation to the entire universe. Mean reversion buys oversold stocks, looking to profit when the price reverts back to its mean. For short side trades, just inverse the descriptions I just provided.
The Timeframes My Portfolio Trades:
Daily
Weekly
Monthly
The lower the time timeframe, the more precise you can be with your entries and exits, but you are more susceptible to market noise. With higher timeframes, your entries and exits are not as refined, but more of the market noise is filtered out. There are pros and cons to each approach, but the best approach is to trade as many timeframes as possible to achieve the most diversification as you can.
The Directions My Portfolio Trades:
Long
Short
Trading only one direction is great until the markets go against you. Trading both directions allows you to profit no matter what direction the market decides to go. The markets are biased upwards, so I do have more longs than shorts, but adding more shorts is definitely on my to-do list.
When you trade with multiple systems that look at the markets in so many different ways, you are more likely to make profits more consistently. This is because where one system lacks, another system seeks different opportunities and picks up the slack.
Details Of Each System In My Portfolio:
Now, let’s look at each of the systems in my portfolio in a little more detail so you can see how each piece of the puzzle falls into place. I currently trade 25 systems, some of those systems are very similar. Similar systems will be shown together on the same plot. The way I have my system code set up is if the systems are similar enough, they live in the same code, so that’s how I will show the performance. Below I will show the historical backtests for each of those systems and the overall system stats, such as compounded annual growth rate, drawdown, expectancy etc. This is the fun stuff, if you like looking at equity curves like I do, then you’re going to love this section.
System 1:
Market: ASX
System Type: Timeseries Momentum
Timeframe: Daily
Direction: Long


System 2:
Market: ASX
System Type: Timeseries Momentum
Timeframe: Weekly
Direction: Long


System 3:
Market: ASX
System Type: Cross Sectional Momentum
Timeframe: Monthly
Direction: Long


System 4:
Market: ASX
System Type: Mean Reversion
Timeframe: Daily
Direction: Long


System 5:
Market: TSX
System Type: Timeseries Momentum
Timeframe: Daily
Direction: Long
(Note: I do not currently have data pre-2005, I renewed the wrong data package on accident this year for the TSX, which limits the historical data I have. Silly me…)


System 6:
Market: TSX
System Type: Mean Reversion
Timeframe: Daily
Direction: Long
(Note: I do not currently have data pre-2005, I renewed the wrong data package on accident this year for the TSX, which limits the historical data I have. Silly me…)


System 7:
Market: USA
System Type: Timeseries Momentum
Timeframe: Daily
Direction: Long
(Note: I do not have access to historical data pre-2015)


System 8, 9, 10:
Market: USA
System Type: Cross Sectional Momentum
Timeframe: Monthly
Direction: Long
Each colored line is a similar system, the gray area is the combined performance of these similar systems


System 11, 12, 13:
Market: USA
System Type: Timeseries Momentum
Timeframe: Daily
Direction: Short
Each colored line is a similar system, the gray area is the combined performance of these similar systems


System 14, 15, 16:
Market: USA
System Type: Mean Reversion
Timeframe: Daily
Direction: Short
Each colored line is a similar system, the gray area is the combined performance of these similar systems
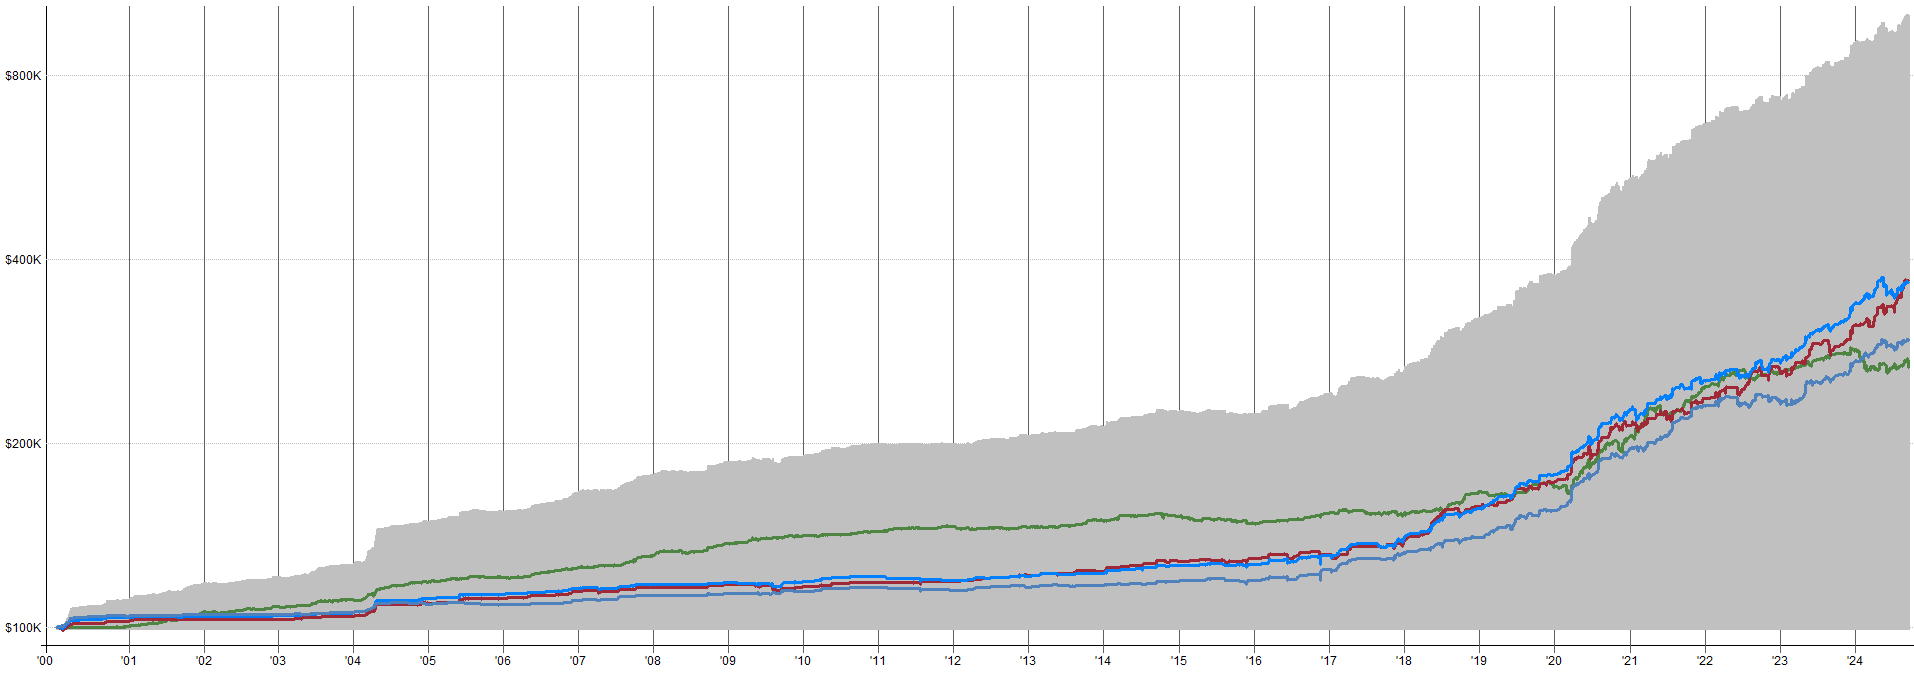

System 17, 18, 19, 20, 21, 22, 23, 24, 25:
Market: USA
System Type: Timeseries Momentum
Timeframe: Daily
Direction: Long (Long volatility which is similar to shorting the market)
Each colored line is a similar system, the gray area is the combined performance of these similar systems


Note: Slippage, commissions, and short borrow fees are all baked into these backtests. It is important to note a backtest is just that, it is only how a certain set of rules has performed historically, there is no guarantee of future returns. There are best practices/methods you can follow to increase the odds of future performance, but it’s never guaranteed. These best practices/methods will have to be saved as topics for other articles.
You’ll notice not a single one of these systems is amazing. You may classify some of the systems as pretty good, you may classify some of the systems as bad, or maybe even terrible. The thing is, I don’t care about an individual systems performance, I care how it contributes to the overall portfolio. Each one of these systems serves a purpose, whether that purpose is to make money in bull markets, in high volatility events, during choppy markets, or during bear markets. When you combine all these systems into one mega portfolio, the outcome is more than the sum of the parts. See below for the backtest of the entire portfolio, where each of the systems above is combined together with a specified allocation of capital based on some fraction of my entire account size.
Whole Portfolio Backtest:


You can see the combined performance of all the systems I currently trade above. All the little colored lines at the bottom are the contributions of each individual system, and the grayed out area is the entire portfolio performance. As you can see, I am beating the goals I laid out at the start of this article… at least historically. I expect some decay over time, whether that be due to mild curve fitting in some of my strategies, a systems edge decaying, execution mistakes etc. But with a 36% compound annual return and max 15% drawdown, I have some wiggle room and can still meet my objectives.
Whole Portfolio Drawdown Plot:

This is the underwater drawdown plot for the entire portfolio. The majority of the time my historical drawdown is around 2%-5% on average, with some spikes from time to time into the double digits of drawdown. The areas of larger drawdown are market regimes I am not profiting well in, and I should look into developing systems to fill those gaps in my profitability surface.
Whole Portfolio Drawdown Length Plot:

This plot shows how many days I am in a drawdown. The longest period of drawdown historically was 246 days, just shy of 1 year (there are 252 trading days a year). Obviously there is a pothole in performance I need to fill to reduce the worst case drawdown length. With that said, the majority of time my drawdowns are short lived, with an average drawdown length around 40 days.
Whole Portfolio Exposure Plot:

You’ll notice from my exposure plot that I am usually not using all of my capital and that I do not go into margin very often (an exposure above 100% means I am in margin). This is because the capital each system uses ebbs and flows with the markets. If there are lots of sets ups for a particular system, then it will use more of its allocated capital and take more trades. If there are not many set ups, then the system will not use all the capital allocated to it and take fewer trades. Very rarely, if ever, is every system 100% allocated at the same time. The only times where I go into margin is when the markets begin to transition from a risk on to a risk off environment. This is because all my longs are just starting to be sold while all my shorts and hedges are starting to kick on. During this time period there is some overlap between risk on and risk off systems, leading to using some margin (though not a lot). In my eyes, using margin for the purposes of aiding in this hand off of capital from risk on to risk off systems is acceptable. What would not be acceptable, based on my goals, would be to use a lot of margin all the time to boost my returns. This increases my risk of blowing up my account to a level higher than I am comfortable with. It also risks me experiencing a drawdown outside of my risk tolerance and goals listed above.
Whole Portfolio Number Of Orders Plot:

This plot shows how many orders I place into the markets a day. As you can see, this portfolio is pretty active, placing up to 60+ orders a day! While that is a lot of orders, the format which my trading software outputs orders can be directly sent to my broker in seconds, it’s very fast and convenient. Also, I can do all of this outside of market hours during my free time. Just goes to show there are ways to trade active portfolios even with a day job.
Closing Remarks:
This portfolio of trading systems is an ever growing and never ending process improvement project. I am always looking for what’s next, and what new system my portfolio could benefit from. I know one hole in the portfolio is a system designed to profit from shorting small market pull backs. I already have a couple systems for shorting large pullbacks, but nothing for smaller pullbacks. Adding this type of system would definitely smoothen the equity curve and reduce my drawdown, so it is on the to-do list. This continuous improvement mindset puts me in the best position possible to reach my goals.
Eventually, I would like to have over 100 systems all working together to create an invincible portfolio. I am also open to trading more than just stocks one day, including futures and crypto. Or I could even develop my own solution to allow myself to trade intraday over shorter term time horizons of just minutes to hours. There are so many ways I could go to improve and expand the portfolio further, the key is to just pick something and see what I can do with it. If it turns out to be a dead end, don’t drag it on for too long, drop the idea and move onto the next. This is the best way to continually improve. As long as I am continually improving, then my chances of meeting my goals presented at the start of this article can only increase.
If you have any questions about my portfolio and how I do things, send me a message.
That’s all for today, hope you found this article interesting. Let me know what you want to read about next!
Excellent article and I appreciate the openess of your approach and portfolio construction. I am on the same journey, but only 5 systems in, so great to see someone who is a couple of steps ahead. Some questions for you -
1. Did you build your systems from scratch and/or purchase them?
2. Are you fully automated?
3. How do you manage your capital allocation to each portfolio?
4. I notice the last system has a 65% drawdown - is this a protection for a black Swan event? (Have you read Laurens bensdorp book?).
Thanks again Darc
Awesome article. Really cool to see the portfolio level returns vs the individual systems. Sounds a lot like Basso's all weather approach with a commitment to filling the potholes. Great stuff!