

Robustness Testing Methods: A Complete Guide for Systematic Traders
Parameter sensitivity, Monte Carlo, multi-universe: here is how to use each test, what the results mean, and when your system actually passes.


Welcome to the “Systematic Trading with TradeQuantiX” newsletter, your go-to resource for all things systematic trading. This publication will equip you with a complete toolkit to support your systematic trading journey, sent straight to your inbox. Remember, it’s more than just another newsletter; it’s everything you need to be a successful systematic trader.
Introduction:
Well, we’ve all been there. You spend a weekend coding up a new trading system. You run the backtest. The equity curve is going up and to the right. The Sharpe ratio looks decent. The drawdown is manageable. You’re already thinking about how much capital to allocate.
But here’s the question you should be asking before any of that: how do you know if it’s real?
Most traders I talk to apply one, maybe two robustness checks and call it a day. They’ll run an out-of-sample test or eyeball a parameter sensitivity plot and move on. I used to be in that camp early on (if I even ran a robustness test at all...).
But after building and testing 100’s of systems, I can tell you that each robustness test catches something different. Missing even one of them means you might be missing the exact reason your system fails once real money is on the line.
This purpose of this article is provide the how to for robustness testing, and includes some goodies as well in terms of tools to help you do it.
I’m going to walk through five robustness testing methods that I use on nearly every single system before it gets anywhere near my hard earned capital:
Parameter Sensitivity Analysis (+/- 25%)
Multi-Market Validation
Trade Skip Monte Carlo
Noisy Data Monte Carlo
Entry and Exit Delay
Each one tests a different thing. Each one can expose a different weakness within the system that’s maybe not obvious on the surface.
I’ve also built a free Excel template that helps automate the visualizations and calculations for all five tests.
You paste your backtesting output in, and it generates charts, summary stats, histograms, and percentile rankings automatically. I’ll walk you through how to use it before we get into the tests themselves.
Let’s get into it.
Why Each Method Tests a Different Thing:
Before we get into the specifics, I want to make sure the big picture is clear. These five tests are not redundant. They are not five ways of asking the same question. Each one is probing at a different vulnerability within your system.
Parameter sensitivity: did I accidentally happen to pick the one lucky combination of parameters that works, or is this a stable region of performance?
Multi-market validation: is this edge specific to one market and does the underlying mechanism exist more broadly? Or did I just curve fit to noise.
Trade skip Monte Carlo: does the system depend on a few lucky trades and is the system curve fit to a specific sequence of trades? Or does the system robustly capture different trading opportunities when needed?
Noisy data Monte Carlo: if the prices were slightly different (which they always will be going forward), does the system still work? Or is the system curve fit to noise.
Entry/exit delay: does the system require perfect fills? And how precise are the entry and exit mechanisms the system is capturing? Some systems need that precision, others don’t. This robustness test isn’t applicable to all systems, but it’s a great test for where it is applicable.
This is not an all exhaustive list, but it is enough to help us learn a lot about the durability of a system.
These robustness tests generally come after the system is fully developed on both in-sample and out-of-sample data. You’ve built the system, you’ve validated it out of sample, and now you’re stress testing it from every angle before committing capital.
That said, there’s nothing stopping you from running these tests on just your in-sample data during development to get a preliminary feel for system stability. If parameter sensitivity looks terrible on in-sample alone, there’s no point continuing to the out-of-sample phase.
I want to make something clear before we move on: the point of robustness testing is not to find a perfect system. There is no perfect system. The point is to calibrate your confidence in an imperfect one. These tests help you understand exactly how imperfect your system is and whether you can live with it.
Let’s start with the tool that makes all of this easier.
The Robustness Testing Excel Template:
Before we walk through each test, I want to introduce a tool I built specifically for this article (but now I’m going to start using it and expanding it over time, I’ll share it with you as I do, consider this the v1.0 of the tool).
It’s an Excel workbook that takes the raw output from your backtests and does a lot of the robustness analysis automatically. No formulas to write, no charts to build manually.
You paste data in, and it gives you everything you need to evaluate your system. At least that’s the idea.
Maybe it doesn’t show everything yet, but over time I’ll get it there and share updates as it gets built.
You can download the Robustness Testing Template workbook attached to this post.
How It Works:
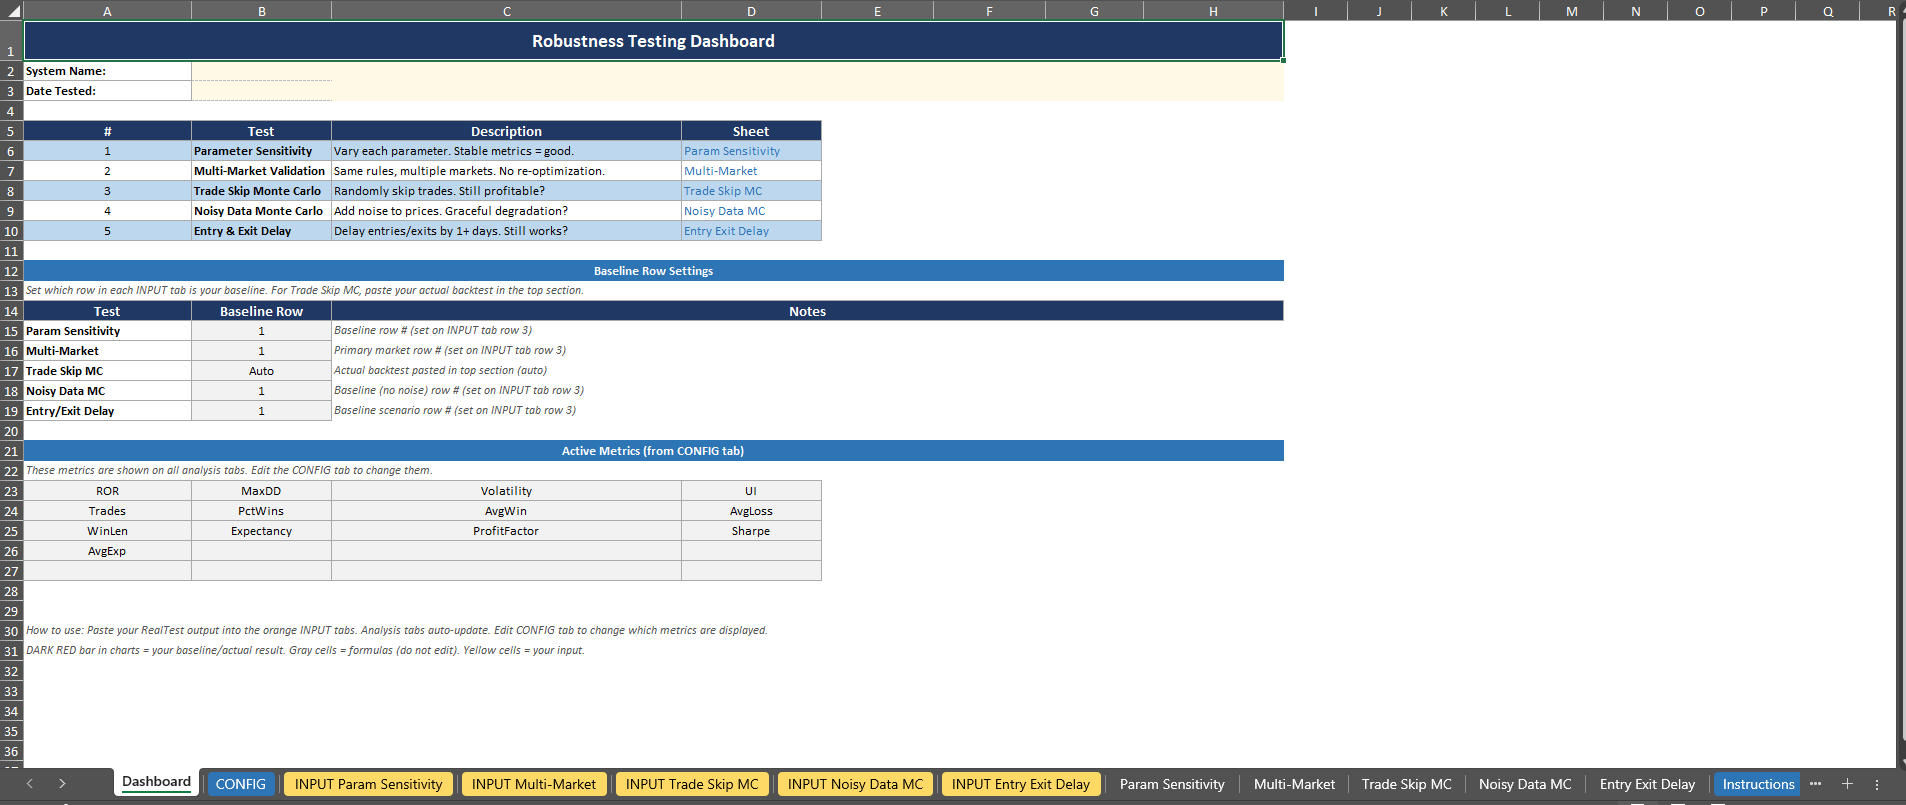
The workbook has 13 tabs, organized by color:
Orange tabs (INPUT): This is where you paste your backtesting output. There are five input tabs, one for each robustness test. Each one accepts up to 1,000 rows.
White tabs (Analysis): These auto-populate with tables, histograms, and summary statistics based on whatever you pasted into the corresponding input tab.
Blue tabs (CONFIG and Instructions): The CONFIG tab lets you choose which metrics you want to analyze. The Instructions tab walks you through everything step by step.
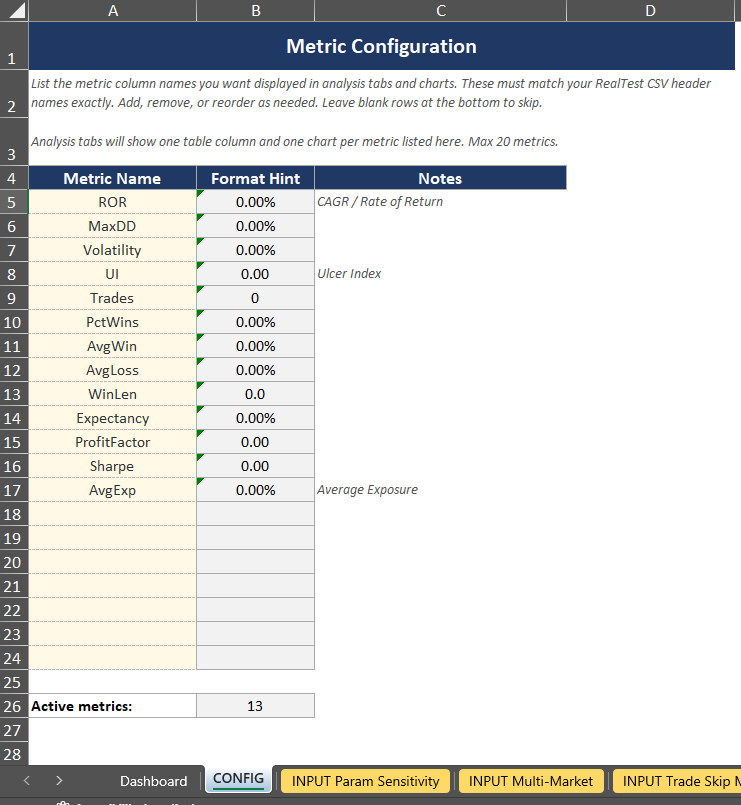
Setting Up Your Metrics:
The CONFIG tab is where you tell the workbook which metrics matter to you. By default, it comes loaded with 13 metrics that I consider on every system: ROR, MaxDD, Volatility, UI, Trades, PctWins, AvgWin, AvgLoss, WinLen, Expectancy, ProfitFactor, Sharpe, and AvgExp. You can add up to 20 performance metrics total.
None of the performance metric column values are hardcoded. The workbook is smart enough to lookup each metric by its header name.
So, if your backtester outputs columns in a different order, or uses slightly different names, or you have your own custom metrics, you just make sure the header names on your CONFIG tab match the headers you pasted in. Then that just flows through the rest of the excel sheet.
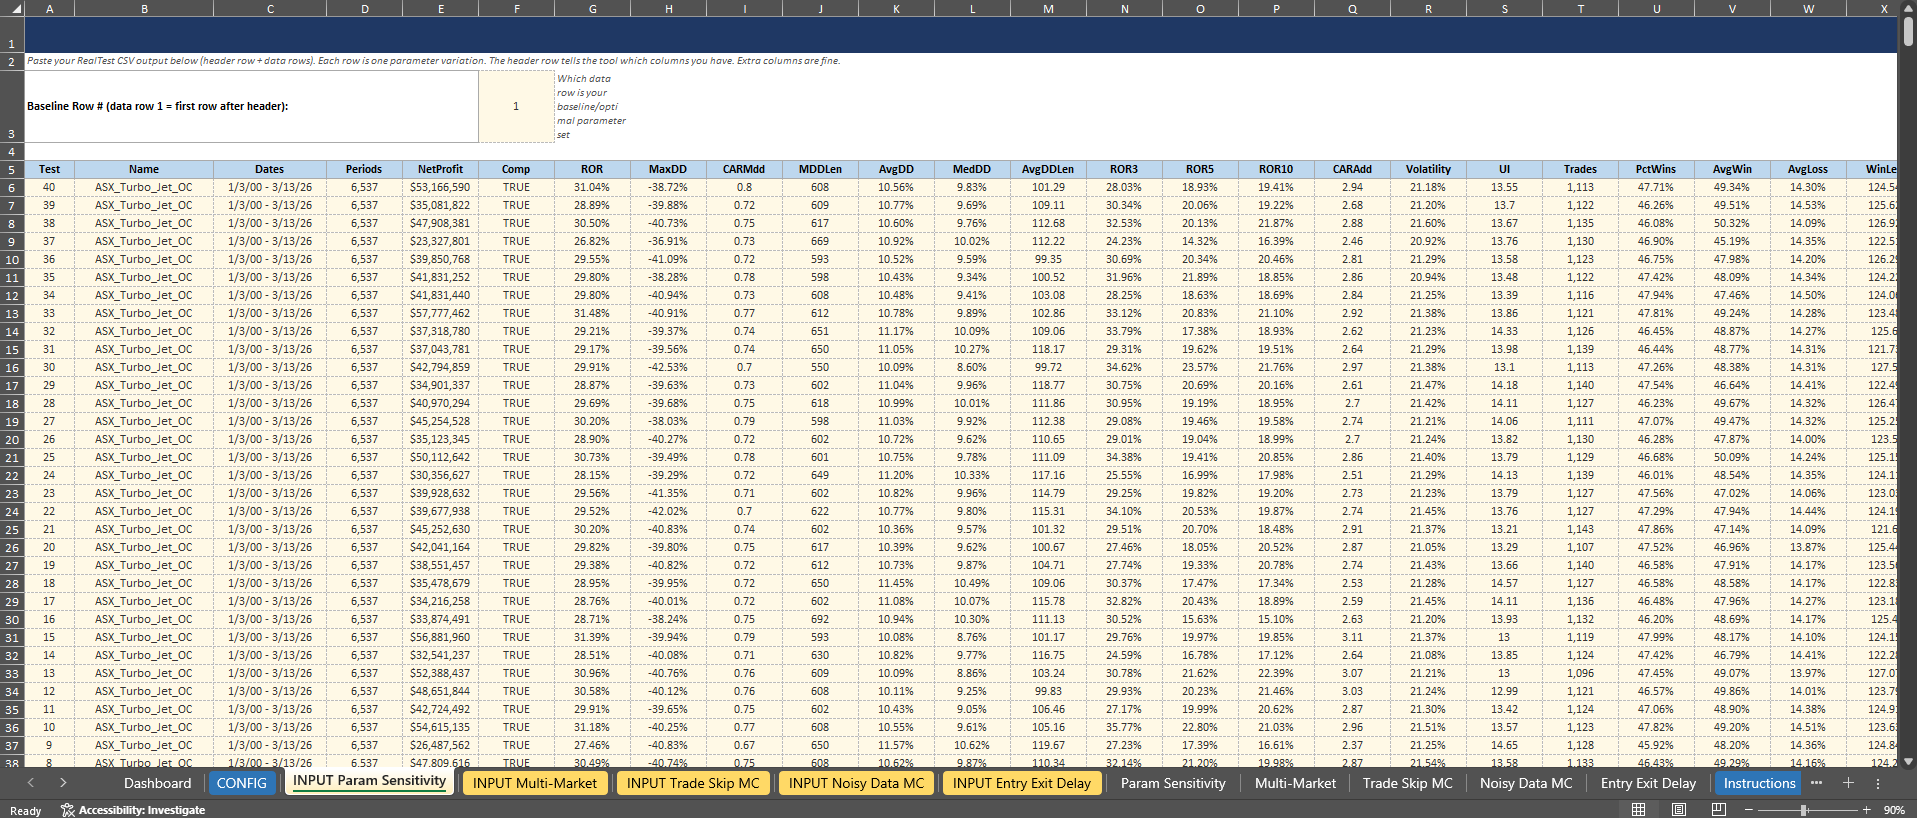
Pasting Your Data:
Each INPUT tab has a blue header row at the top of the paste zone. Here’s the steps to input your data for a robustness test:
Run your robustness test in your backtester (RealTest, AmiBroker, custom python code, whatever else you use…)
Export the results to a CSV
Open the CSV, copy the header row, and paste it into the blue header row on the INPUT tab corresponding with the robustness test you ran
Copy your data rows and paste them below the header row
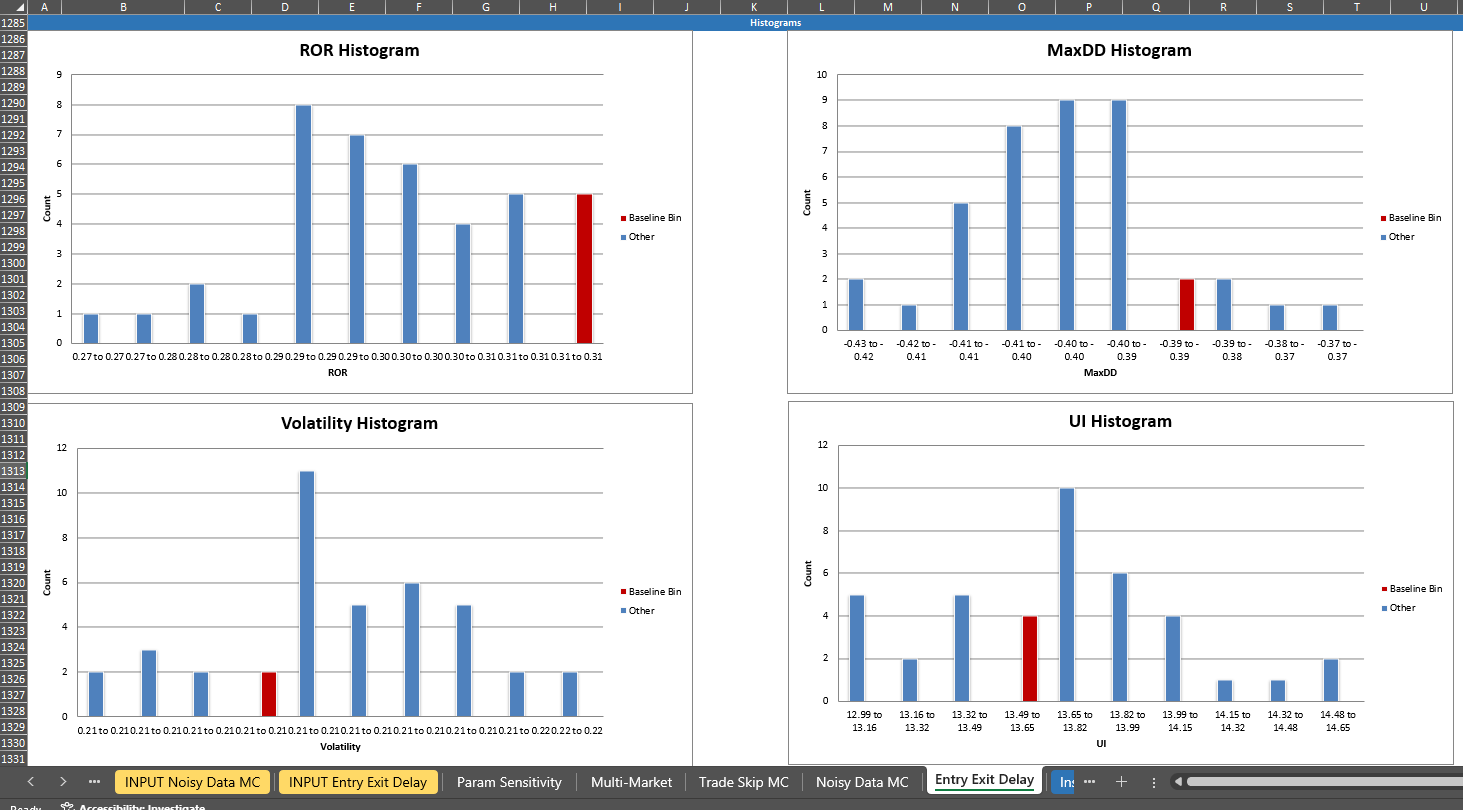
That’s it. The analysis tab for that test will auto-populate with everything: summary stats (min, max, median, percentile of your baseline), and histograms showing the distribution of results with your baseline system results highlighted in dark red.
Setting Your Baseline:
For four of the five tests (Parameter Sensitivity, Multi-Market, Noisy Data, and Entry/Exit Delay), you’ll see a “Baseline Row #” cell at the top of the INPUT tab. Enter the row number of your baseline system. This tells the workbook which result to highlight in the charts and which to calculate the percentile against.
For Trade Skip Monte Carlo, the layout is slightly different. Your actual backtest result goes in the top section (rows 6-7), and the Monte Carlo simulation results go below (starting at row 11). The workbook then shows you where your actual result falls in the distribution.
What You Get:
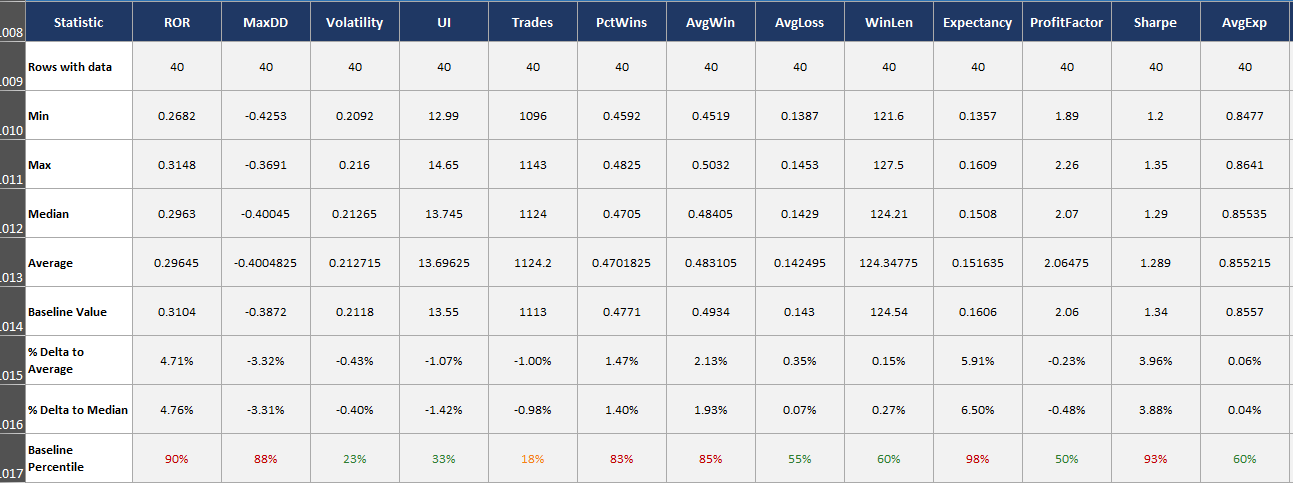
For each test and each metric on your CONFIG tab, the analysis tabs generate:
Summary statistics: min, max, median of all results, plus the percentile rank of your baseline system and the delta between baseline system and the average/median result from the robustness test. The Baseline Percentile row gives you the quick answer: where does my system sit relative to everything else?
Histograms: bucketed distribution of results across 10 bins, with the bin containing your baseline system results highlighted in dark red. The histograms show you the shape of the distribution. Is it a nice bell curve centered around the baseline? Or is the baseline sitting out on the right tail? The shape matters because it tells you whether the parameter surface is a plateau (normal or uniform distribution) or a spike (skewed distribution with your baseline on the edge).
The percentile is the key number. For example, if your baseline system’s ROR, volatility, Sharpe etc. are all in the 50th percentile of the parameter sensitivity results, that’s a good sign.
It means you’re in the middle of the distribution, not perched on a lucky peak. If it’s at the 95th percentile, that should make you nervous. You accidentally picked parameters near the top of the range, and the only direction from there is down (and that’s usually where live results end up too… down).
With the tool introduced, let’s walk through each test.