

Portfolio Development Series - Part 1
An Introduction To Portfolio Level Thinking And Its Importance

Welcome to the “Systematic Trading with TradeQuantiX” newsletter, your go-to resource for all things systematic trading. This publication will equip you with a complete toolkit to support your systematic trading journey, sent straight to your inbox. Remember, it’s more than just another newsletter; it’s everything you need to be a successful systematic trader.
Introduction:
Due to popular demand, I’m launching a series on developing an equities systematic trading portfolio from scratch. This series won’t cover every tiny detail, that would require an entire book. Instead, I’ll focus on the key components and the concepts I believe are critical to understand.
The series will be divided into multiple parts, each focusing on a specific aspect of the trading portfolio we’ll build. The article structure will look something like the following (though may change slightly as the series is developed):
Part 1 (This article): A general overview to portfolio-level thinking
Part 2: Planning out the portfolio and its components
Part 3: Develop system 1 - (system code shared)
Part 4: Develop system 2 - (system code shared)
Part 5: Develop system 3 - (system code shared)
Part 6: Develop system 4 - (system code shared)
Part 7: Combining everything into one portfolio
Part 8: Next steps for the portfolio and forward thinking
Part 9: Other considerations for portfolio design
Portfolio Level Thinking:
Every systematic trader has a set of performance related objectives for their systematic trading portfolio. Some aim for massive returns, others prioritize low drawdowns, and some seek a perfectly smooth equity curve—the list goes on. Whatever your performance objectives, those portfolio goals often linger in the back of your mind.
Let’s consider a hypothetical systematic trader developing a new trading system. He has high-level performance objectives for his portfolio and plans to incorporate this new system into it. Here are our hypothetical trader’s portfolio performance objectives:
Goal 1: Generate at least 15% returns (CAGR) over the long term
Goal 2: Maintain a maximum drawdown of no more than 25%
Goal 3: Avoid drawdowns lasting longer than 2 years
Goal 4: Achieve a Sharpe ratio above 1
Goal 5: Keep volatility of returns below 15%
Goals like these are excellent for defining the performance you expect from a portfolio of trading systems. They provide guidelines to work within. However, when developing individual trading systems, many traders mistakenly believe each system must meet the same performance objectives as the portfolio.
They assume that if the portfolio needs to meet the goals above, every system must also meet those goals.
This is simply not true.
Here’s a controversial statement: individual system-level performance hardly matters. In a portfolio of say 20 trading systems, none of the individual systems may meet all the goals listed above, yet the portfolio as a whole could still achieve them. It’s paradoxical, but the performance of a large, non-correlated trading portfolio is generally greater than the sum of its parts.
Whatever your systematic trading performance goals, no single system needs to meet them. Those goals should be achieved at the portfolio level. For example, if your maximum drawdown tolerance is 25%, it’s entirely possible to trade a system with a drawdown exceeding 25% within a portfolio of many other non-correlated systems. When this system is combined into a systematic trading portfolio, non-correlation between systems and markets means that when one system loses money, another may gain. Thus, a larger drawdown in system A is offset by gains in system B, and the portfolio experiences the average result of the two.
Another factor to consider is how allocation percentages can control portfolio-level results. Suppose you have a stable, robust system that’s likely non-correlated with the rest of your portfolio. If this system delivers 40% returns but has a 50% drawdown, you might hesitate to trade it due to the large drawdown. To address this, you can reduce the allocation to the system. For instance, allocating 25% of your portfolio to this system results in 10% returns and a 12.5% drawdown at the portfolio level which is much less daunting. If a system’s drawdown exceeds your goals but other aspects are compelling, you can allocate less capital to it, ensuring the portfolio-level drawdown aligns with your 25% drawdown target.
In this article, I’ll demonstrate a quick, practical way to implement portfolio-level thinking. We’ll start with a momentum trading system that doesn’t meet our hypothetical trader’s portfolio goals. Then, we’ll apply the same system to multiple other markets to create a diversified portfolio that achieves those goals at the portfolio level.
Start With One System:
To illustrate portfolio-level thinking, let’s begin with one trading system and build a mini-portfolio from there. The key point I’ll emphasize is that the performance of a single system in one specific market doesn’t matter much on its own. Getting caught in a cycle of endlessly optimizing and perfecting a backtest is the enemy of a robust portfolio. We want robust systems. Often, robust systems don’t have flawless backtests—they have ups and downs, with drawdowns that may be longer or deeper than you’d prefer. But this is at the individual system level, not the portfolio level. The magic happens when we combine everything into a portfolio, where the collective result is greater than the sum of its parts.
Let’s walk through an example to demonstrate the impact of portfolio-level thinking. We’ll start with a momentum system applied to one market and examine its system-level performance stats.
Spoiler alert: the system-level stats won’t meet our hypothetical trader’s goals. Then, we’ll apply portfolio-level thinking to this system and show how it can meet those goals at the portfolio level.
Here’s the momentum system concept. It’s simple and straightforward, a common method for implementing momentum in a trading system. Below is a high-level outline of how the system works:
Position Sizing Rules:
Long-only positions on equities
Hold up to 10 different stocks at once
Each position uses volatility-targeted position sizing
Up to 10% of the account is allocated to each position
Entry Criteria:
Momentum ranking factor:
On the first day of each month, calculate the momentum of all stocks in the universe (the momentum ranking factor). I typically average the rate of change (ROC) across different lookback periods, such as:
(ROC(C,50) + ROC(C,100) + ROC(C,200))/3The stocks volatility is not too high:
This rule could be something like the volatility is less than x% or the volatility is in the lower x percentile based on recent history etc.
The stock is in an uptrend:
This rule could be something like the stock is above its moving average or the stock is within x% of it’s yearly highs etc.
The overall market is in an uptrend:
This rule could be something like the NASDAQ 100 is above the 200 day moving average or the 50 day moving average is above the 200 day moving average etc.
If the above rules are all true, the top 10 ranked positions based on the stocks relative momentum (calculated using the momentum ranking factor) will receive an allocation
Exit Criteria:
On the first day of each month, recalculate momentum for all stocks using the momentum ranking factor. Sell any stocks dropping out of the top 10 and replace them with a new stock in the top 10 in terms of momentum
This is a common, straightforward way to implement a momentum trading system. I haven’t shared the exact rules because they’re not critical for this article’s purpose, and I want to encourage creative thinking. There are many ways to define trend, volatility, and momentum. You can add nuance to your own momentum system to make it unique, but that’s a topic for another article.
Use your imagination to explore unique ways to classify these filters. If I shared all my ideas, I’d be training you to think like me instead of fostering independent thinking, which is crucial. If you have questions or need hints about the system, feel free to reach out.
Applying this momentum system to the NASDAQ 100 universe yields the following results:
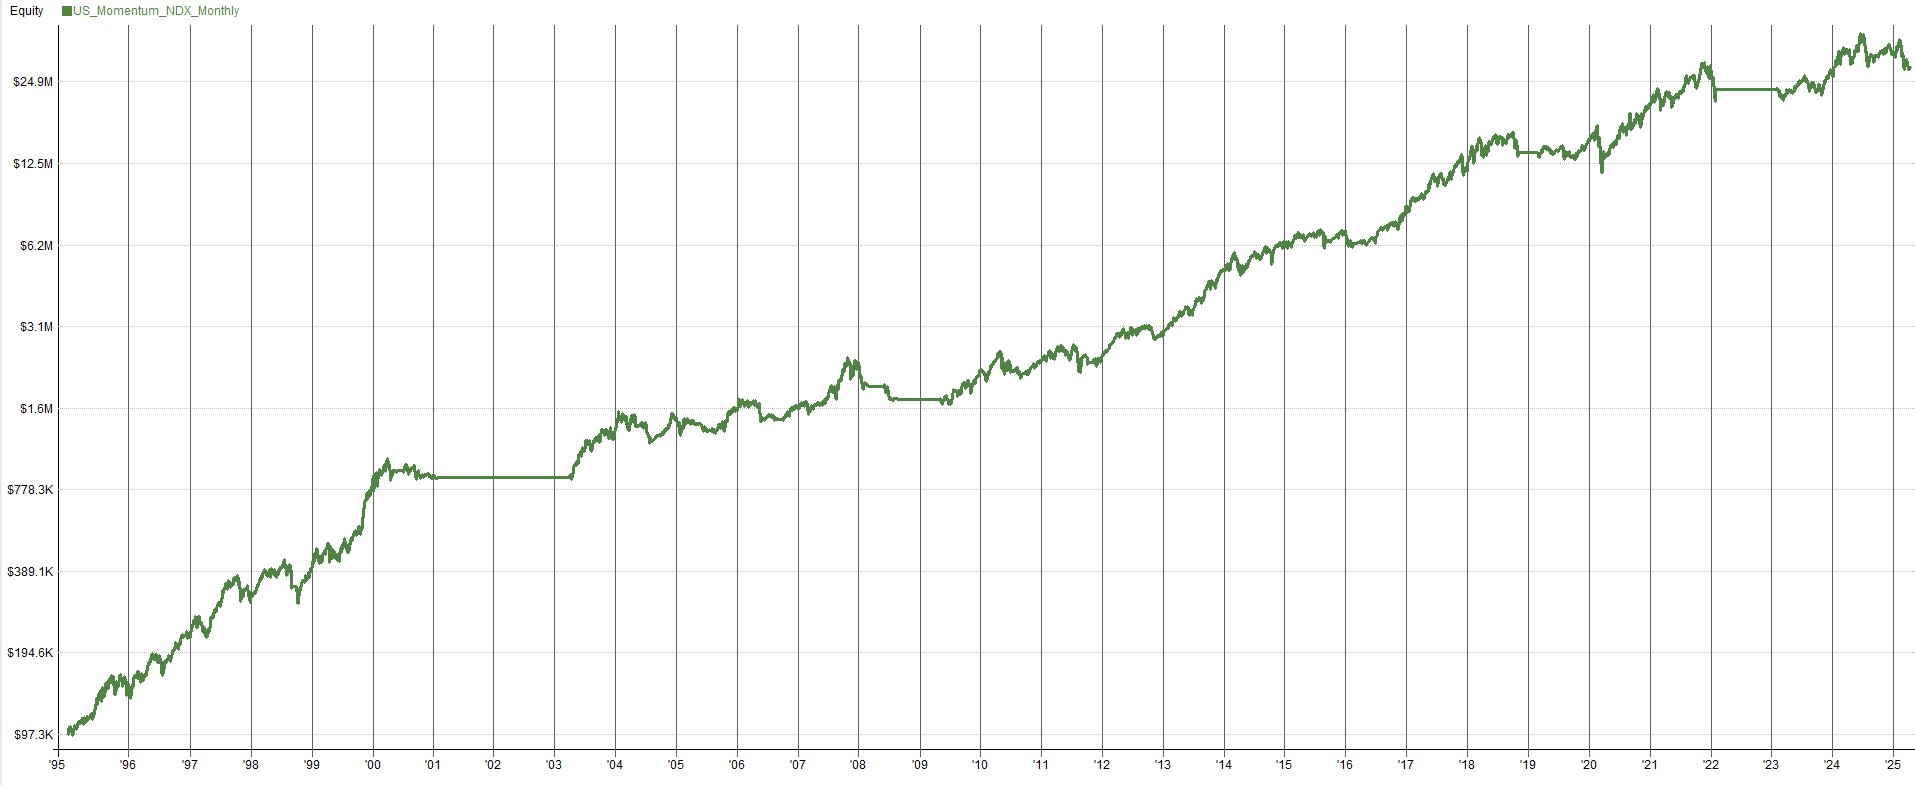

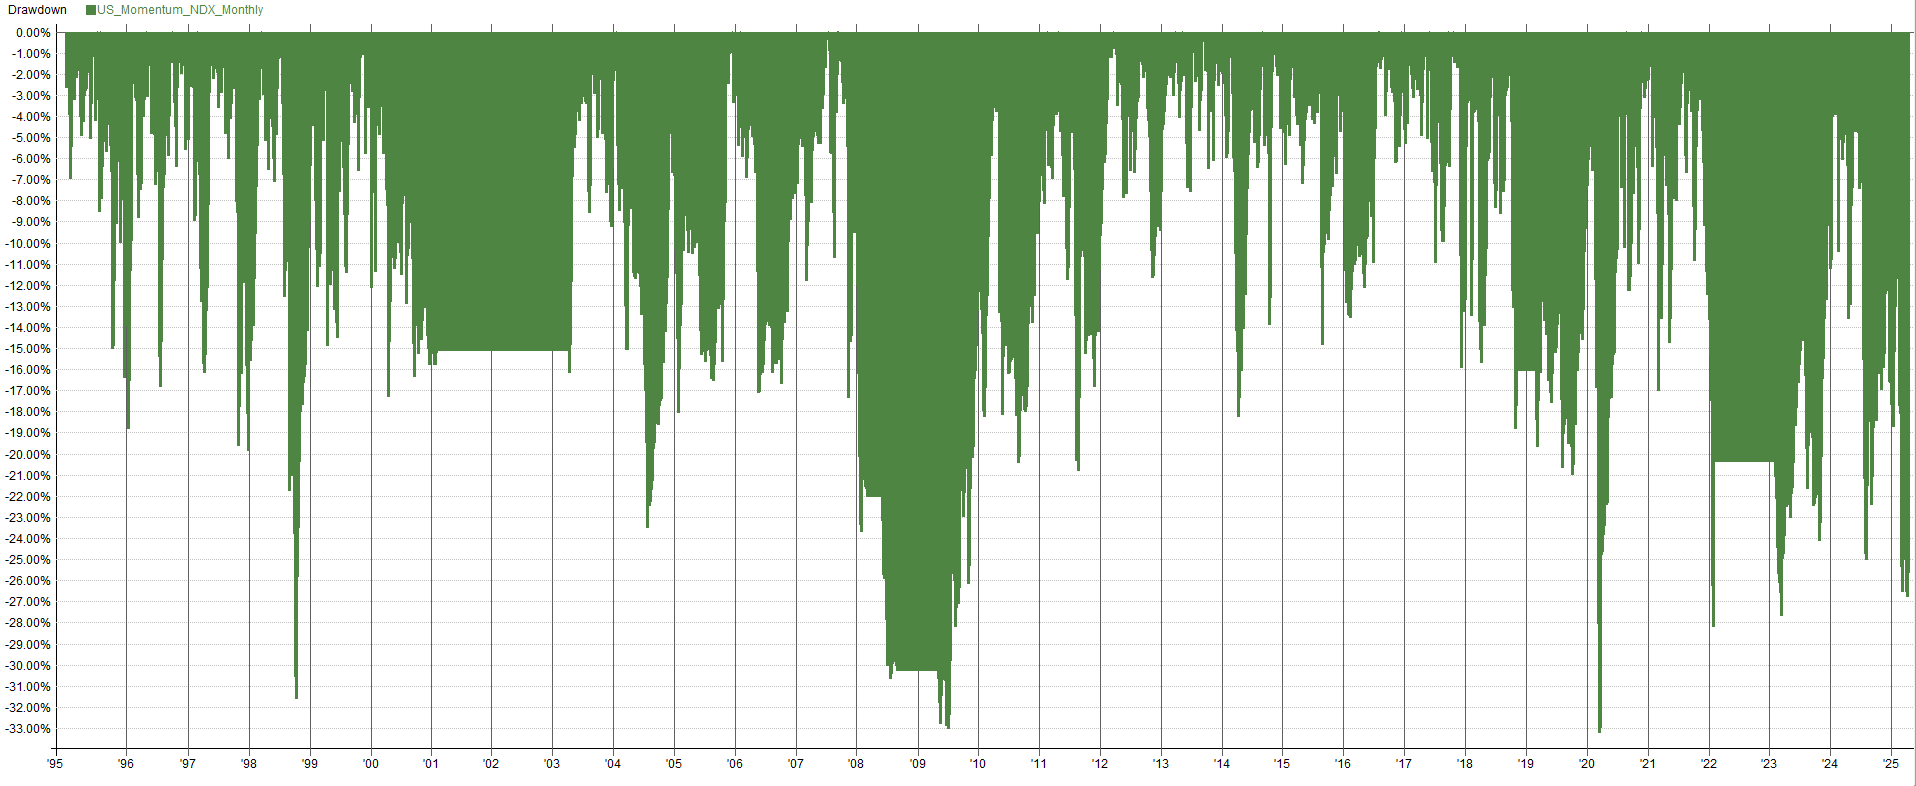
This is a solid system to use as a starting point for the hypothetical traders portfolio. It achieved the following stats, which are relevant to our hypothetical trader:
CAGR: 20.46%
Max Drawdown: 33.26%
Max Drawdown Length: 792 days
Sharpe: 0.91
Volatility: 23.65%
These stats aren’t bad, however, recall our hypothetical trader’s goals: at least 15% returns, a maximum drawdown of 25%, drawdowns lasting no longer than 2 years, a Sharpe ratio above 1, and volatility below 15%.
This system meets only one of these goals, that’s a one out of five score. In school, that’s an F grade, right?
So, what now?
Since this system doesn’t meet the objectives, should we discard it and start over? If we didn’t know better, we might. But I’ll show you how to shift your perspective on these goals.
Why Portfolio Level Thinking Matters:
The profit and loss (PnL) you see in your broker’s terminal each day is the cumulative result of all your trading systems working together. You can think of your portfolio as if it were one giant system.
Let me ask you: would you trade this equity curve?

I bet most people would be happy to trade that equity curve. It’s consistent and slopes up and to the right. Well guess what, that is the equity curve of my whole portfolio with 25+ trading systems all combined together. A lot of those trading systems have drawdowns more than 30%. About half of the trading systems in my portfolio have at least one drawdown that last multiple years. Some of the trading systems have a CAGR less than 10%.
At this point though, do you care? The result is the blue line in the image above. Who cares what each individual system does if the result of all systems combined together creates a portfolio with amazing performance. I’m not meaning for this to be a brag, it’s simply a good example of this concept. I think with time and effort, anyone can create a portfolio like mine too.
To illustrate further with a simple example, imagine four systems (A, B, C, and D) with equal allocations. If system A is in a 30% drawdown but systems B, C, and D are up 20% or more, you might not even notice system A’s drawdown because your portfolio as a whole is in the green. Why worry if system A exceeds your drawdown tolerance (assuming system A isn’t broken and a 30% drawdown is within expectation) when the portfolio as a whole is profitable?
This portfolio-level perspective is critical. It took me three years to grasp this. It wasn’t until the first time I ever ran a portfolio level backtest my mindset shifted from system level thinking to portfolio level thinking. I’ve even included losing systems—yes, systems that lose money—in my portfolio because they profit when others don’t, improving my risk-adjusted performance.
An Example Of What Not To Do:
Over the years, I have helped and worked alongside numerous systematic traders. I’ve seen too many discard perfectly good trading systems because they deemed them subpar. They evaluated the systems only at the system level, not the portfolio level.
One notable example was a systematic trader I knew who created a trend-following system on commodity ETFs. It was profitable, but its CAGR was only in the low double digits, with years of flat performance, and it didn’t look exciting on its own. The trader was ready to abandon the system, but I asked if he recognized its value…
The system profited during the 2008 crash and the 2022 bear market without significant losses in between. I told him that bear market performance was a pretty neat feature of the strategy. I urged him to add it to his portfolio, I told him it would likely enhance performance—and it did. Though unremarkable alone, the system profited when the rest of his portfolio struggled; offering unique market hedge-like behavior and adding immense value to the overall portfolio.
The lesson: don’t evaluate systems in isolation, but as part of the portfolio’s cumulative performance. As the saying goes, don’t miss the forest for the trees.
I’m not perfect either—I’ve definitely been guilty of focusing too much on a system-level mindset rather than a portfolio-level mindset; though I try not to. So, let me know: what kind of mindset do you currently have, and why? Do you tend to evaluate trading systems only in isolation? Or do you also consider a portfolio-level view? Leave a comment about your thoughts:
Implementing Portfolio Level Thinking:
Now, let’s apply this portfolio-level mindset to the momentum system on the NASDAQ 100 that our hypothetical trader is developing. As noted, the current system doesn’t meet the trader’s portfolio objectives. The typical approach most systematic traders would take would be to add more filters, indicators, and parameters, then re-optimize the system; introducing fragility and increasing the risk of overfitting the system. Not a great approach.
Instead, let’s take a portfolio-level approach. How can we transform this system into a mini-portfolio to meet our hypothetical traders goals at the portfolio level?
The solution is simple:
Apply the same momentum system to other countries’ stock markets. This technique is highly effective for robust systems capturing momentum effects. A system that captures momentum in one market should perform similarly in comparable markets. If it doesn’t, it’s likely overfitted. In doing this, we create a mini-portfolio. This mini-portfolio is much more likely to meet the portfolio level objectives of the hypothetical trader.
I did just that, applying the NASDAQ 100 momentum system to the ASX and TSX markets. The backtests below shows the equity curves for the same system applied to individual country stock markets.
On any single market, the momentum system is mediocre and doesn’t meet our trader’s goals. But when applied to multiple markets, the results are compelling, especially when the markets have some non-correlation.
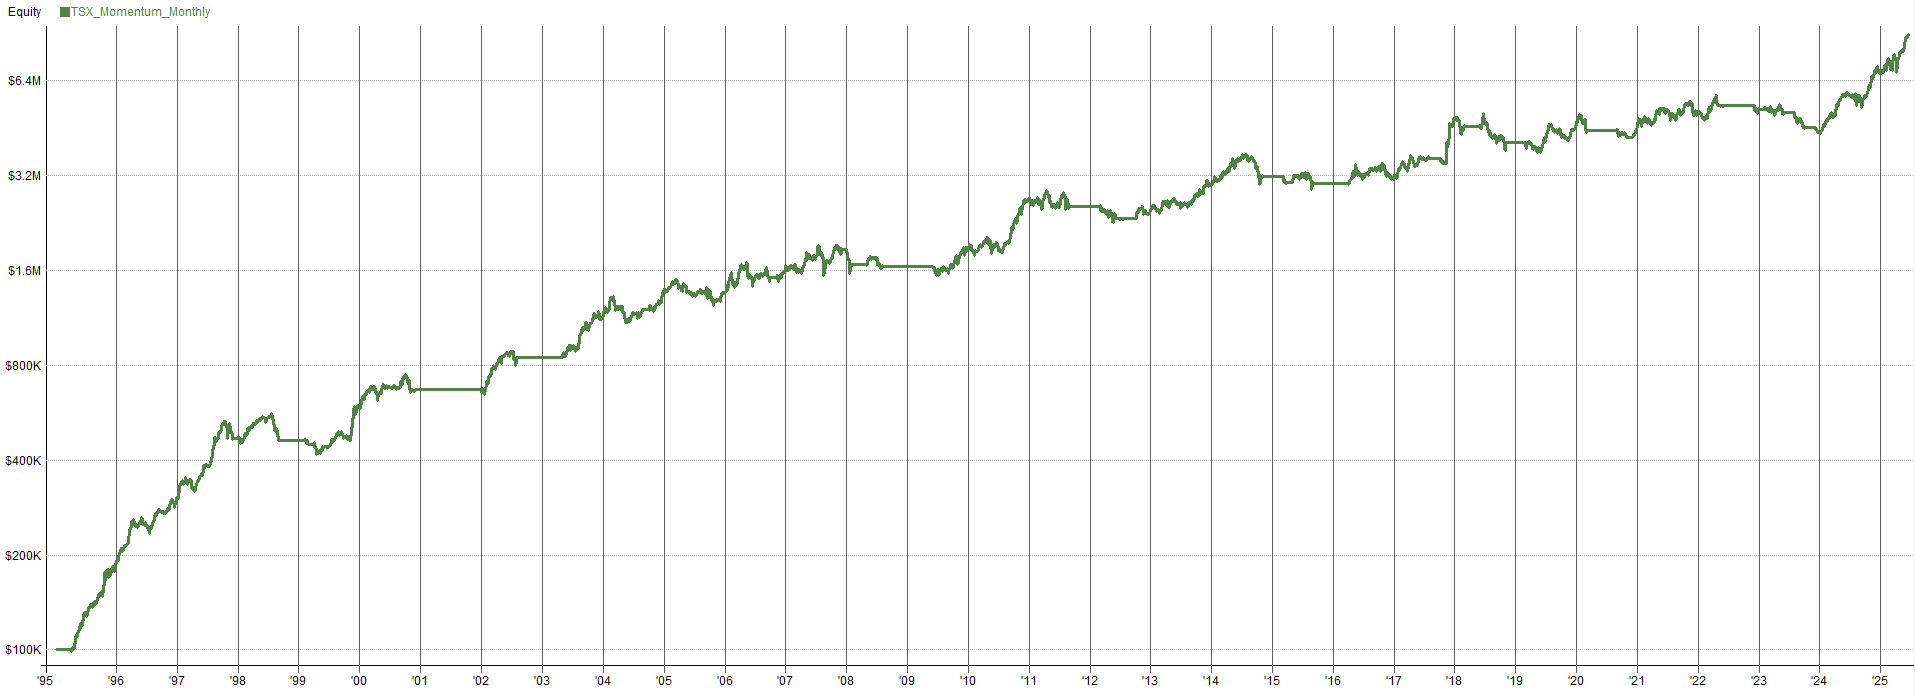
Momentum System Applied To The TSX:

Momentum System Applied To The ASX:
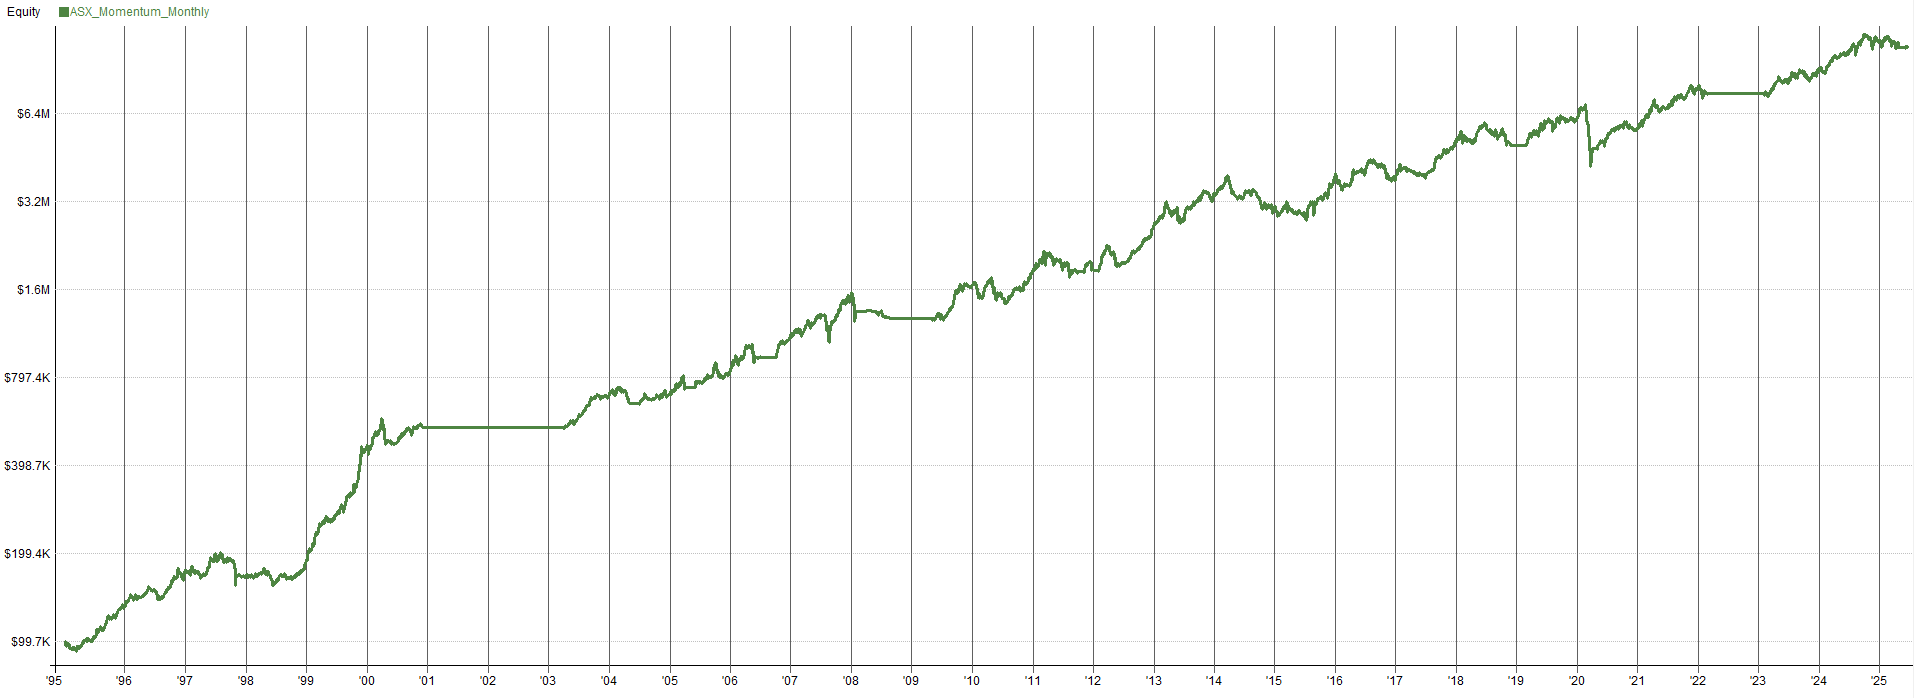

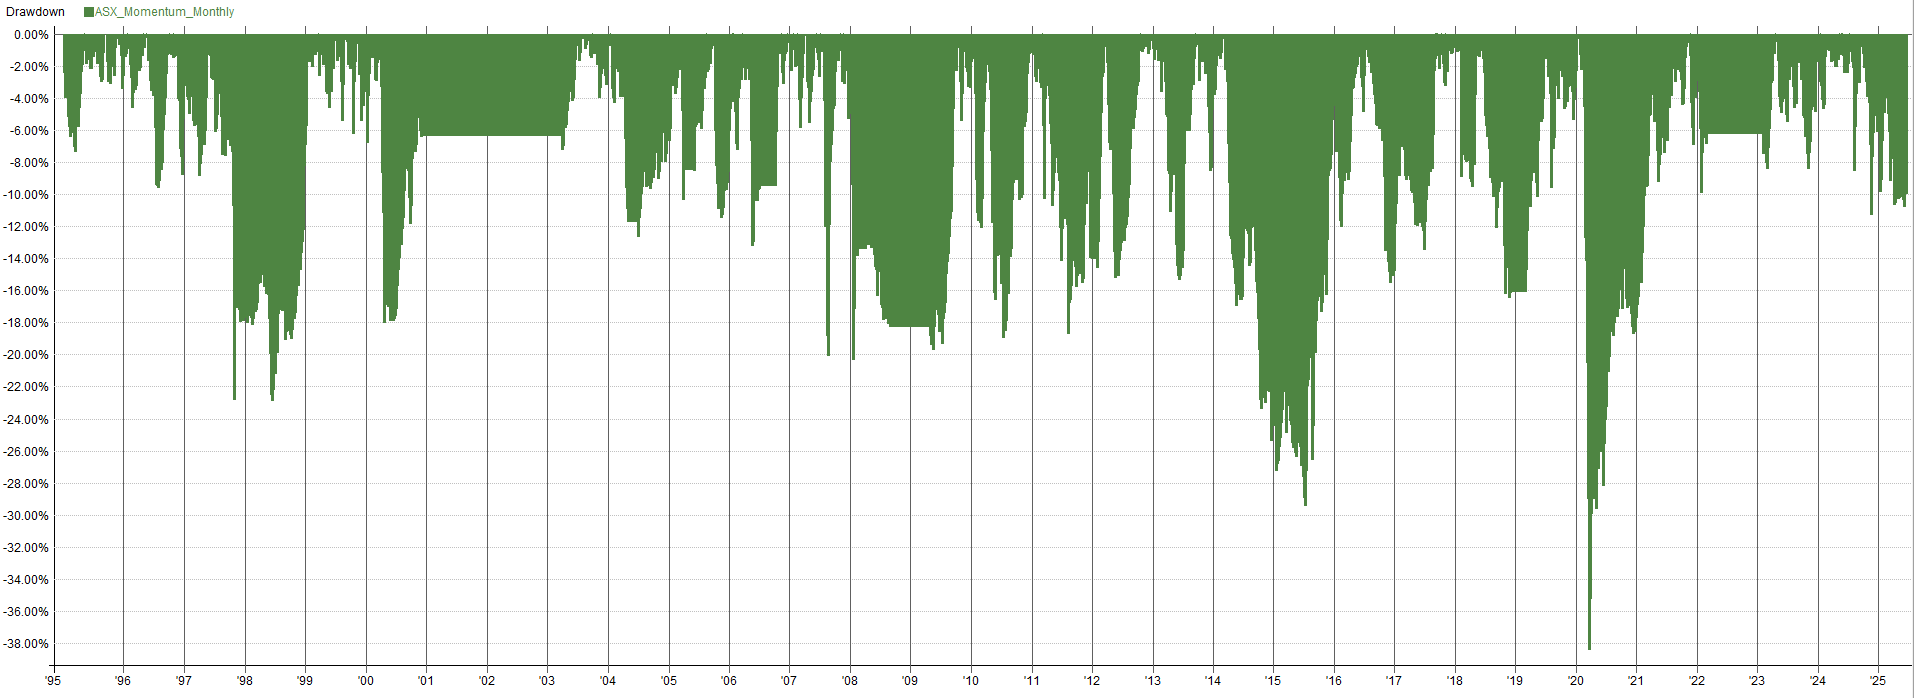
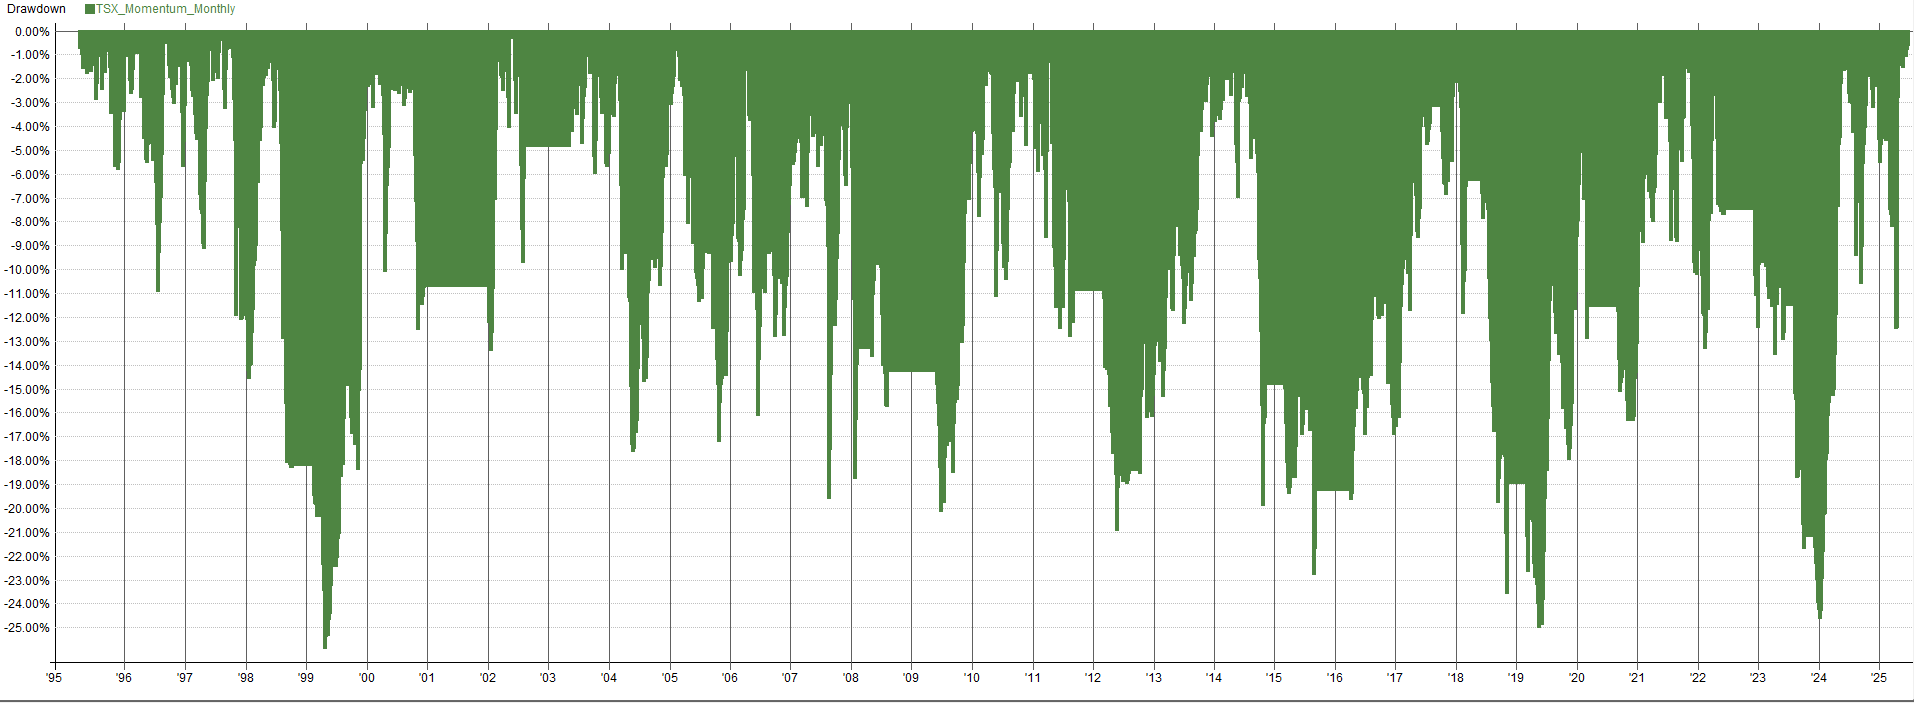
Applying this momentum system to any individual market yields decent performance, but the performance is not sufficient enough for our hypothetical systematic trader. Each market’s equity curve has flaws—drawdowns, flat spots, volatility, etc.
But, when we apply the same system across multiple different markets simultaneously, the portfolio level performance improves dramatically. Check out the mini-portfolio below of this momentum system applied to the Nasdaq 100, ASX, and TSX markets. The total combined performance of the mini-portfolio is shown by the dark blue line.
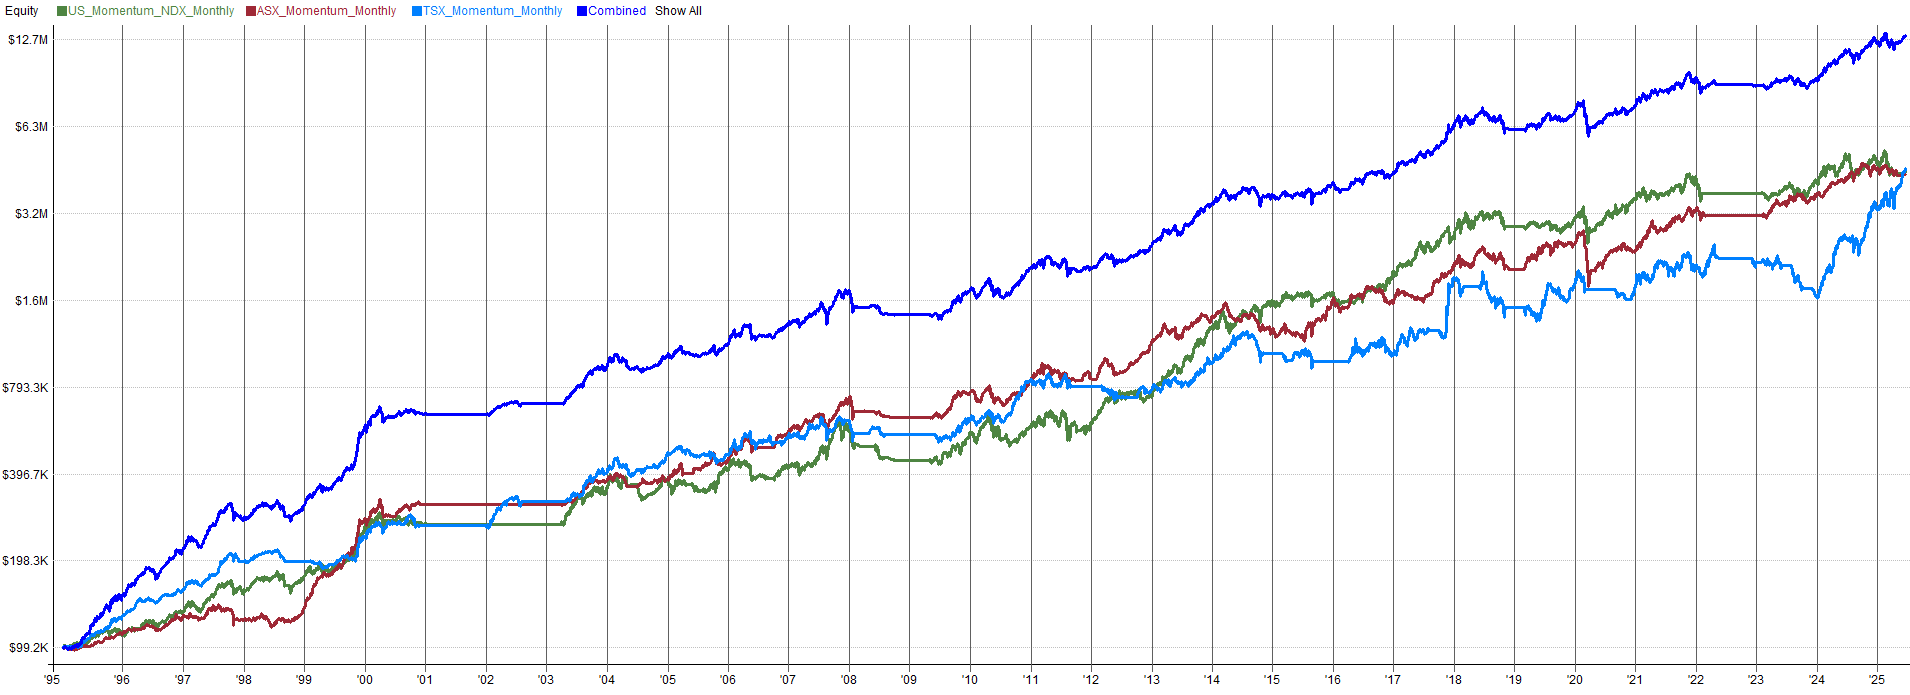

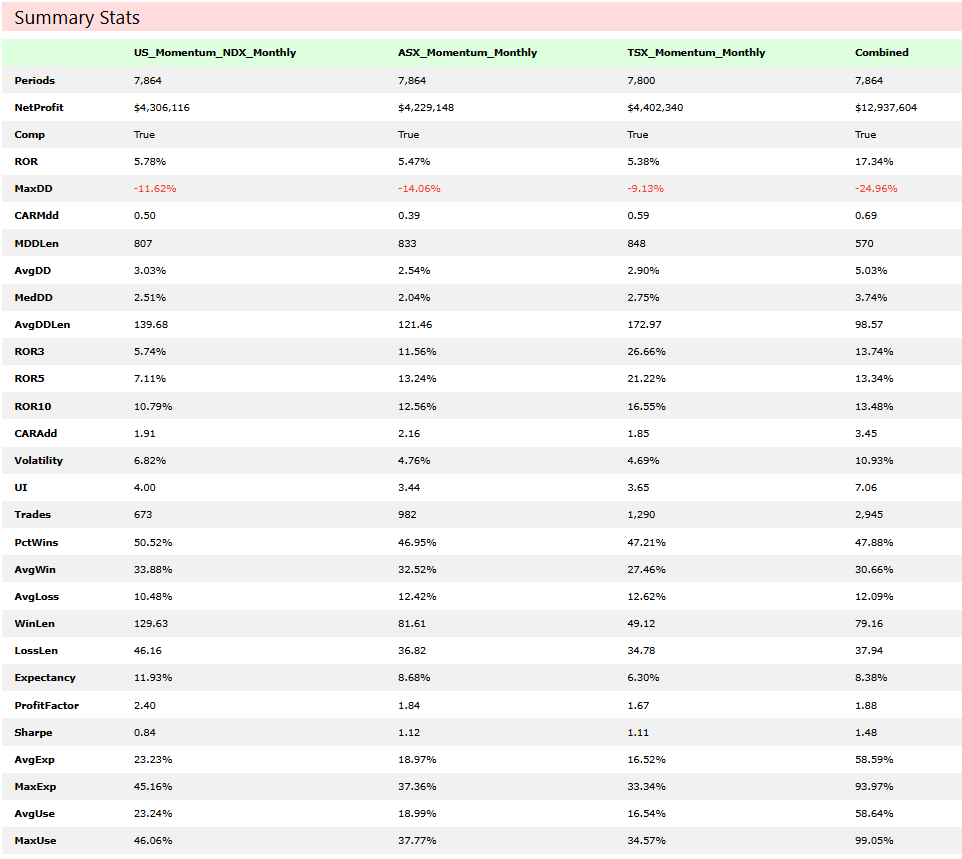
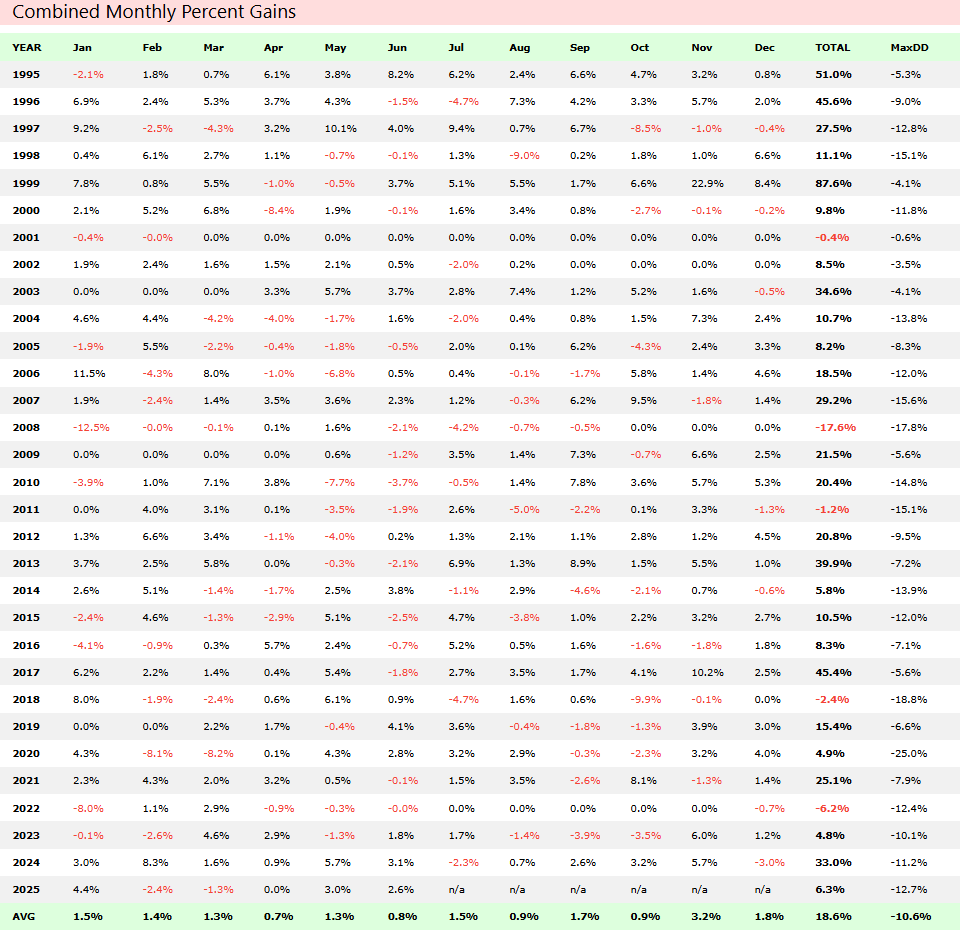
Wow, those results at the portfolio level look pretty good! The mini-portfolio’s performance stats that are important to our hypothetical trader are summarized below:
CAGR: 17.34%
Max Drawdown: 24.96%
Max Drawdown Length: 570 days
Sharpe: 1.48
Volatility: 10.93%
With minimal effort, this mini-portfolio meets our hypothetical trader’s goals. All we did was apply portfolio-level thinking and trade the system across multiple markets. The system the trader nearly discarded now shows tremendous promise and looks exciting to trade!
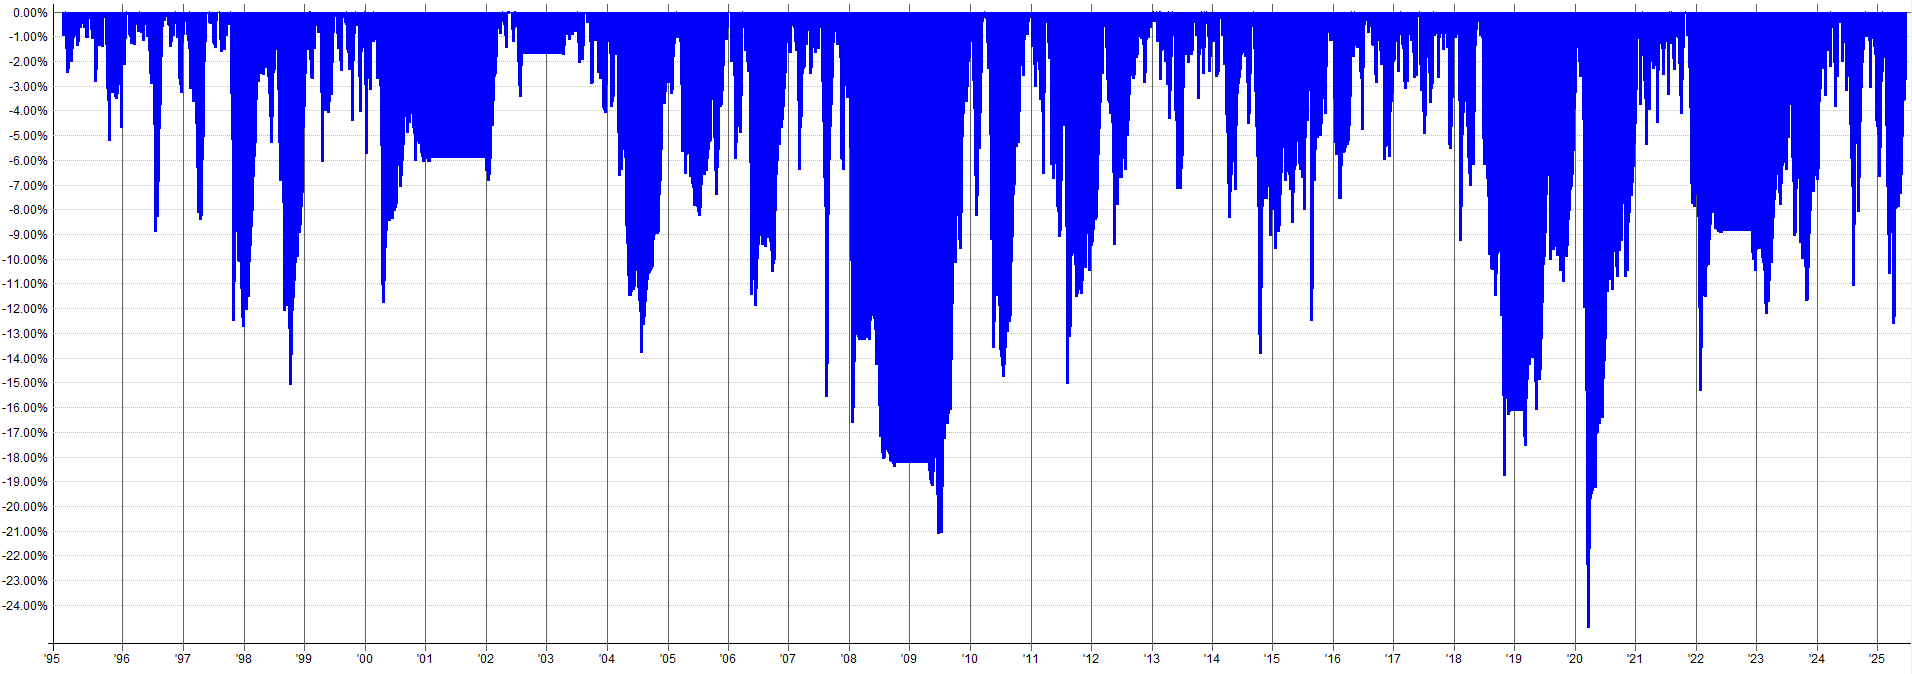
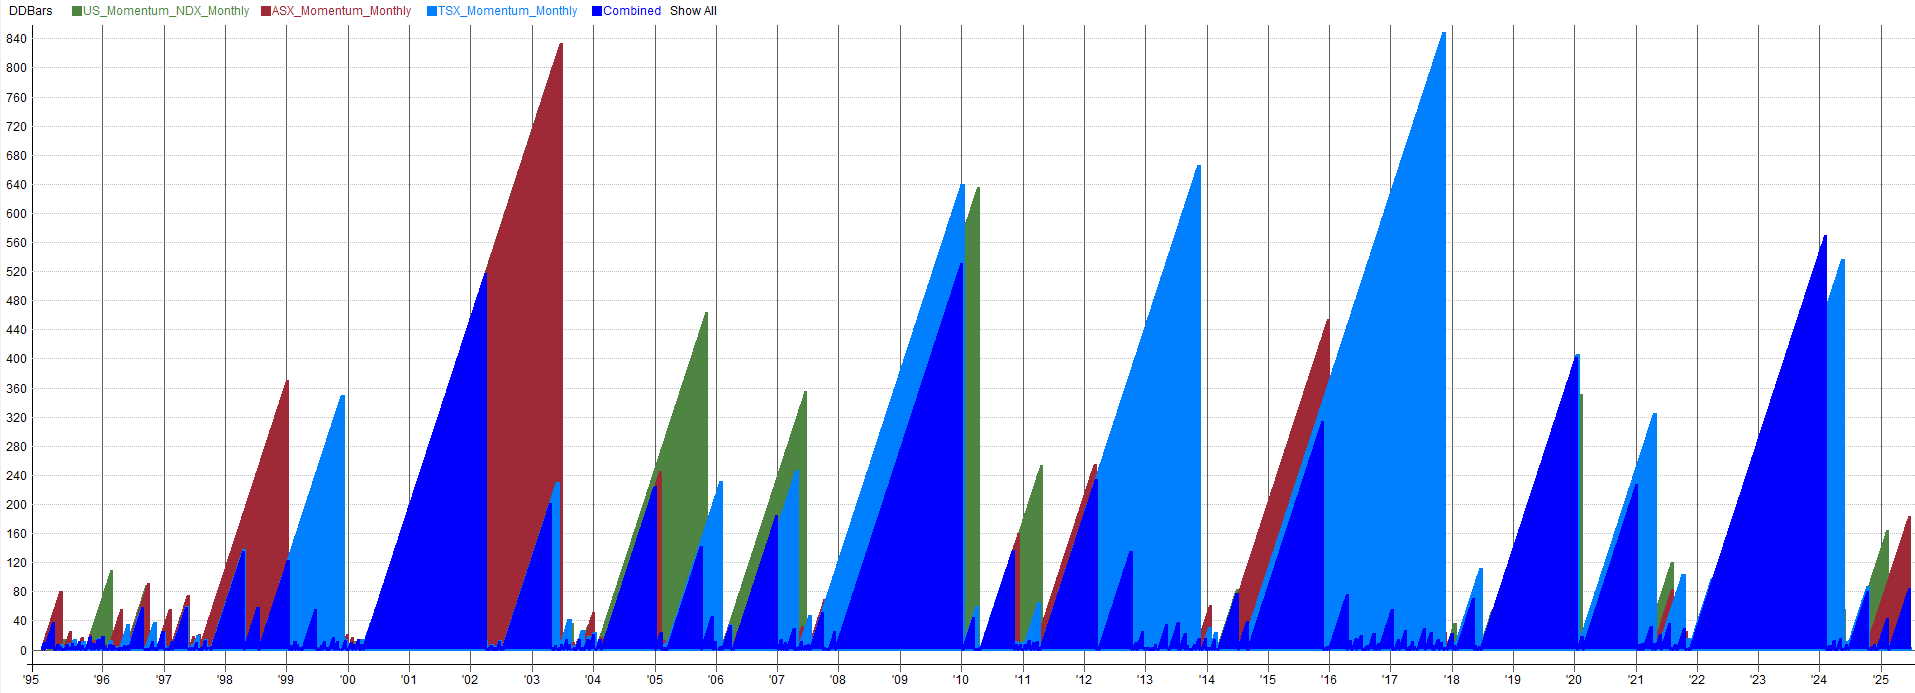
Check out the plot below showing the length of drawdowns over time. The dark blue is the drawdown length of the combined portfolio level result, the other colors correspond to the drawdown of a singular system on an individual market. You’ll notice how the portfolio level result has much shorter drawdowns over time, even when some of the individual systems have significantly longer drawdowns; showing the power of portfolio level thinking and application.
You can see more system level and combined portfolio level stats below.
In the set of equity curves above, you’ll notice periods where the system on one market generates significant profits while others decline or trade sideways, smoothing the entire portfolio’s returns. This is key to keep in mind when developing a portfolio.
We shouldn’t discard a system just because it’s imperfect on its own. Three average-looking equity curves combined into a mini-portfolio will likely deliver better performance results and greater robustness than that singular “holy grail” trading system you’ve been overfitting for months to create a perfect backtest 🧐.
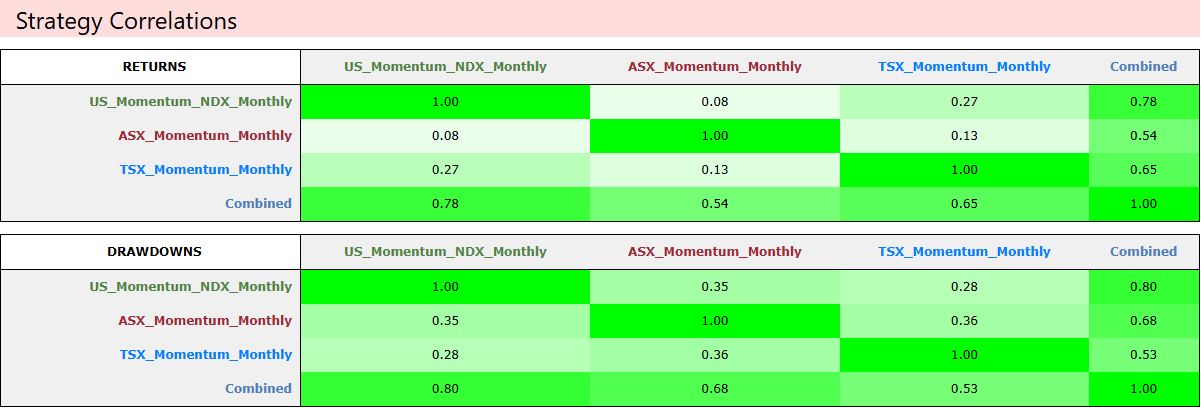
You can see how even though the strategy is the same, applying it to different markets yields diversification. You’ll notice both the correlations of returns and correlation of drawdowns are 0.36 or below when comparing the strategy on three different markets to each other.
Applying one trading system to multiple markets not only aligns with portfolio-level thinking but also complements my Luck by Design article series. If you missed it, check it out via the link below. The topic is closely related to portfolio-level thinking and will help reinforce this concept:
Luck By Design - Part 1

Luck exists everywhere. Whether you narrowly avoid hitting the pothole in the road because you saw it and swerved at the last second, or you drop your phone over the toilet but happen to snag it out of mid-air, avoiding catastrophe. There is a massive component of luck in life. You can do everything wrong yet things can still work out because you got lucky, or you can do everything right and everything turns out unlucky...
As a side note, this system trades only equities from a long-side momentum perspective, so during past and future events like 2008, correlations tend to spike to 1. However, 90% of the time, we benefit from some degree of non-correlation between different stock markets. We can address periods of high correlation by incorporating a system that profits in 2008-like environments.
This example is intentionally simple and straightforward to illustrate the power of portfolio-level thinking. If applying the same trading system to multiple stock markets yields significantly better performance, imagine the results when we add other non-correlated trading systems. The portfolio’s performance could be exceptional!
Conclusion:
In this article, we took a simple momentum system with decent performance and enhanced it through portfolio-level thinking. We applied the same system to different stock markets to improve portfolio-level stats, meeting our hypothetical trader’s goals. Instead of curve-fitting and over-optimizing to improve the backtest, we used robust principles to enhance the system’s performance.
Understanding portfolio-level thinking is a crucial skill to grasp before building a systematic trading portfolio. It helps us recognize that no single system is perfect, preventing us from discarding perfectly viable systems just because they aren’t flawless. Focus on the portfolio when setting performance objectives for your systematic trading, not the individual system.
Keep an open mind to this concept—you may be pleasantly surprised by where your portfolio ends up when all is said and done.
Now, let’s get into the portfolio development series. In the following articles, we will develop a set of trading systems, focusing on robustness and good development techniques. Then we will combine the systems into a portfolio, getting the benefits of portfolio level results. The final product should be super interesting, so stay tuned for the following articles!
Do you have ideas/suggestions for future articles? Let me know what you want to read about by clicking the button below and submitting your suggestions. Your suggestions are greatly appreciated as they help tailor this newsletter to what you want to read about.
Nice post, thanks. What are the universes for the ASX and TSX tests? XTO, XKO, TSX60, TSX Composite etc... or all ASX, All TSX? Thanks
Wonderful , this is where I am right now , a number of single systems , attempting to create a portfolio . Thanks for taking the time and effort to put this together
cheers michael b