

Market Effect Research: Holiday Seasonality
Does the holiday effect in markets actually exist?


Welcome to the “Systematic Trading with TradeQuantiX” newsletter, your go-to resource for all things systematic trading. This publication will equip you with a complete toolkit to support your systematic trading journey, sent straight to your inbox. Remember, it’s more than just another newsletter; it’s everything you need to be a successful systematic trader.
Introduction:
You may have heard of the holiday effect in markets. It’s the idea that leading into federal holidays, the markets tend to rally. This had me wondering if this effect is real and, if so, whether it can be captured.
I mentioned in a note that 2026 is the year of researching “small” and “dumb” edges. Things that I can quantify and prove to myself have a very high likelihood of existing. Ideas that are different from the traditional trend and momentum type systems I trade a lot of and which we have explored in previous articles.
I figure if I can research and implement many of these different edges, it will provide a unique and non-correlated return stream to my other trend and momentum systems.
Not only does this diversify my portfolio return streams, but the more unique strategies I add to my portfolio, the more I reduce and spread the risk of individual strategy failure. Having two strategies and having one fail would suck. Having 50 strategies and having 4 or 5 fail would hardly even leave a mark.
Hence, researching market effects, like the holiday effect, and seeing if it’s something that can be exploited seems like the perfect “small” and “dumb” edge to help build up a fortress of trading strategies to diversify my portfolio return streams.
Let’s get into it.
Reason For The Effect:
The question we need to answer is:
“Okay, allegedly the holiday effect exists, but why would something like that exist in the markets? Is there a good reason for this effect to exist or is it likely a data-mined myth?”
We can attempt to answer the “why this effect might exist” through reasoning (but we can never actually know the true answer). A few decent reasons why this effect might exist would be the following:
Good Sentiment:
Holidays simply make people happy, more optimistic, and less focused on work. When people are optimistic, they may be less averse to risk. This “holiday spirit” or euphoria may lead investors to buy stocks (or at least avoid selling), pushing prices higher. Happy investors process information less critically and expect better future outcomes. Studies often cite this as the dominant explanation, with investors in a good mood being reluctant to sell or potentially more willing to hold/buy.
Lower Trading Volume and Liquidity:
Many traders, including institutional ones, reduce activity or go on vacation before holidays, leading to thinner markets. Lower liquidity can amplify price moves in either direction. Combined with good sentiment from happy investors, it could result in temporary upward drifts.
Price-insensitive buying during less liquid markets would be a good reason for an effect to exist. When investors/traders are buying or selling regardless of price, that leads to inefficiencies that we can exploit.
While these seem reasonable and plausible, we will never know for sure what the true reason(s) for the effect are. That’s just the markets, they’re opaque. But the good news is we at least have a decent educated guess at the causes.
The reason understanding the likely causes is important is because if there were no reasons why we would think this effect would exist, it would be harder for me to trade such an effect. This is because I would fear it was just a data-mined result. Also, if the effect went away in the future and I didn’t understand the cause of the effect, I wouldn’t be able to assess whether the causes had changed to understand if the idea was actually dead or not.
There could be times when an effect like this temporarily underperforms. When that happens, if I understand the effect I can ask myself whether I see a reason for the cause of the effect to have changed. If so, I can reason the effect is dead. If I can’t see a reason for the cause of the effect to have changed, then I’d continue to trade the system, expecting the underperformance to revert soon.
The part of the question about data-mining we cannot answer yet. The rest of the article will be used to answer that question through a bunch of analysis. And, if we are lucky, we’ll end up with a trading system to harness the holiday effect.
Research Phase:
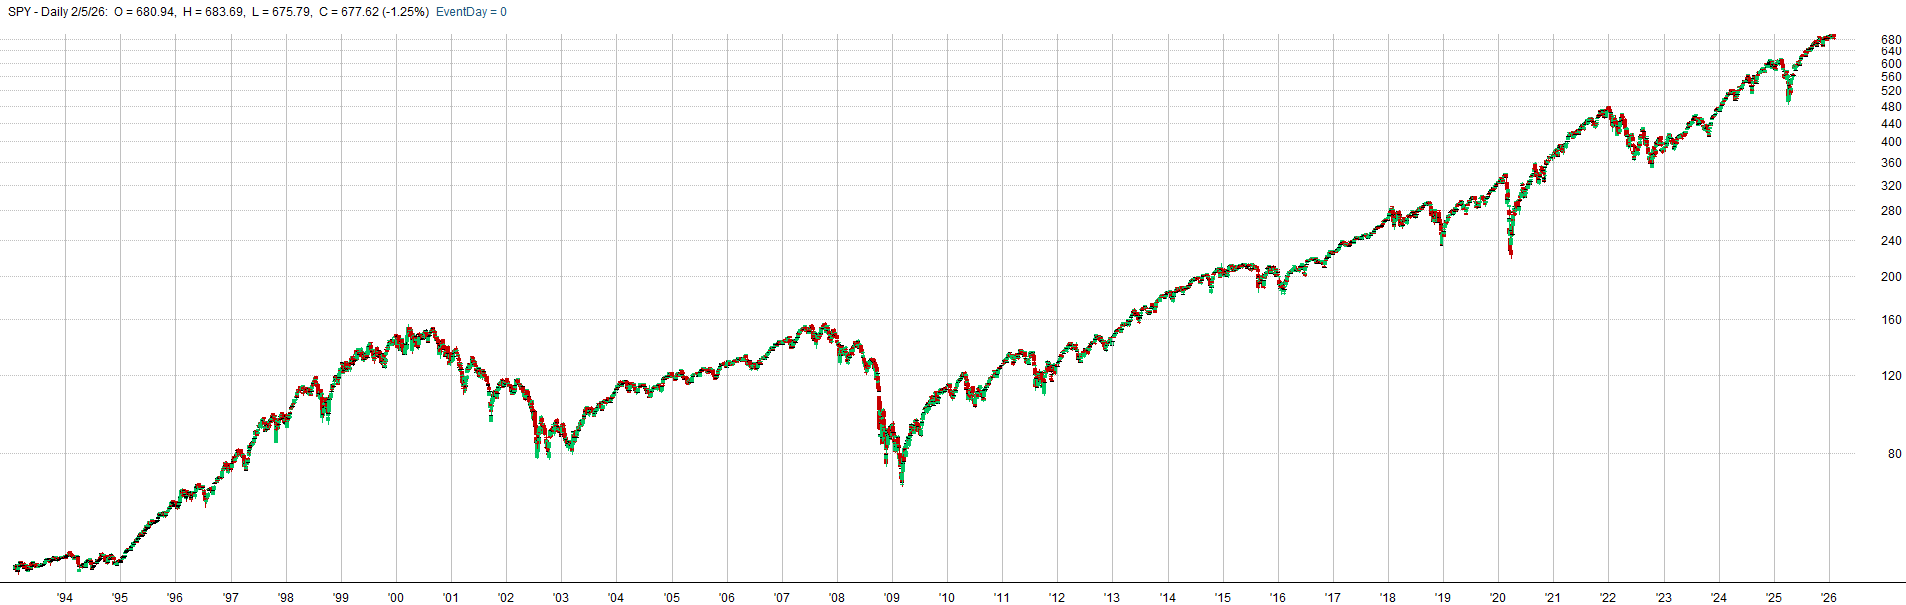
Let’s kick off the analysis of this potential market effect by understanding the baseline returns from the S&P 500 SPY ETF. On average, the S&P 500 has an upward drift. I don’t think there is an argument against that.
Knowing what the average upward drift gives us a threshold for understanding whether the holiday effect has returns above average market returns, or not. If the holiday effect is real, I would expect to see that the returns during the days leading up to the holiday are higher than the average market return.
Below is a scatter plot of close-to-close SPY returns. Grey dots are daily close-to-close observations. The orange line is the average daily SPY return.
Average SPY Daily Gain/Loss (1993 to 2026):
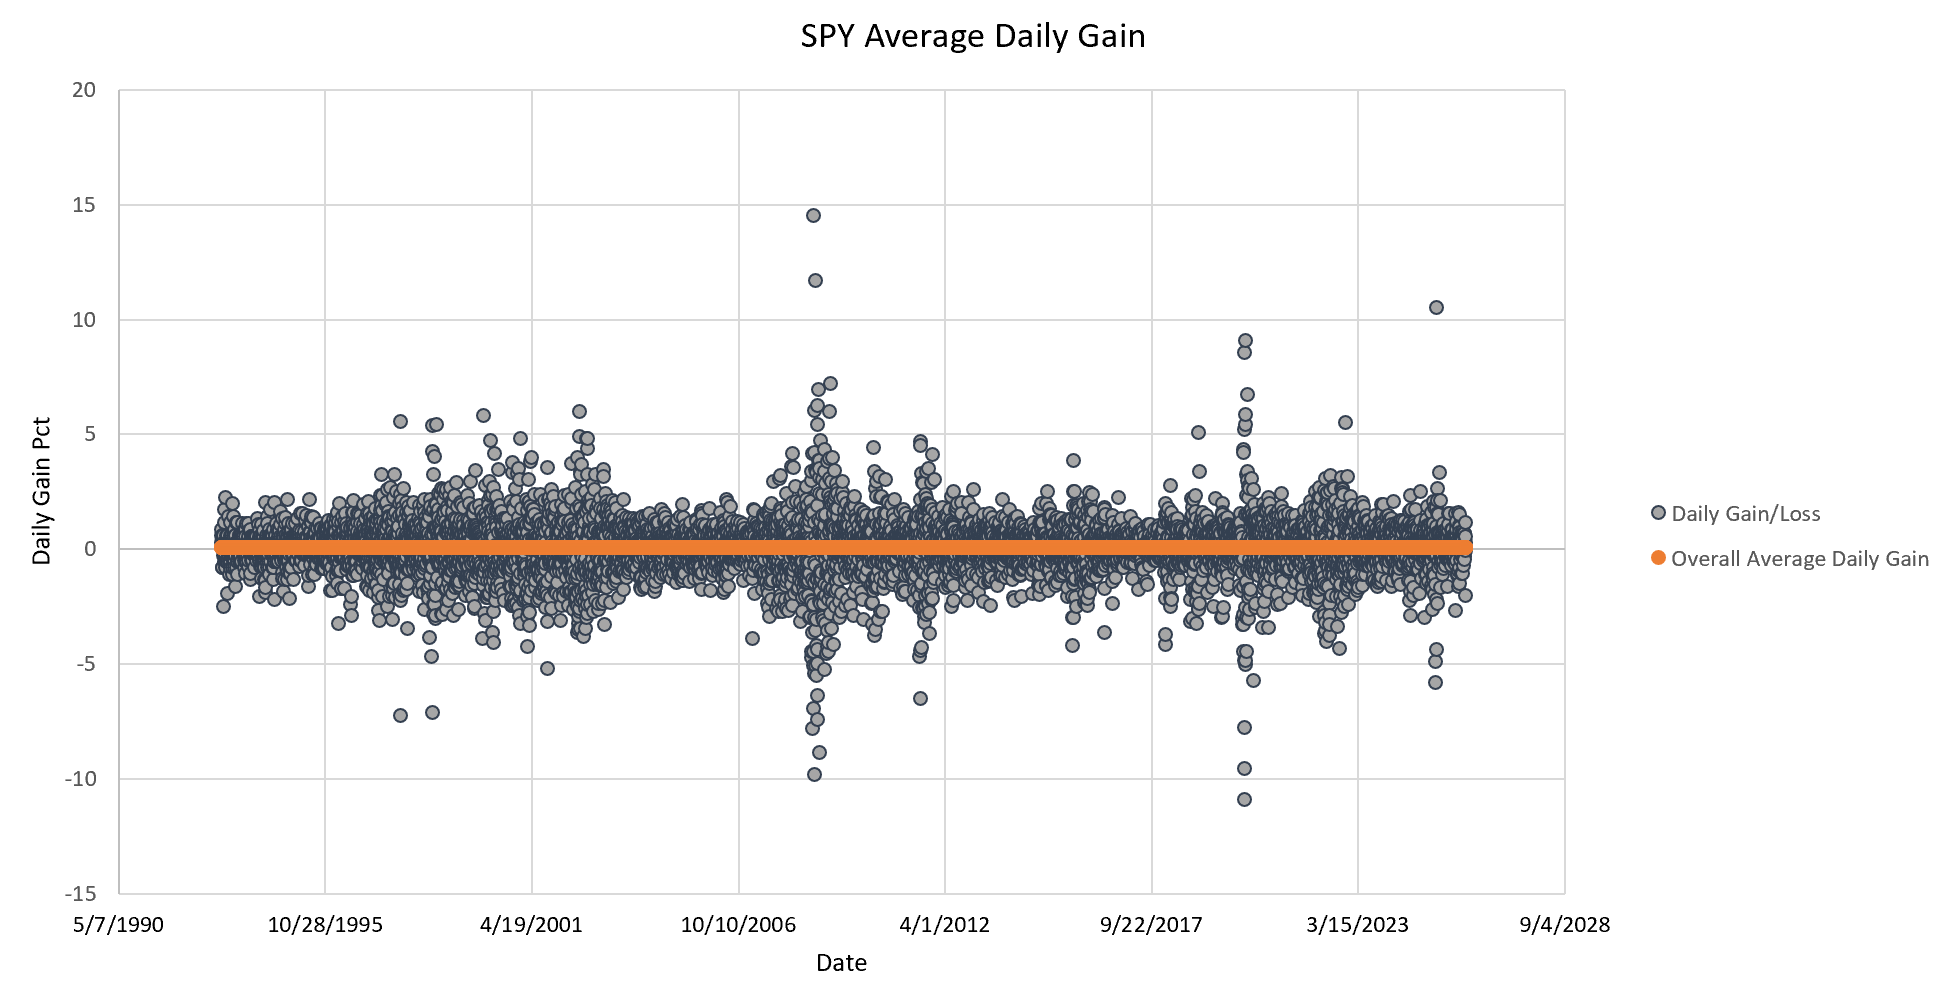
The scatter plot shows the daily return can vary a lot, but on average is positive expectancy. The average SPY close-to-close daily gain is: 0.03998% (from 1993 to 2026).
This value makes sense. The SPY returns on average ~10% a year and if I multiply 0.03998% by 252 trading days a year I get 10.07%. Said differently, I could have just divided the SPY average return per year by the number of market trading days per year and found the same result.
Therefore, 0.03998% (or 0.04% for simplicity) is our line in the sand. Any return less than or equal to 0.04% per day is just market beta. But if we can find a consistent and repeatable effect with a return greater than 0.04% per day, well that’s alpha (or at least that’s how we will define it for these purposes).
Okay, we determined a threshold to use to define market beta vs. alpha. Now let’s see if we can measure the holiday effect to see whether it has a repeatable and consistent return above the market average.
To do this, I had to gather the dates of every federal holiday since 1993 (which is when my SPY ETF data starts). I considered all US federal holidays:
New Year’s Day
Martin Luther King Jr. Day
Presidents Day
Memorial Day
Juneteenth National Independence Day
Independence Day
Labor Day
Columbus Day
Veterans Day
Thanksgiving Day
Christmas Day
I then looked at the market returns leading up to these holidays. I did this measurement in a couple different ways. The first way is shown below, where I measured the market return 5, 7, 9, 11, 13, 15, 17, 19, 21, and 25 days before a holiday. This would simply measure:
“If I bought x days before every holiday, and then sold on the close of the last trading day before the holiday, what returns would I see on average?”
I measured the returns for every holiday, buying x days before the holiday and selling at the close on the last market day before the holiday. I then averaged all of the results together to understand the average return.
I also repeated this same process but instead of buying before holidays, I instead measured the average result of buying SPY during random periods of time; holding for x days, then selling. This is like our benchmark for this type of measurement. If the holiday effect is real, I would expect to see outperformance from buy x days before a holiday compared to the returns of randomly buying SPY for the same length of time.
Average Return Leading Up To A Federal Holiday vs. Average Market Return (1993 to 2026):
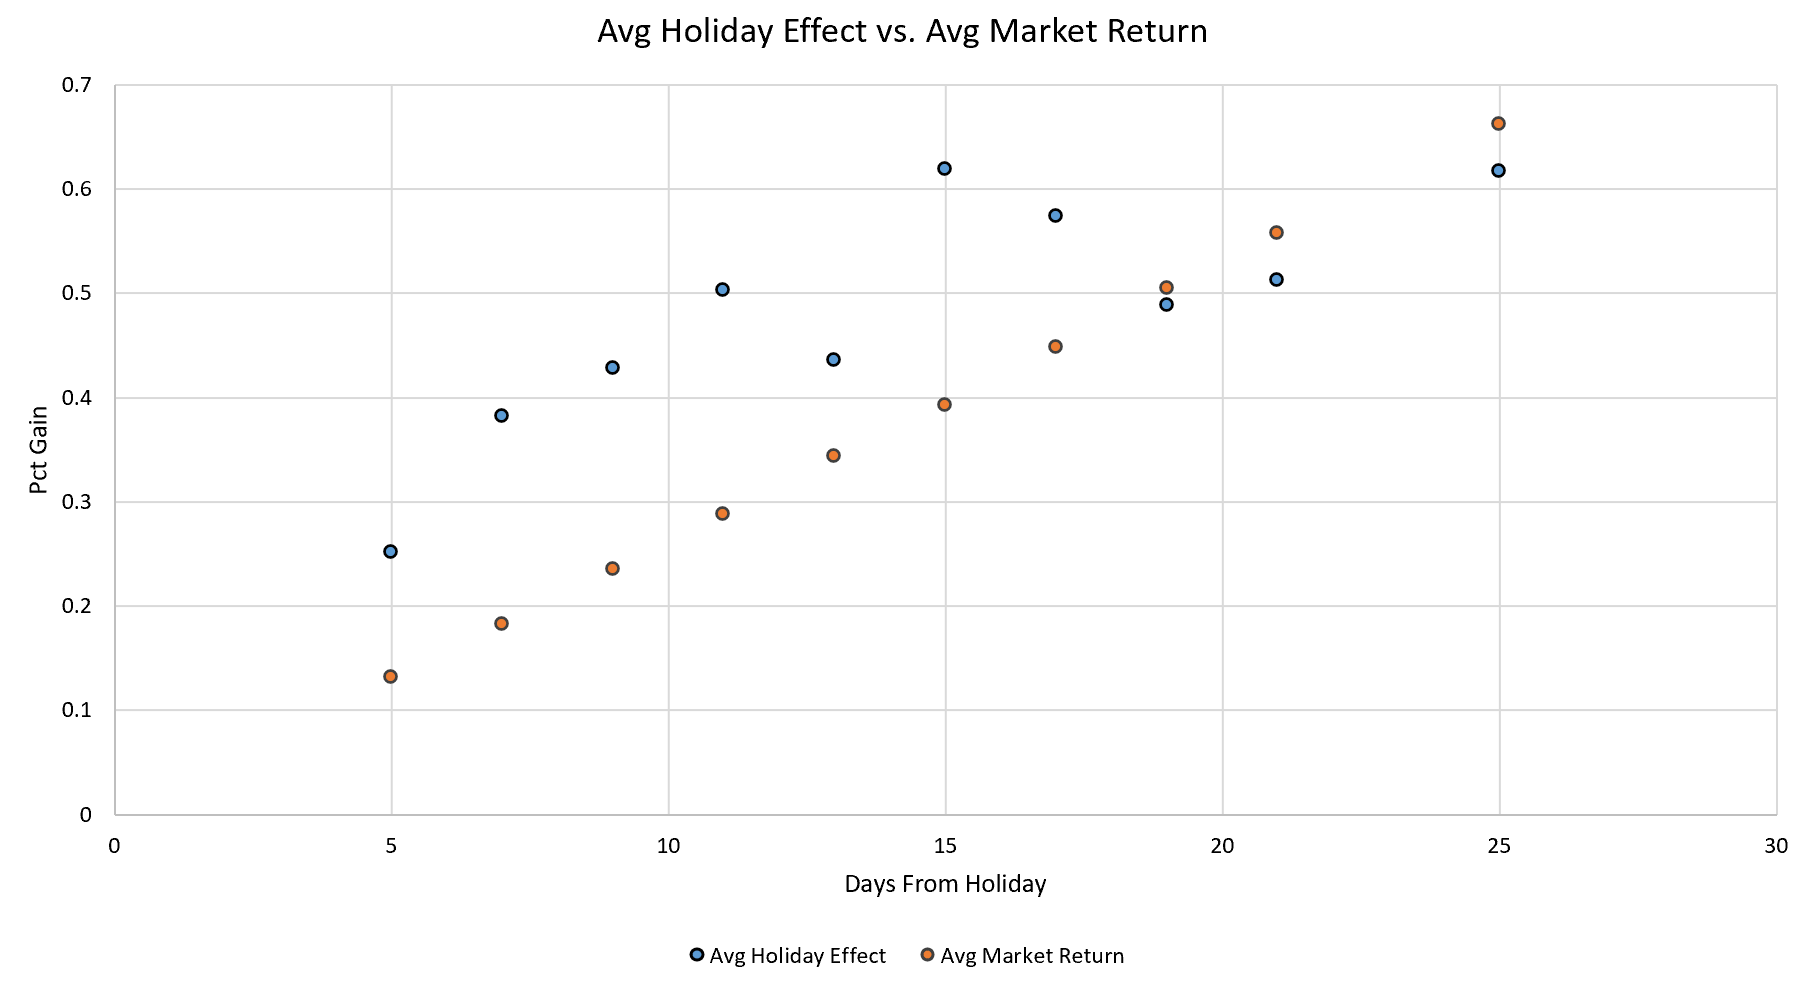
The blue dots show the average percent gain from buying x days before a federal holiday. The orange dots show the average returns of the SPY if you randomly bought and held for the same length of time.
You’ll notice that buying before holidays appears to have almost 2x the returns as the average market return. Or at least this is true from 5 days out to 17 days out from the holiday. Measuring from 19+ days out from the holiday, the returns seem to collapse back to the average market return.
This result tells us two things:
The holiday effect is showing very promising potential right from the start. Buying SPY leading up to a holiday seems like it may be a decent idea.
Buying closer to the holiday, within about 15 days or so, is better than buying further away from the holiday.
The chart above shows the average return for each set of days away from the holiday. But we can decompose that information further to better understand what’s going on beneath the surface.
I decided to look at the average returns for each day leading up to the holiday, decomposing down to the day-by-day returns. I measured this from 20 days out all the way to 1 day out from the holiday date. What this entailed was measuring the market returns of day 20 before a holiday, day 19, day 18 etc. I did this for all holidays and then averaged the result to understand the average return for each day leading into a holiday.
This will tell us exactly what drives the holiday effect. Is the effect solely driven by the returns of SPY the day before the holiday? Or maybe all of the alpha resided between days 3 and 7, for example.
Decomposing down to the day-by-day returns will help inform us of exactly where the effect resides.
The bar plot below shows exactly this. It shows the average SPY return from 20 days out to 1 day out from each federal holiday from 1993 to 2026.
Day-To-Day Returns Leading Up To A Federal Holiday (1993 to 2026):
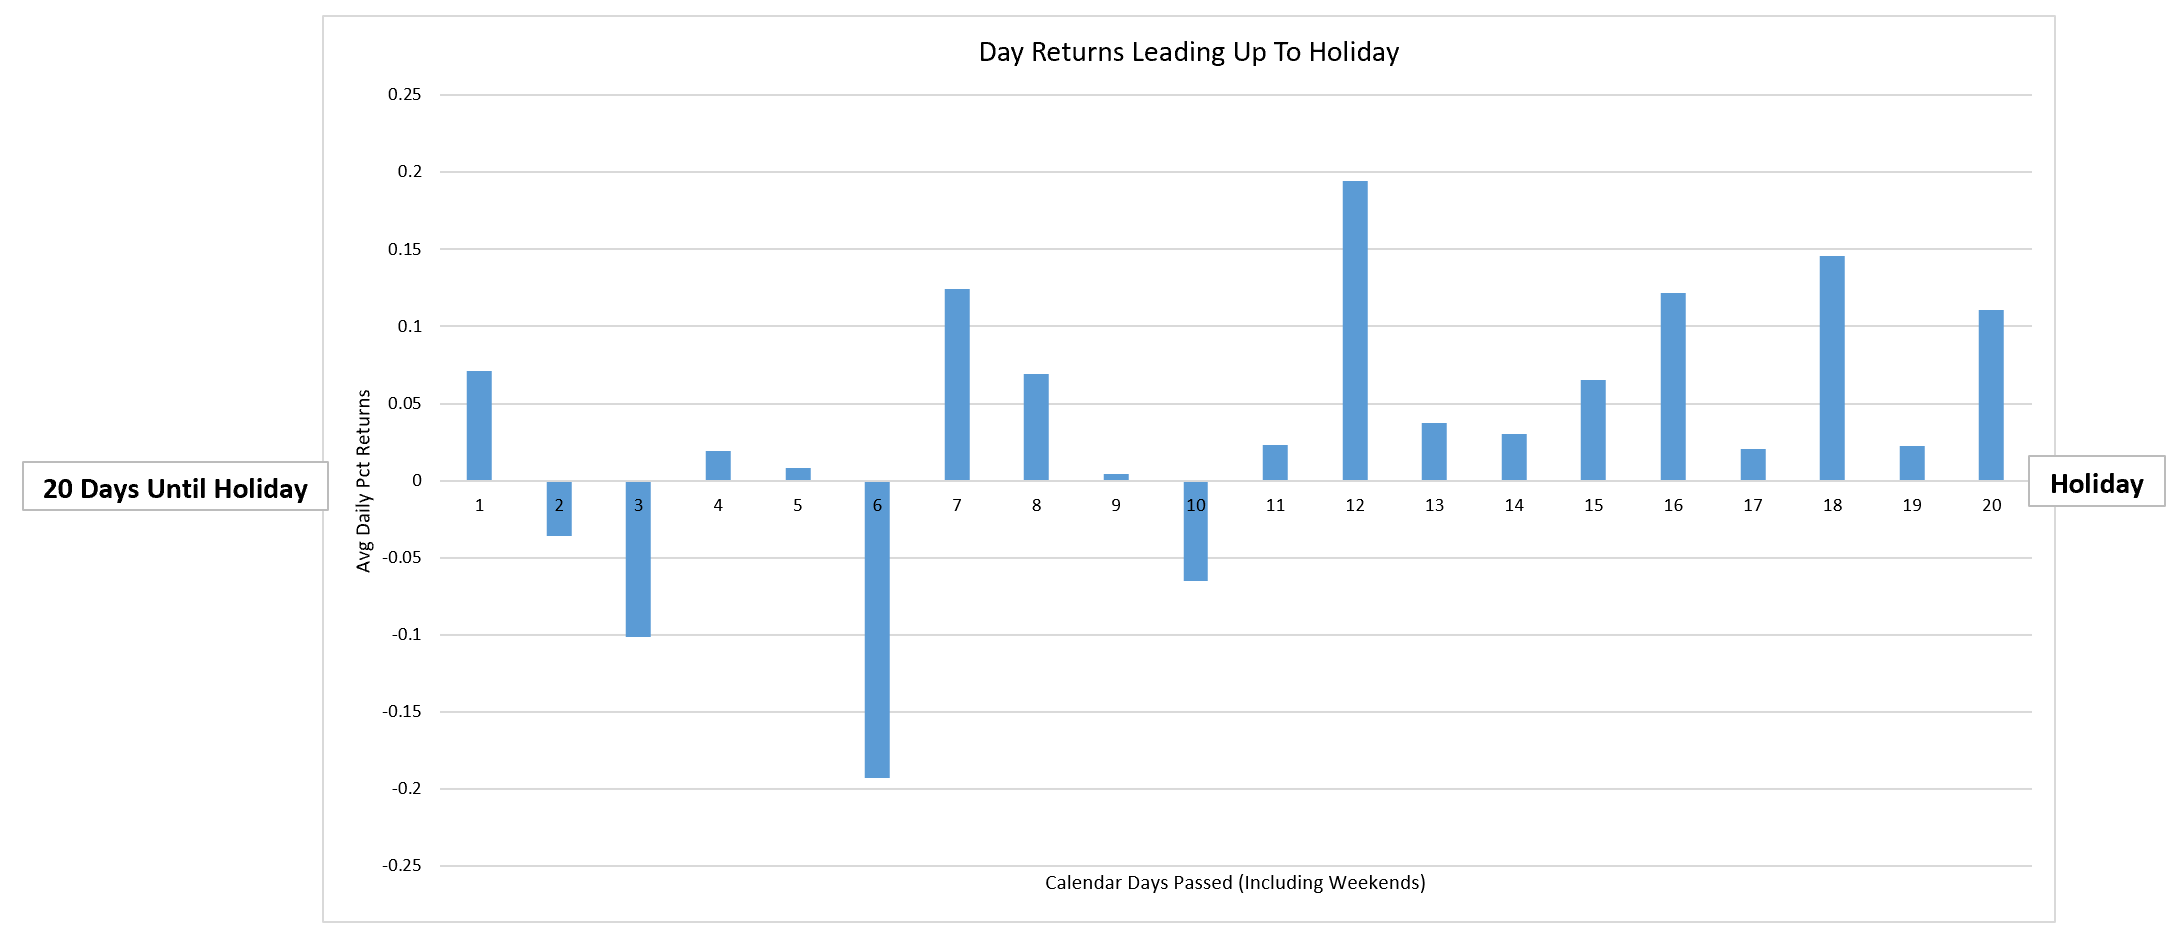
The left side of the bar plot shows the average SPY return 20 calendar days away from a federal holiday; the right side shows the average SPY return for 1 calendar day before a federal holiday. You’ll notice the left half of the plot (further from the holiday) looks noisy and unpredictable with random up and down days on average. But the right side of the plot (closer to the holiday) from calendar day ~11 right up until 1 calendar day before the holiday looks consistently positive.
This is exactly what we want to see. Long before a holiday the results look like average market noise. But as we get closer and closer to the holiday, the market returns start to look much more predictably positive.