



Welcome to the “Systematic Trading with TradeQuantiX” newsletter, your go-to resource for all things systematic trading. This publication will equip you with a complete toolkit to support your systematic trading journey, sent straight to your inbox. Remember, it’s more than just another newsletter; it’s everything you need to be a successful systematic trader.
I recently launched a portfolio tracking website (updated daily) that tracks my systematic trading portfolio performance, along with many supporting metrics. You can check in on my personal systematic trading portfolio performance anytime here: TQX Portfolio Tracker
Introduction:
Up until now we have explored four small market effects, and developed five systems from those explorations. Each of the effects were researched to characterize what makes them a better or worse trade, and what features are stable over time.
None of these systems we developed as part of this series are amazing on their own. And nobody should go out of their way to allocate hard-earned portfolio capital to any individual system we have developed in this series. Any single edge simply does not have enough return to warrant the allocation.
But the whole purpose of this series was not to develop individual systems that are fantastic, and I never planned to run any one of these systems alone. I planned to run them all together in what I call a market effect mini-portfolio.
Combined together with the right allocation logic and the right framing, these five systems become a real return stream that compounds a little extra on top of whatever base system(s) you already run.
The goal of this market effect mini-portfolio is that when you throw it on top of a base portfolio of systems you already trade, the combined market effect mini-portfolio creates a small tilt that uses a little extra capital for short windows of extra exposure where the calendar and conditions say probabilities favor a particular direction.
I’ll recap what each of the systems looks like and then show you the combined results. I’ll also discuss how I would combine this market effect mini-portfolio on top of an existing portfolio.
I now trade all five of these systems within the market effect mini-portfolio as part of my overall live systematic trading portfolio. I am not pitching paper systems. These five systems capture an underlying market effect in a simple way, are stable over time, and still have enough edge left over after slippage and commissions. Let’s explore the systems and the result of combining these systems together.
Why Sophisticated Funds Leave These Effects Alone (and why that’s good for retail):
The natural first question you may have after reading that we have developed multiple systems capturing a market phenomenon is the objection:
“If these effects are real and have structural mechanisms, then why has a professional fund not absorbed all the return and arbitraged them away?”
That is the right question to be asking, and it’s a good question.
Long story short, these market effects are undesirable to a sophisticated trading fund. A couple of percentage points of standalone CAGR, paired with multiple days of directional exposure, few opportunities per year to complete the trade (sophisticated funds want to turn capital over as much as possible on positive expectancy opportunities), and the fact that these effects are noisy and don’t always play out probably doesn’t give much excitement to institutional capital.
They have the resources to find and capture much more sophisticated market phenomena with higher Sharpes, lower directional exposure, more opportunities, higher compounded returns, and shorter holding times. Because of that, they left these effects we’ve explored alone.
But that’s good for us because we get to pick up the scraps. As retail traders, we get to trade what’s been left behind by the big money.
And let me be clear, I am not a sophisticated player, and I’ve never been part of a fund. But from what I understand, if there is a semi-repeatable effect occurring in the markets that you can profit from, the professionals know about it already and have chosen not to touch it because something about that trade is undesirable.
And as a retail trader, we have to get comfortable with the undesirable, because we are like the mice picking up the scraps the sophisticated players don’t want.
To summarize specifically, here are some examples of what makes each of these trades undesirable to large players:
The trade opportunities do not happen often enough. Roughly 30 to 60 trade opportunities a year across five systems. That's pretty low-turnover. Sophisticated funds want to turn capital over many times faster than that. More turnover, more compounding.
The hold periods of these trades are too long. The holding period for Turnaround Tuesday is 1-2 days. For the Holiday effect it is a week. For the Turn of Month effect, it is 1-10 days. Institutions don’t want to hold directional exposure for that long.
The strategies hold market beta. The reason these systems work is because we pick up directional exposure. We aren't hedged. If we were, then these positive long-term returns from the effects would probably wash away. Institutional funds will generally try to reduce risk by trying to be more market neutral.
So the takeaway is not us claiming we found something the smart money missed. We are claiming we found something the smart money looked at and decided was not worth the operational load.
As retail, we take the scraps the big funds leave on the table. That is the reality of every small, persistent edge we retail traders find and trade.
This framing is also a useful sanity check you can apply to any other “edge” you come across in the future. If a person claims they are capturing a real market anomaly with a strategy that anyone can run with a standard brokerage account, the first question to ask is:
“Why has a fund not eaten this already?”
If their answer is something like:
“Because they are dumb”
Then run away.
If the answer is something that makes the trade undesirable, like:
Limited size capacity
Low trade turnover
Long holding periods
Lots of beta exposure
Then that is the kind of edge a retail trader can actually harvest.
Recap of the Five Systems:
Let me quickly refresh your memory on the results of each system before we combine them into the mini-portfolio.
We explored 4 market effects but ended up with five systems because the holiday effect on gasoline resulted in a surprise 2nd system that I wasn’t expecting after observing another persistent anomaly in the data.
Holiday Effect on Equities:
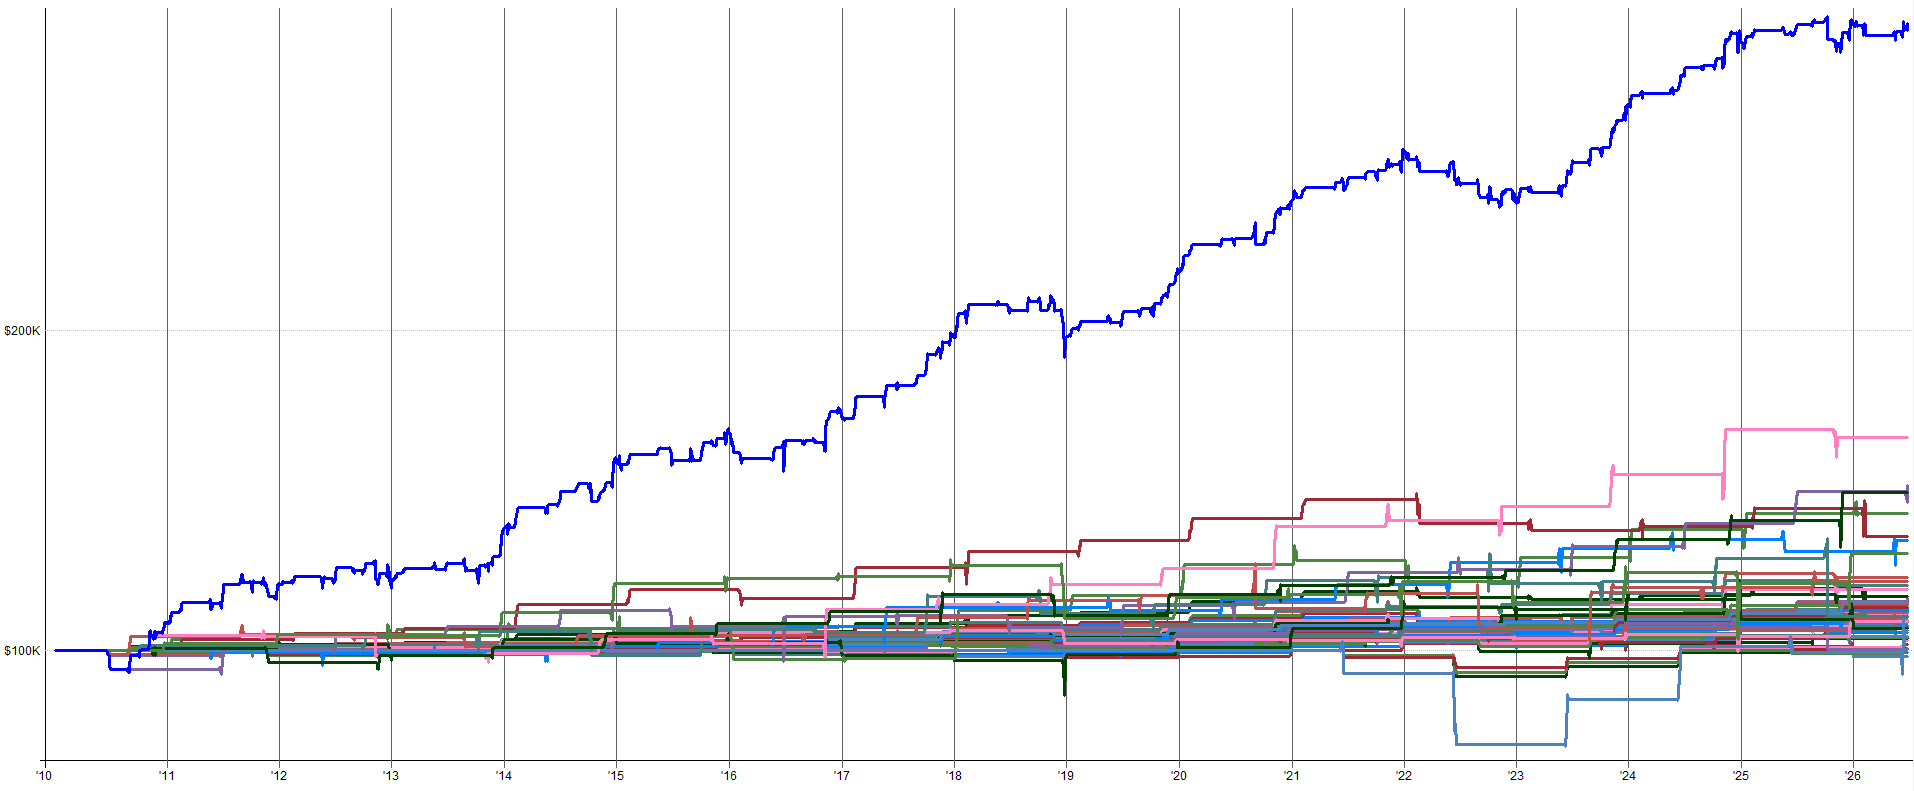
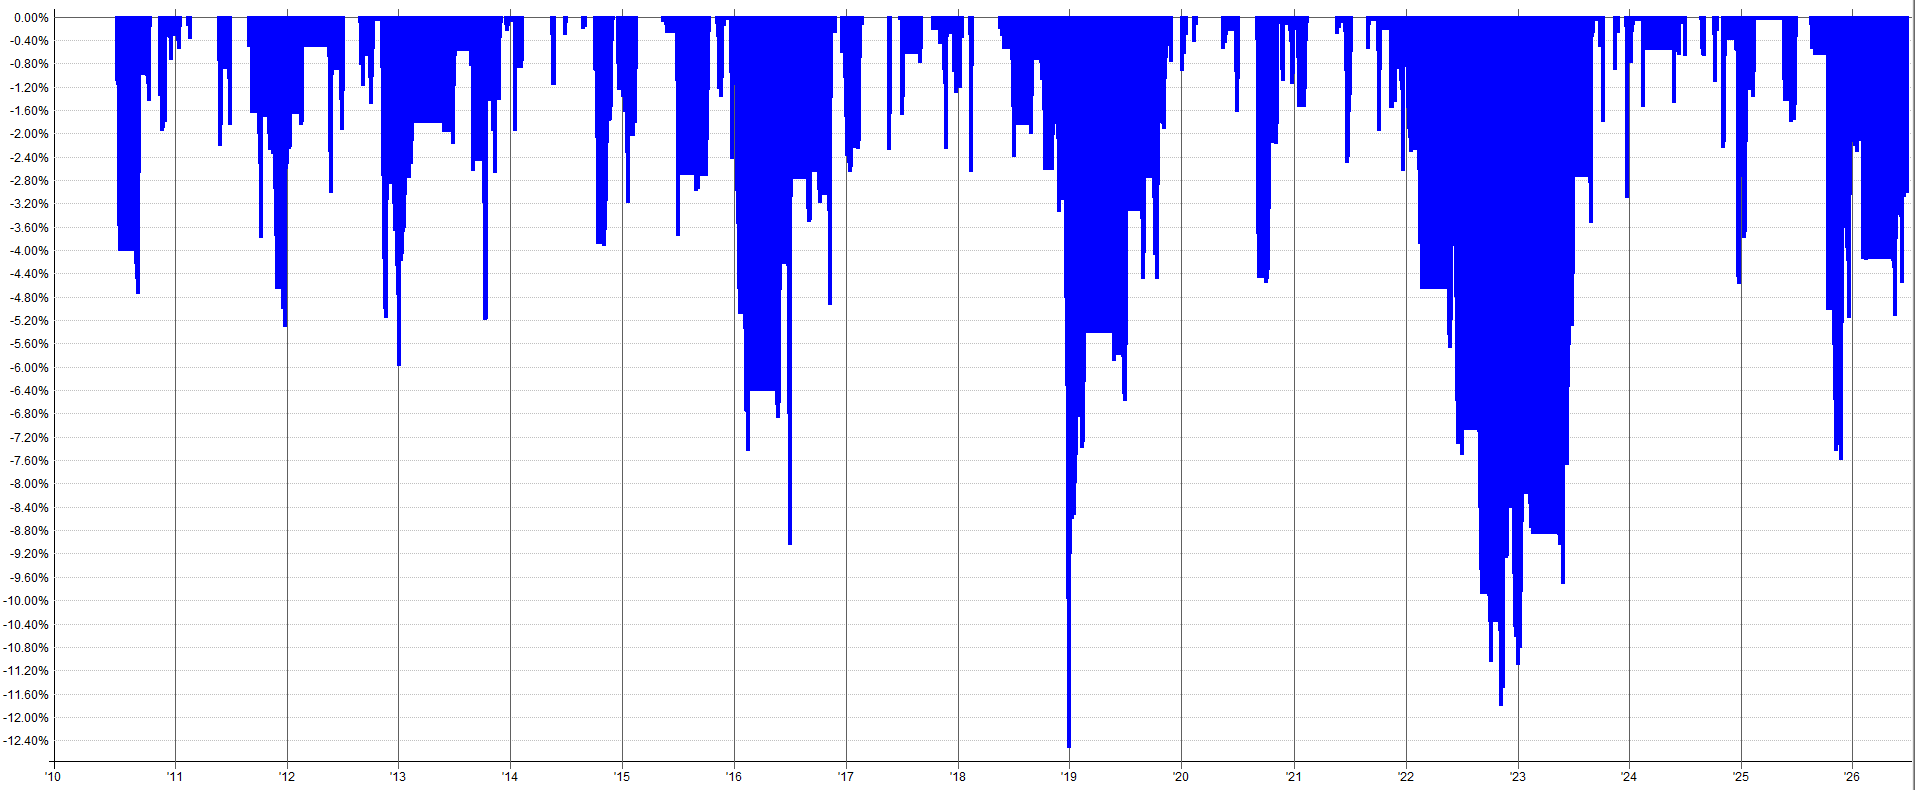
The resulting system for trading the holiday effect on equities is shown below. The dark blue line is the combined system equity curve result.
All of the lines below are the individual holiday results.
Some holidays work better than others, but we trade them all the same way and scale into the trade as the holiday nears.


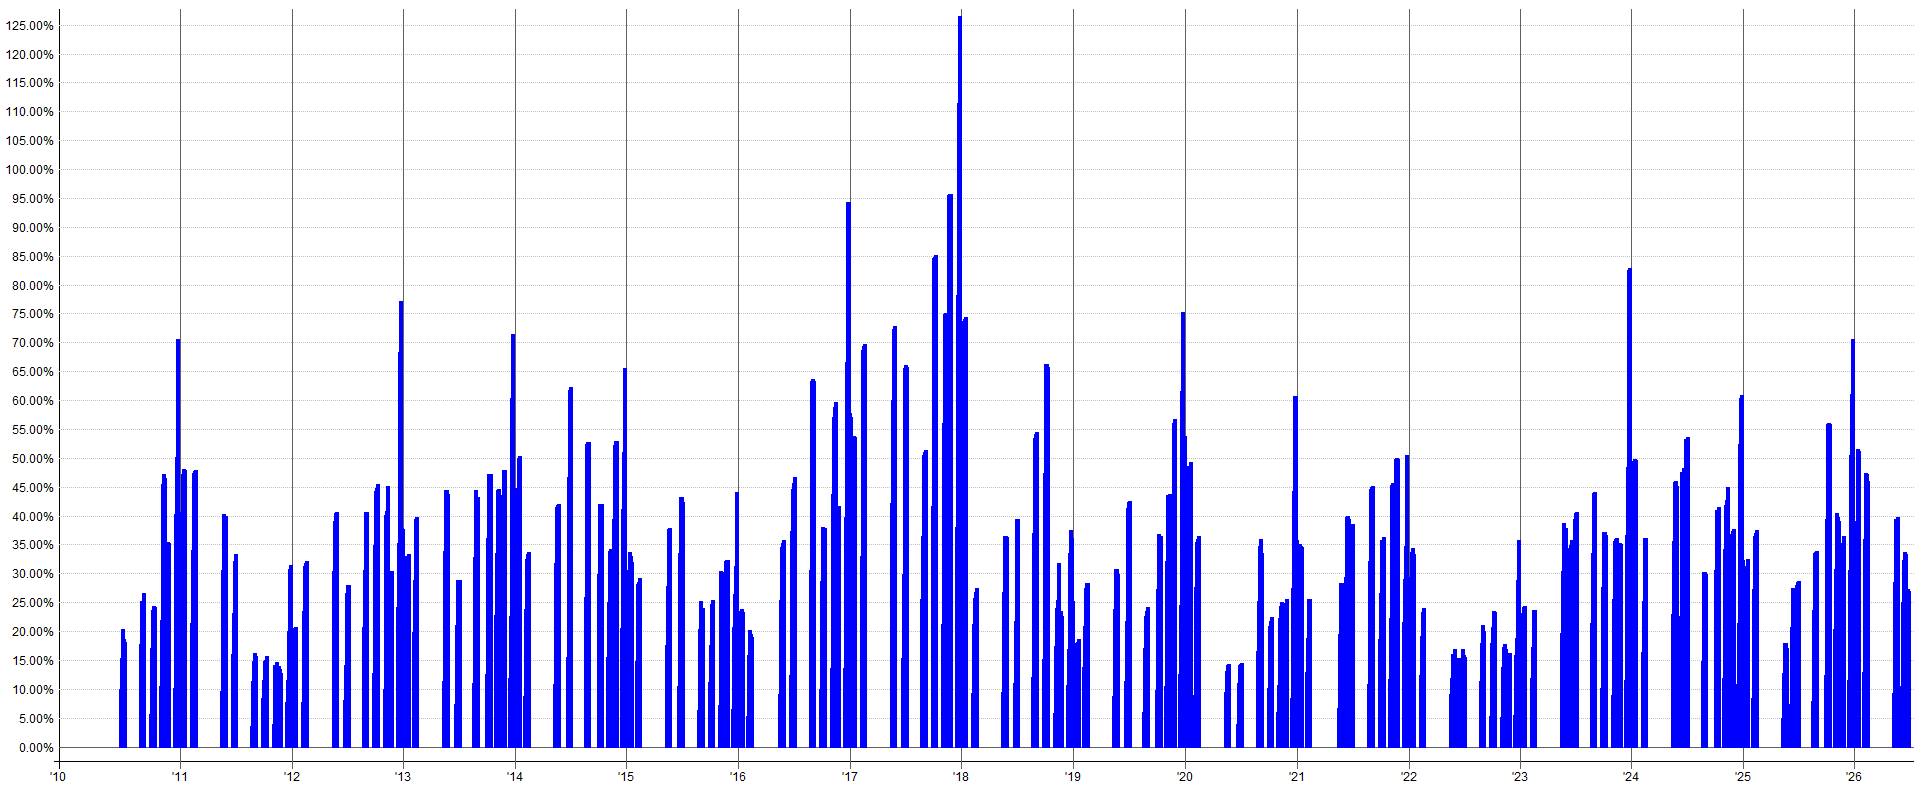
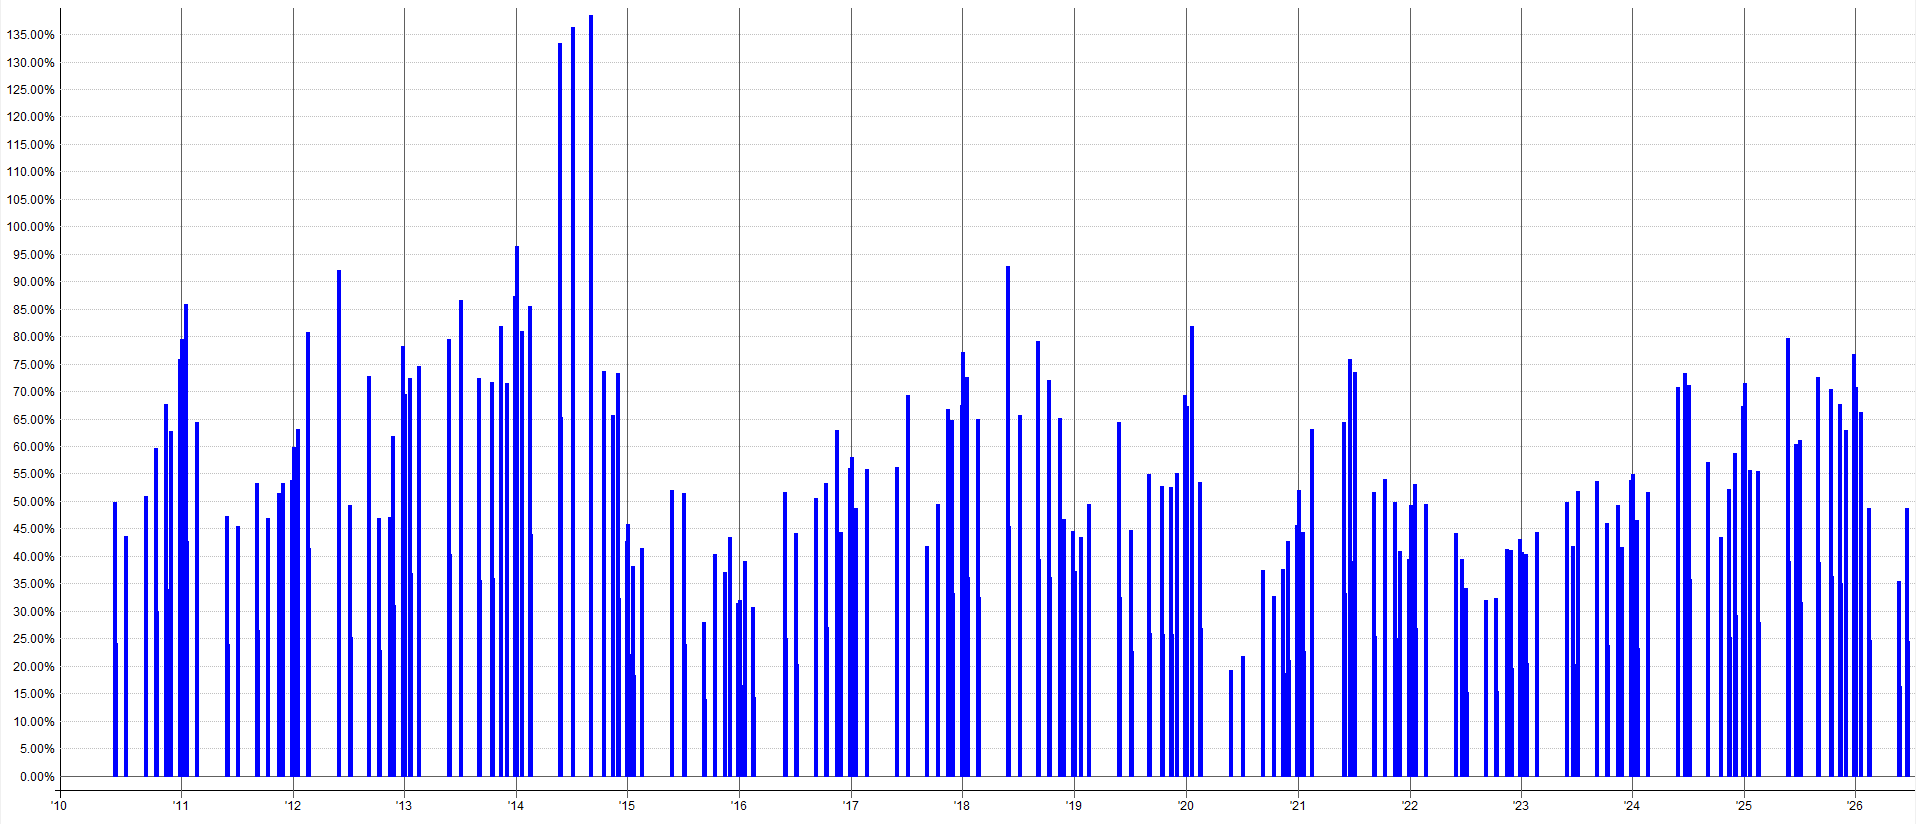
Since all of these trades only happen a few times a year, I wanted to show the exposure over time of the system as well. This will help you get a feel for how infrequently these types of systems are in the market.
For a large institution, few trading opportunities are unattractive. For us retail traders, we can use the low average exposure from few trading opportunities as a positive.
We will get to why later on in this article. See below for the exposure over time for this system (the last plot for all of these system recaps will be the exposure plot).
Holiday Effect on Energy Assets:
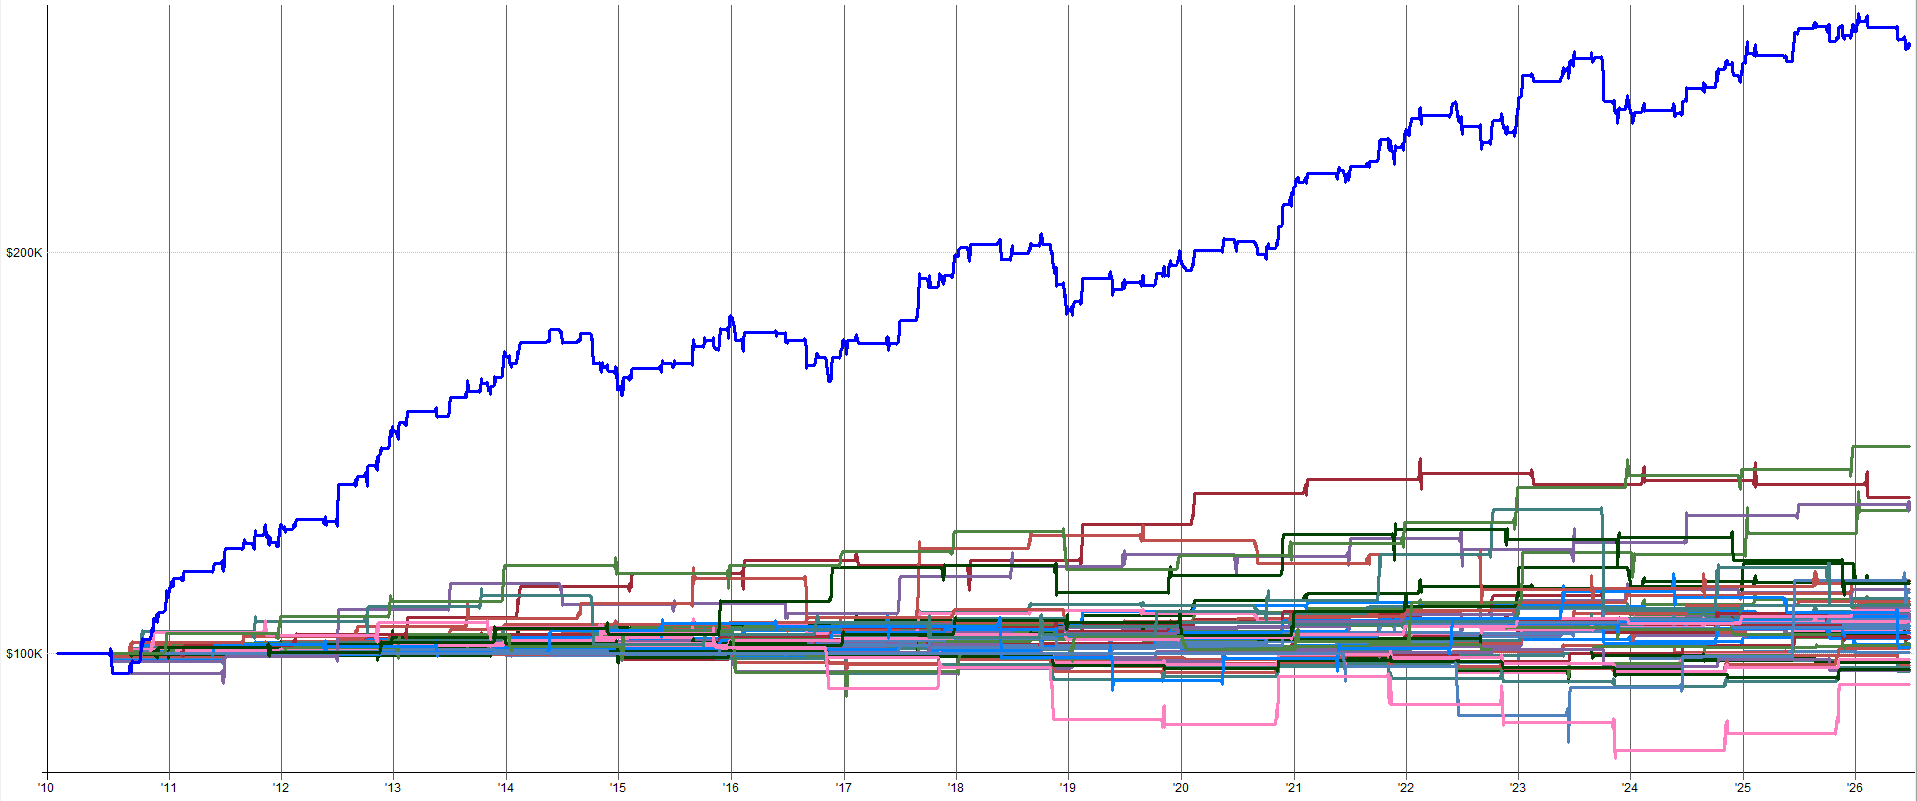
The resulting system for trading the holiday effect on energy assets is shown below. This trade is very similar to the holiday effect on equities. The dark blue line is the combined system equity curve result.
All of the lines below are the individual holiday results.
Some holidays work better than others, but we trade them all the same way and scale into the trade as the holiday nears.

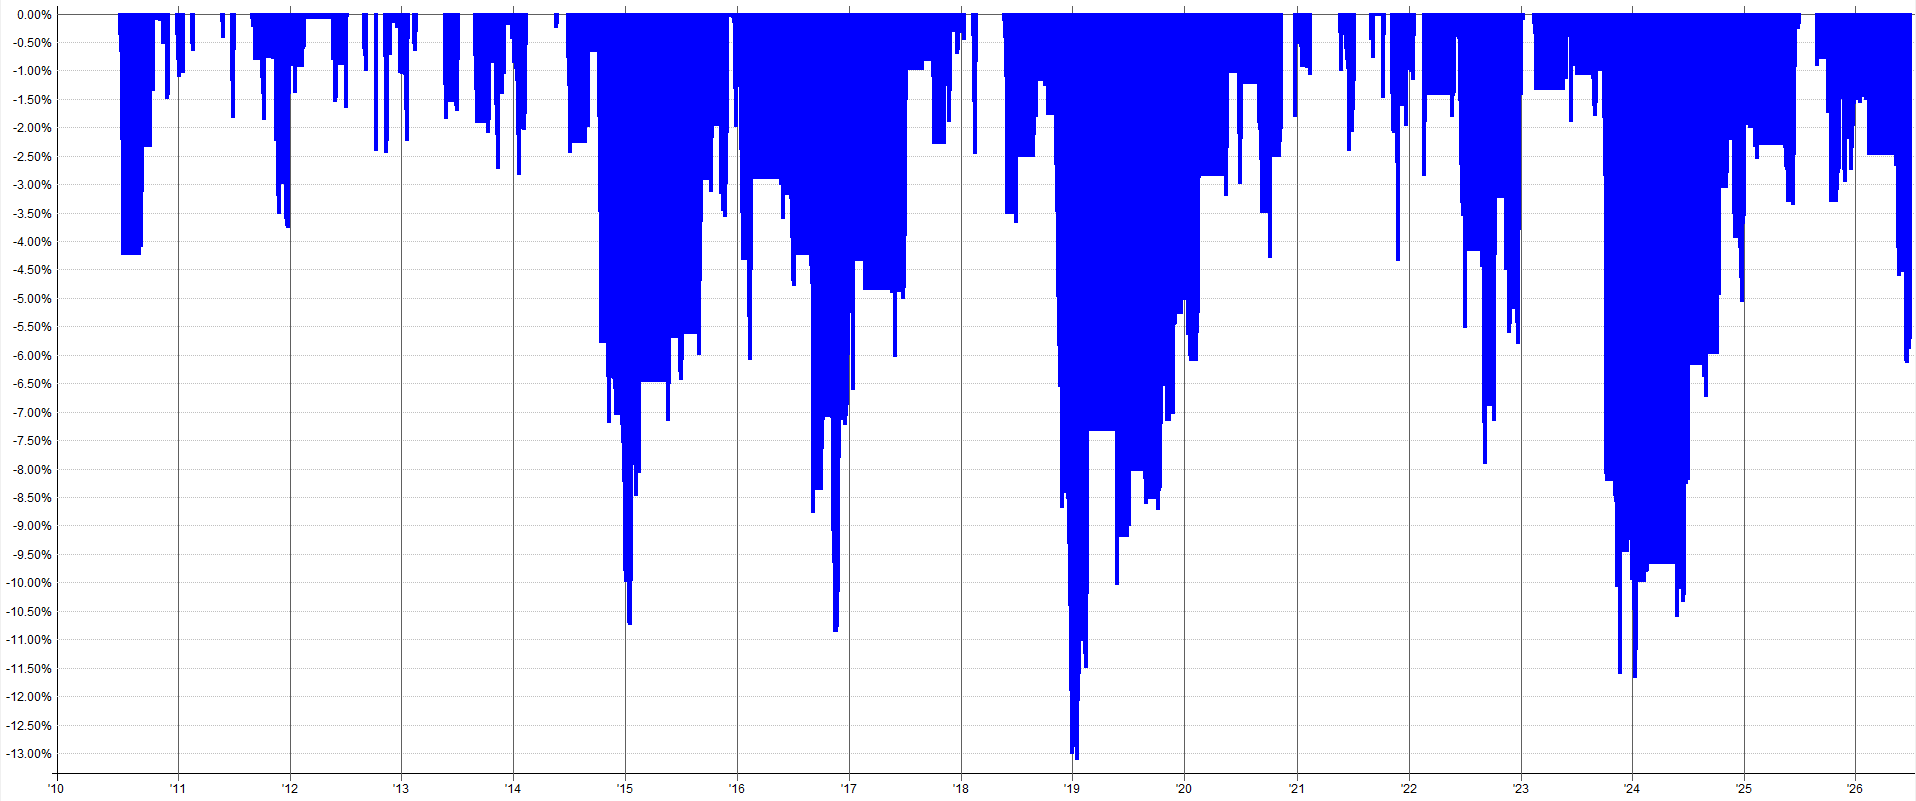
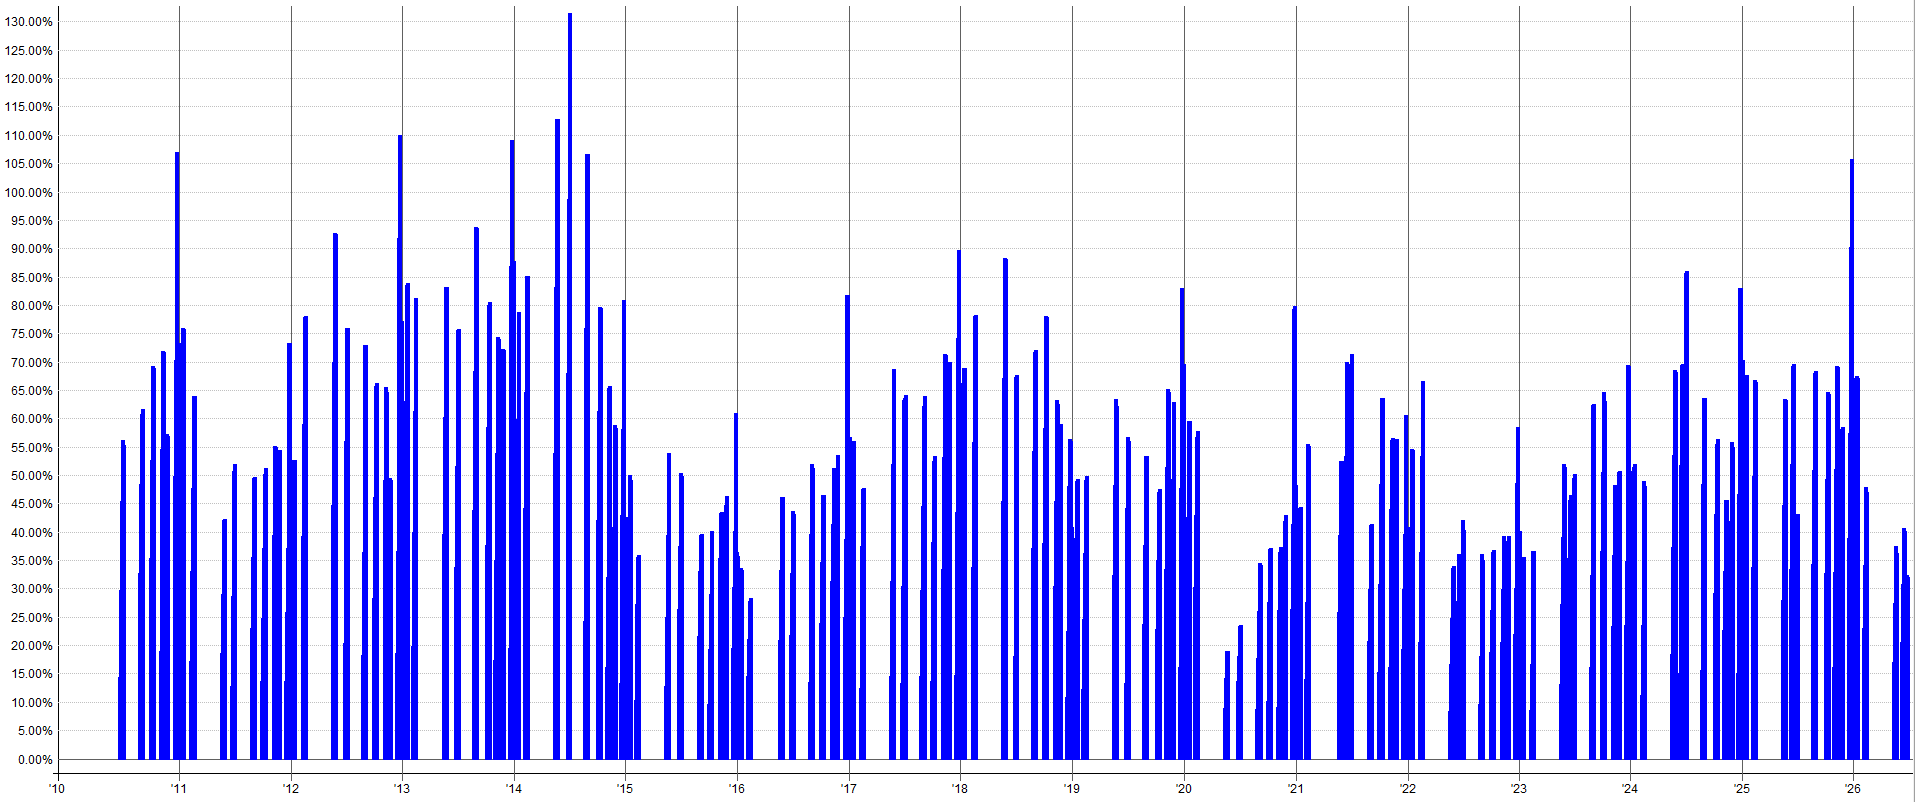
The holiday effect on energy assets resulted in a second system based on a secondary anomaly that persisted in the data when we were researching the effect.
Trading this anomaly isn't the prettiest trade in the world, but it works and it's a short trade. I'm always open to exposure on the short side to help balance out my mostly-long equities portfolio, so I'm happy to implement it.
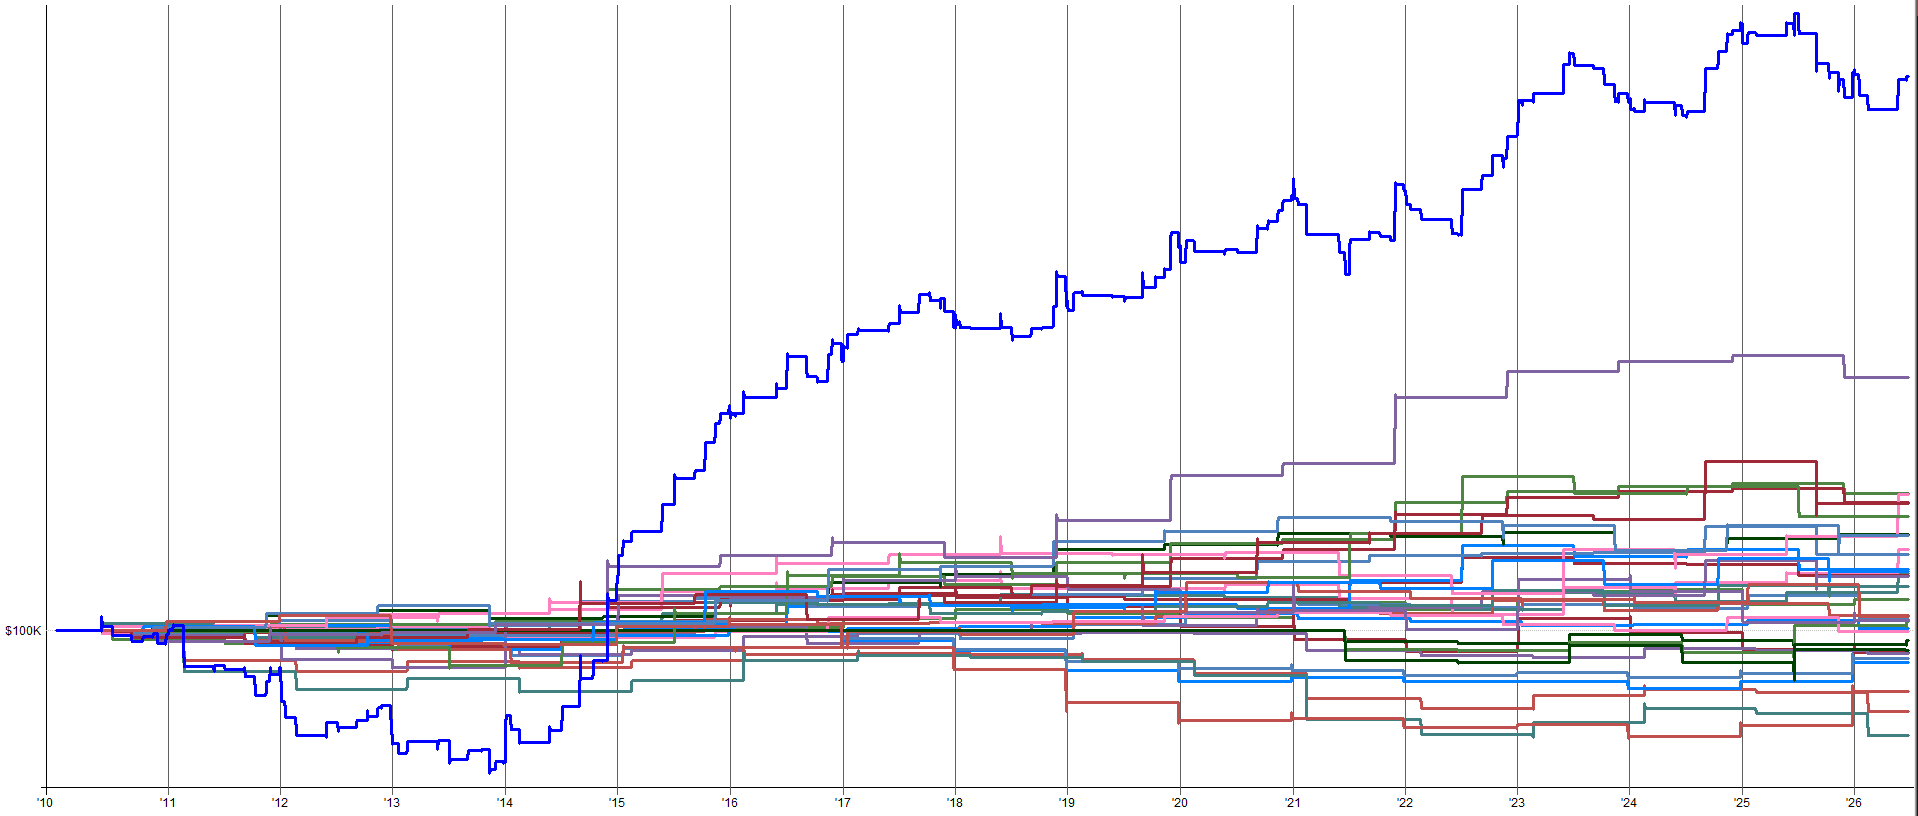

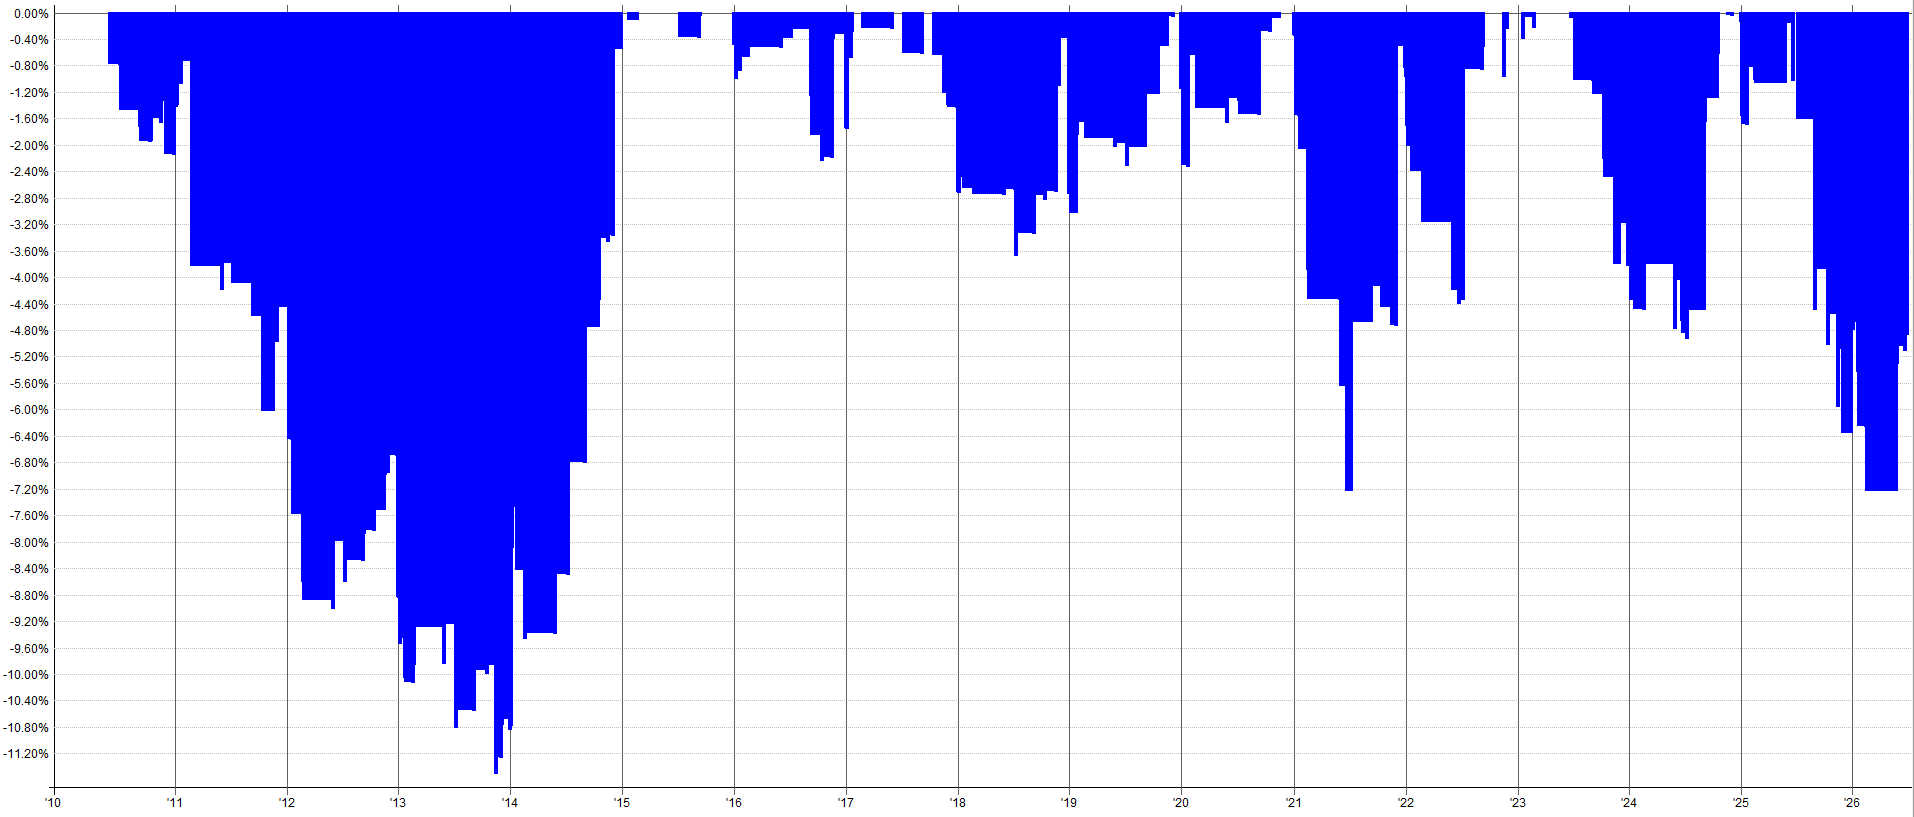
Turn of the Month Effect:
The resulting system for trading the turn of the month effect on equity assets is shown below. This trade scales into the market during the last few days of the month and scales out as the next month begins.
Again, the dark blue line is the combined system equity curve result. All of the lines below are the individual trade scale-in results based on a diversified set of parameter sets to ensure we don't enter the trade all at the same time (we will discuss why we scale in and out of these trades in the next section of this article).

Turnaround Tuesday Effect:
The resulting system for trading the Turnaround Tuesday effect on equity assets is shown below. This trade scales into the market on Monday based on the strength of a few features we found to be predictive of a more profitable trade.
Again, the dark blue line is the combined system equity curve result.
All of the lines below are the individual trade scale-in results based on a diversified set of parameter sets to ensure we don't enter the trade all at the same time.
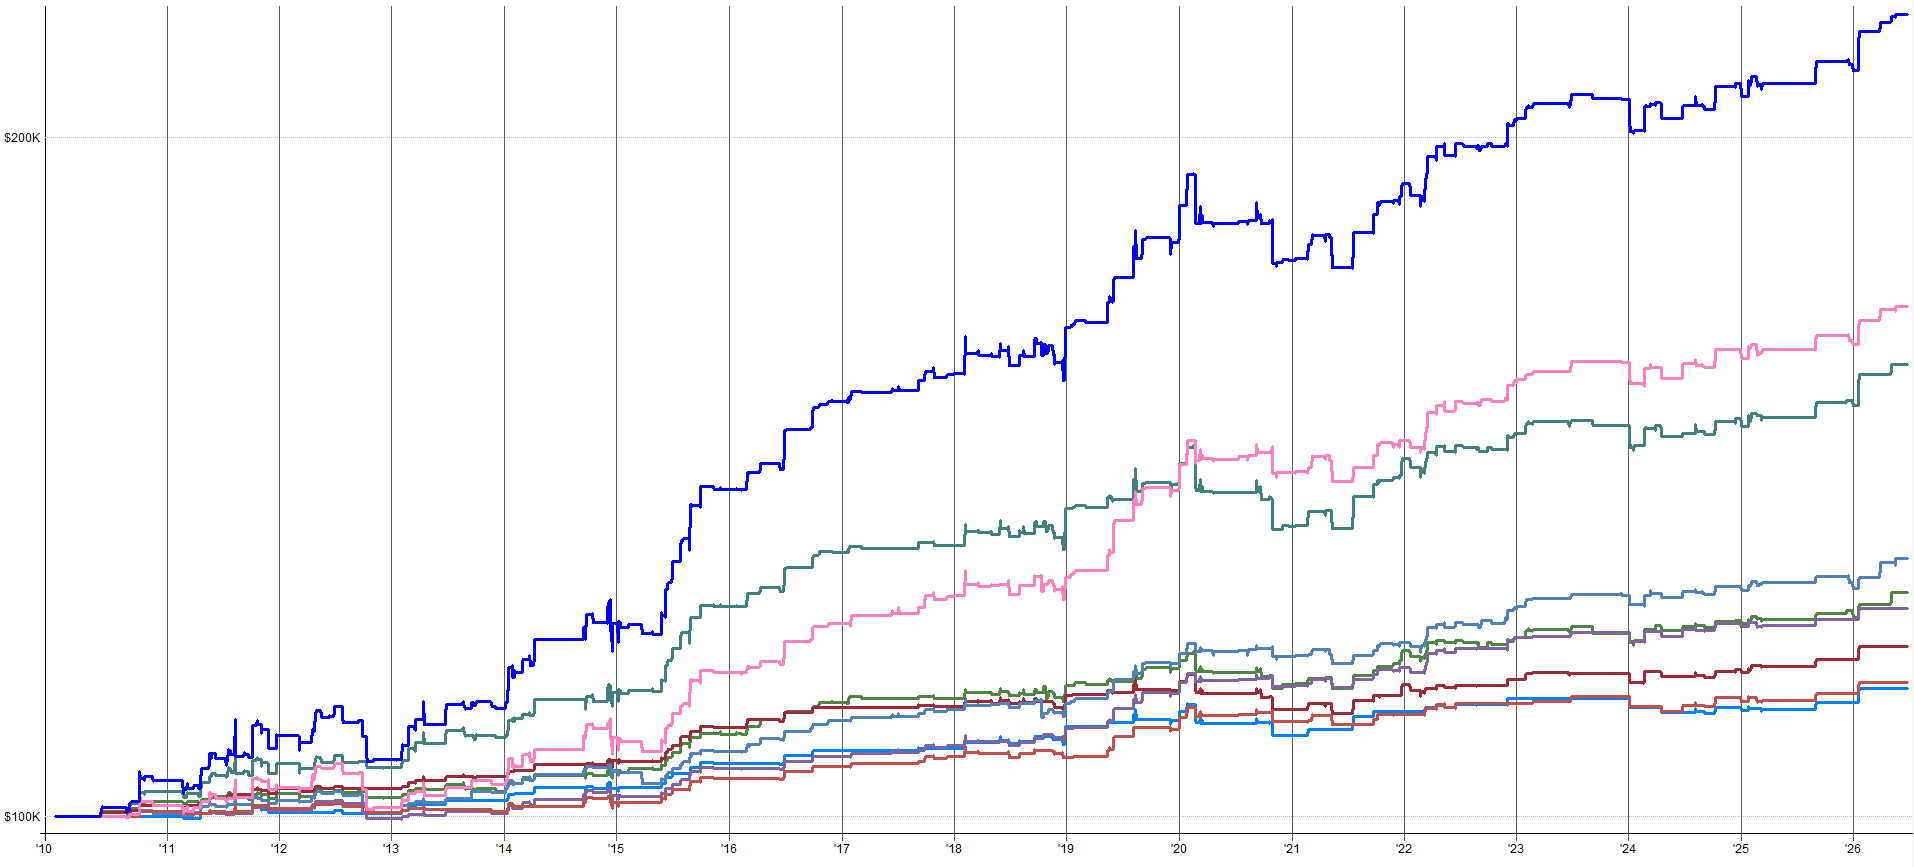

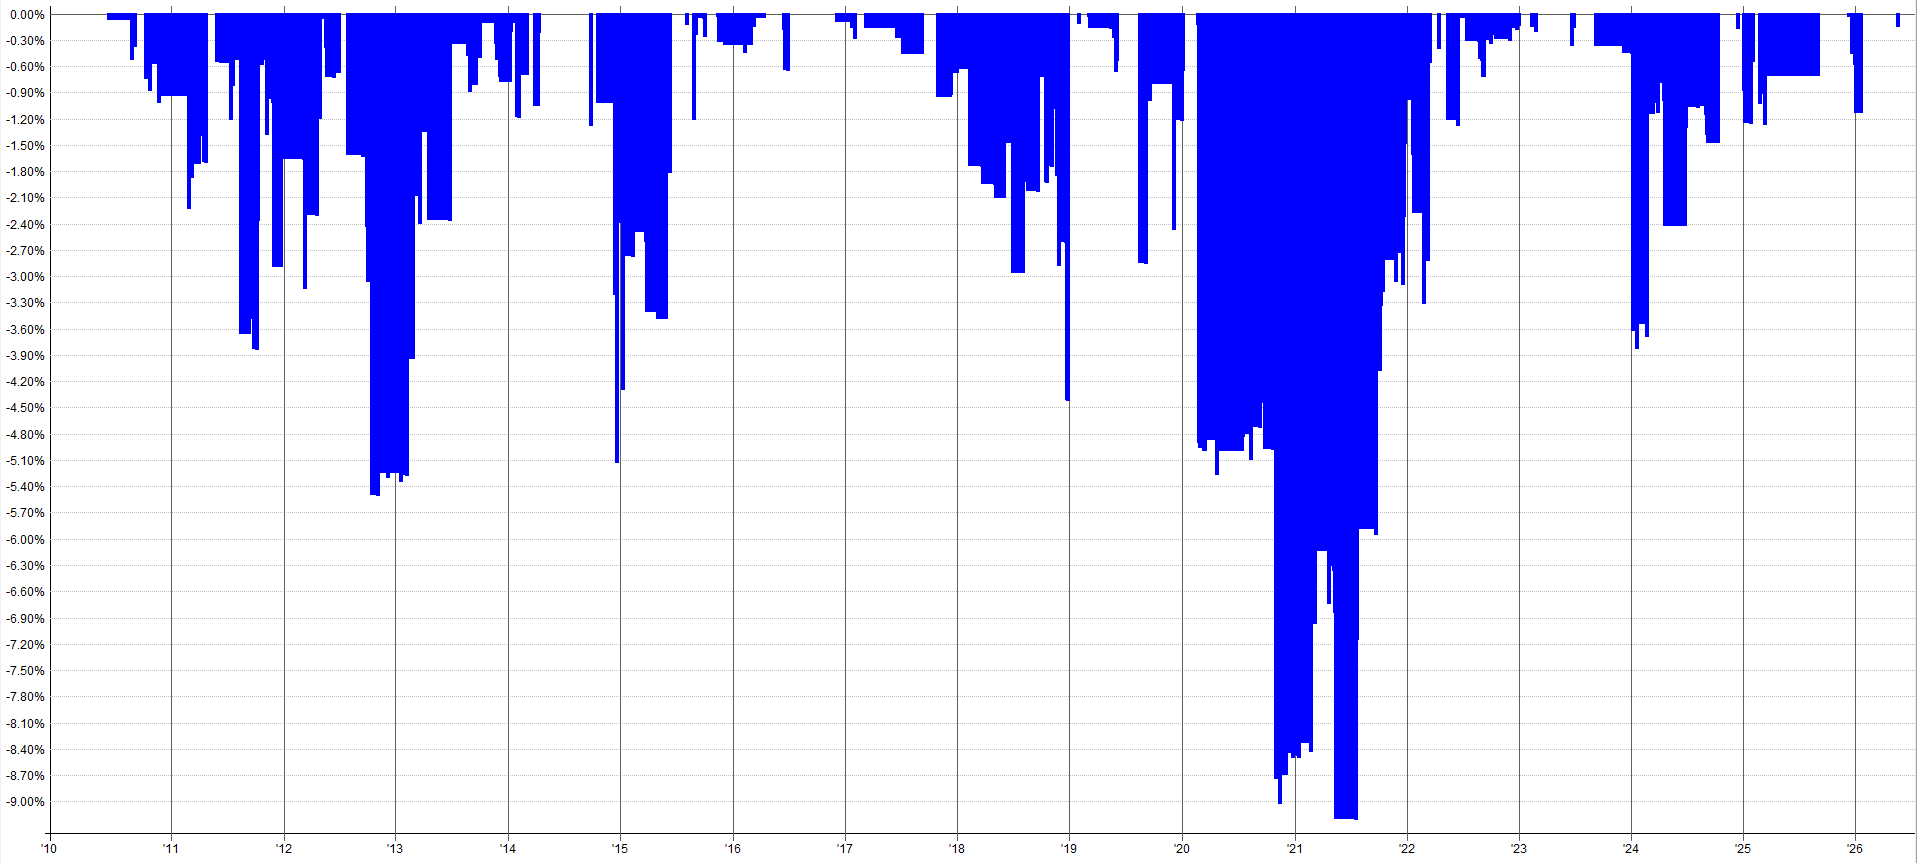
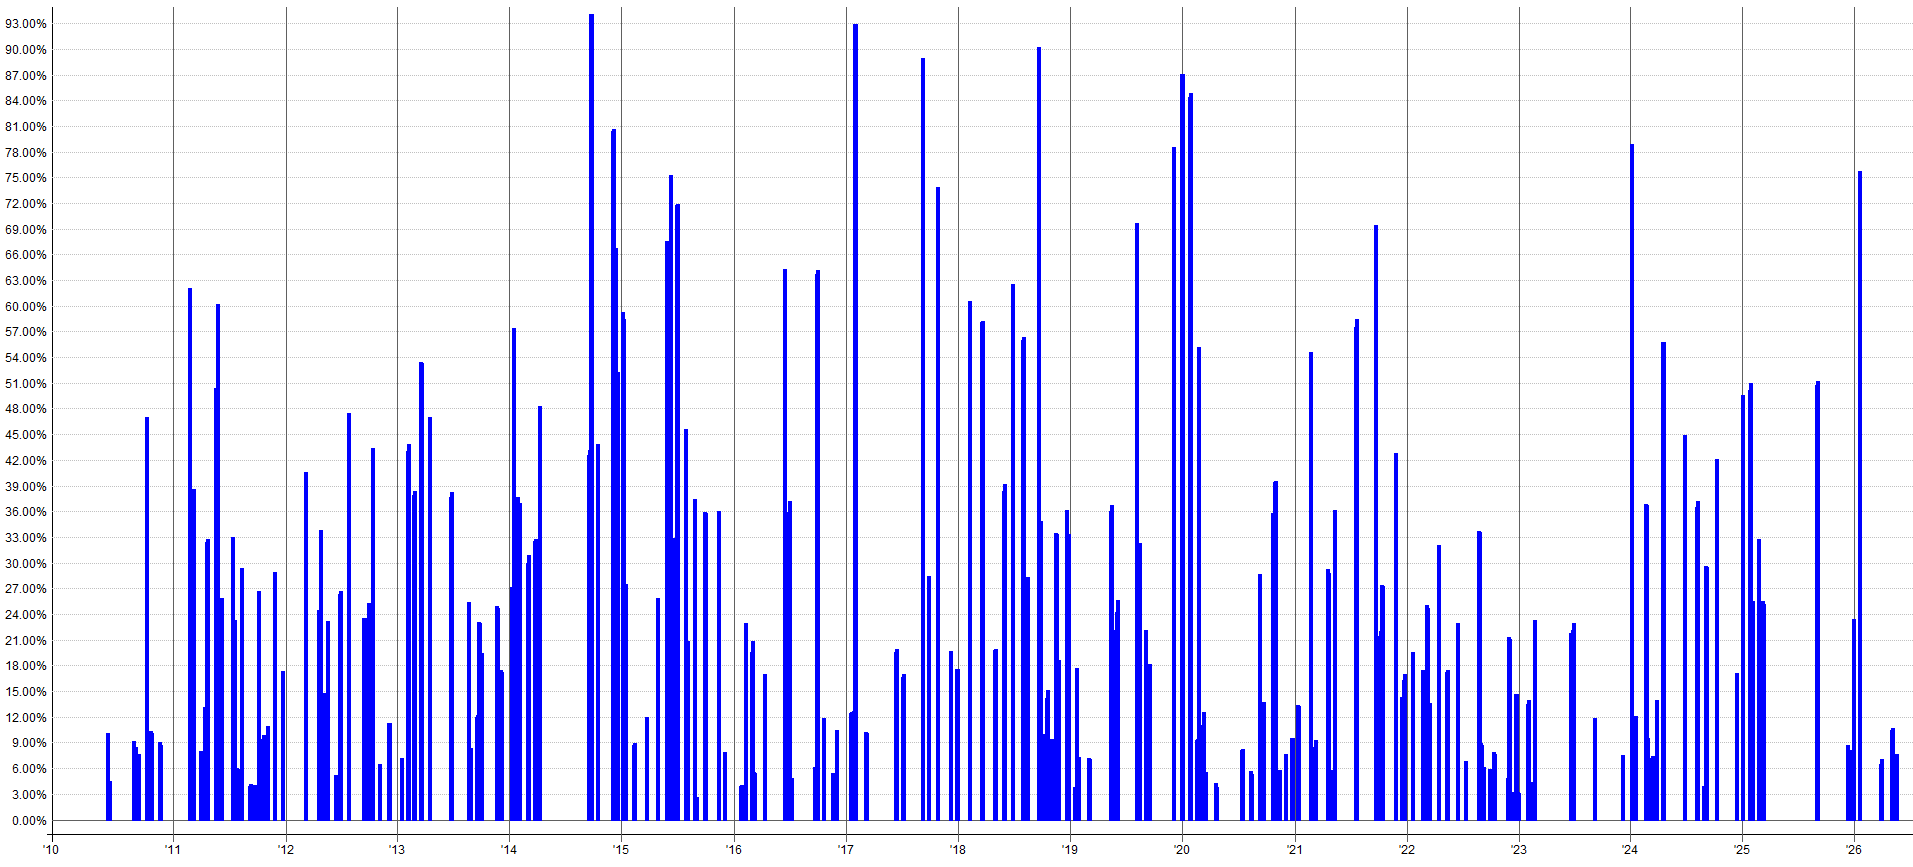
You'll notice not a single one of these systems is amazing.
A handful of percent CAGR, generally low Sharpe ratios, lots of idle capital, etc.
Standalone, none of these systems are exciting, but combined into a mini-portfolio, you may be surprised by the result.
How These Systems Were Built With Robustness In Mind:
The most common decay mode for a calendar/seasonal effect is not the effect disappearing overnight. Rather, it’s a slow drift of the optimal time to enter and exit the trade.
As the effect becomes more well known, traders start to front-run the effect more and more and sell earlier and earlier. It becomes a competition of who can get in and out of the trade with profits first.
This causes the effect to decay over time as the lumpy flow that used to create the effect starts to get more spread out over time. Removing or dampening the mechanism that caused the price to somewhat predictably move too far in one direction in the first place.
So one cause is due to front-running and spreading out the once-lumpy flow to a point where the price action becomes efficient and smooth again, and the effect dissipates.
The other reason why these effects appear to decay over time is due to how systematic traders attempt to capture them. Many times, the effect hasn’t actually disappeared, but the trader still loses money trading it.
This is because the trader likely created a very rigid trading system, with fixed parameters they optimized to death. The second the markets behave slightly differently in the future, the system starts losing money.
The effect may still exist, but due to the noisy nature of markets, it may play out slightly differently in the future than it did in the past. This could be due to more competition and front-running, as discussed above. But it can also simply be due to noise too, and a system overoptimized to the past will not be able to adjust for this.
Hence, we needed to develop these systems with that in mind. We know these effects are noisy and the optimal time to enter or exit will not be the exact same every week/month. We need these systems to be nimble enough to be able to handle that noise.
For example, the best Holiday effect entry day in 2017 will likely not be the best entry day in 2019. The best Turn of Month entry day may shift around as institutional flow timing evolves.
Maybe rebalancing used to happen all on the last day of the month for many funds, but now funds break it up over multiple days to reduce market impact. The exact timing of when the effect plays out may wiggle over time, but the reason it occurs is still intact.
If you build a system that bets on a single “best day” picked with hindsight, you are exposed to that drift in the optimal time to exploit the effect.
Each of the five systems was developed to handle this shift in what’s optimal. We did this by purposely being suboptimal in the backtest, and instead being more robust, which almost never results in a better backtest. But being more robust in the system design creates more optimal results going forward in time during live trading.
Rather than try to guess the optimal parameters to tune, each system scales in and out of the trade over time based on different parameter sets and entry/exit timing mechanisms. Thus we are not exposed to one unlucky parameter choice, instead we are exposed to a bunch of parameters at the same time, allowing us to achieve a more average result in the future.
The practical consequence is that you don’t end up pulling out your hair trying to decide whether entering 5 days or 7 days before a holiday is best. Or 4 days before the end of the month, or 2 days, etc.
The optimal time to enter these types of trades will shift around over time. So let’s not try to be optimal, let’s try to be robust. Scaling in and out over time allows the systems to still capture most of the effect, even when the specific best day drifts.
Why Bundle These Into a Mini-Portfolio:
You may be tempted to pick your favorite backtest of the 5 systems shown above and only trade that, but that would be a mistake. We are significantly better off trading all 5 rather than the one or two best-looking backtests.
Here are four reasons why trading all five is a better decision than the best one or two:
Argument 1: None Of The Systems Are Really That Great By Themselves:
Let’s be honest. While one or two backtests may look almost okay enough to trade, no individual effect is really good enough to trade by itself. Standalone CAGRs are a couple percent. Trade counts are too low to justify the operational load of monitoring a system that is going to spend most of the year doing nothing.
Any one of these as a standalone allocation would be a waste of attention, you would be better off buying the S&P 500 and closing your brokerage app for the rest of the year.
But when you combine them together, the thinking changes. Five systems trading four different effects, each contributing a couple percent of CAGR. Different mechanisms, different exposure windows, different asset categories, long and short. When combined, they become a real diversified return stream worth running.
As I’ve pointed out a few times before in other articles, the portfolio effect is super powerful. One strategy may have mediocre performance on its own, but combined into a portfolio of many other intentionally different diversified/uncorrelated strategies, the bundle can start to look pretty interesting (as we will see in the next section).
That is the principle the market effect mini-portfolio is built on.
Argument 2: System Diversification:
The mechanisms are generally structurally different from each other.
Weekend overreactions to negative news events drive the Turnaround Tuesday effect.
Seasonal energy demand drives the Holiday trade on energy assets.
Institutional flows drive the Turn of Month effect.
Pre-holiday positioning and positive sentiment drive the Holiday effect on equities.
Different drivers result in diversification of outcome between the different return streams.
When one effect is in drawdown, another may be working. This results in a combined equity curve that is smoother than any single system equity curve on its own.
By trading all five systems, we’re spreading risk across time (different exposure windows), assets (energy vs equity), ideas (behavioral vs structural flow vs seasonal), and system logic (different rule sets for each system).
The takeaway here is that diversification can be measured by correlation, but also intuitively with the knowledge that we are doing something intentionally differently between all the systems across space and time.
Argument 3: Capital Efficiency:
Each effect occurs at a different time. Sometimes they overlap, but many times, when one system is in cash, another is invested. This allows for more efficient use of capital.
Trading one system by itself would result in cash sitting idle 95% of the time. When you trade all of them, you can make portfolio capital less lazy and put it to work for you more often.
With that said, as you’ll see in the next section, even when you combine all of these five systems together, there is still lazy capital. But this will allow us to stack this mini-effect portfolio on top of existing high-exposure systems or portfolios of systems without much fuss.
If the average exposure is low, the bundle can ride on top of whatever you already run without competing for portfolio room (most of the time). Later in this article, we will throw the mini-effect portfolio on top of a momentum system and watch what happens to the combined result.
Argument 4: One System Could Decay:
Any single effect can fade. Markets evolve, behaviors shift, flows change.
The future plan is not:
“These five effects will run forever.”
The plan is:
“Three other effects are covering for whichever one potentially fails in the future.”
Though we’ve built these with robustness in mind, we cannot prevent the markets from getting more efficient. If one or two of the five systems decay over the next decade, trading the combined set of systems is still beneficial. If two of the five systems stop generating profits, the other three are still contributing.
You never know which effect will persist and which ones will work the best in the future. So we have no choice but to trade them all with a sensible allocation to each.
Picking only the best backtest and trading that one puts us in a tricky position if that’s the one system that was accidentally overfit or if that effect stops working.
We would be much better off trading all five in that scenario because then the other four systems could have picked up the slack and likely still ended up with positive PnL overall.
Building The Mini-Portfolio:
There are many ways you could allocate between the five systems within this mini-portfolio. I’ll show two very simple ones and demonstrate that both have very similar outcomes, so as long as your allocations are somewhere in this ballpark, it’s probably going to have a reasonable resulting combined equity curve.
The first method is as simple as it gets.
Equal weight allocation.
There are five systems, each gets 20%, adding up to 100% total allocation.
Equal Weight (20% Each System) Allocation:

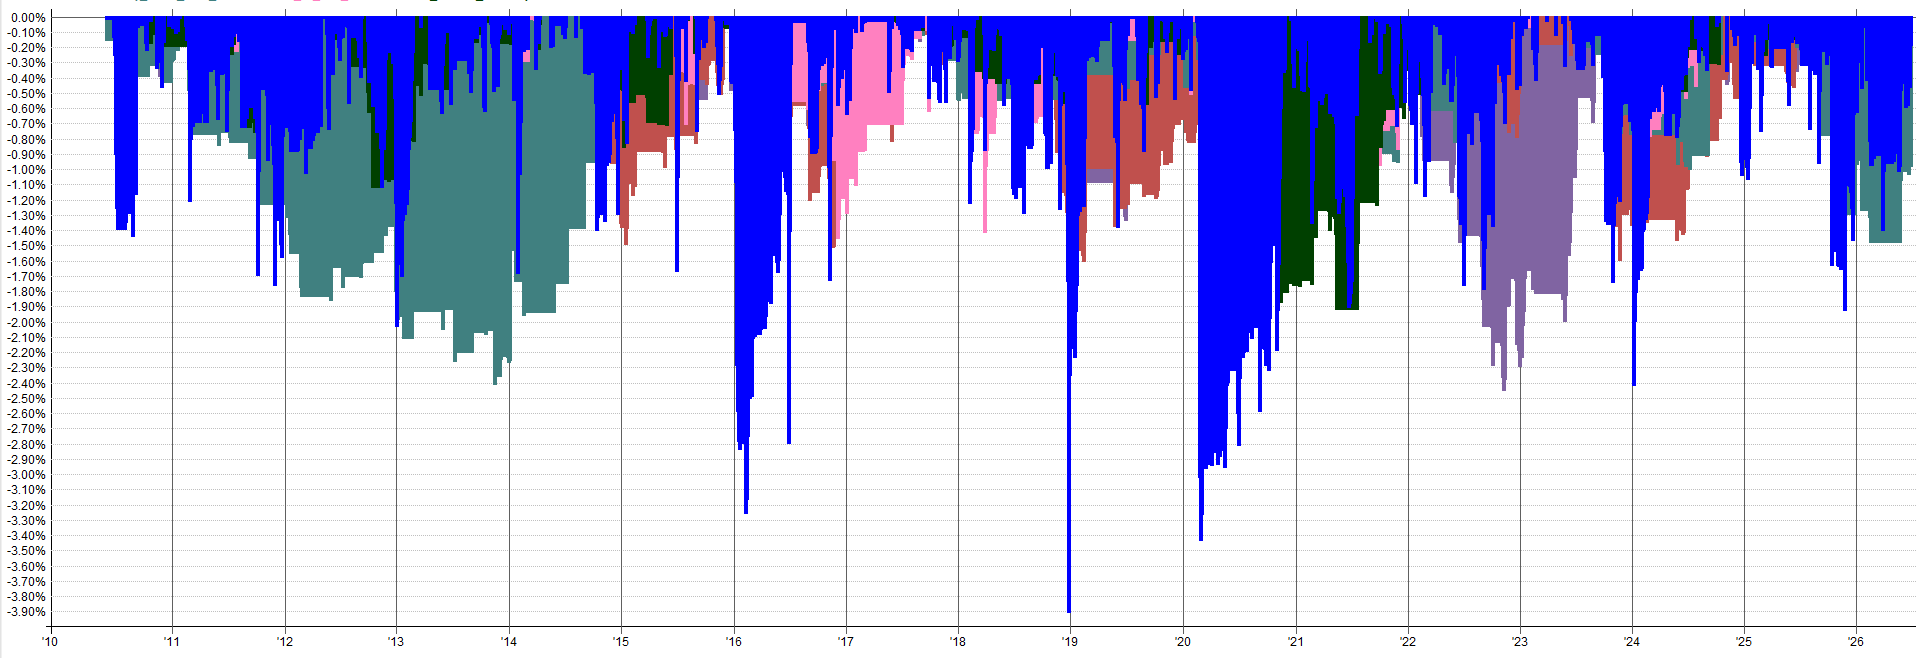
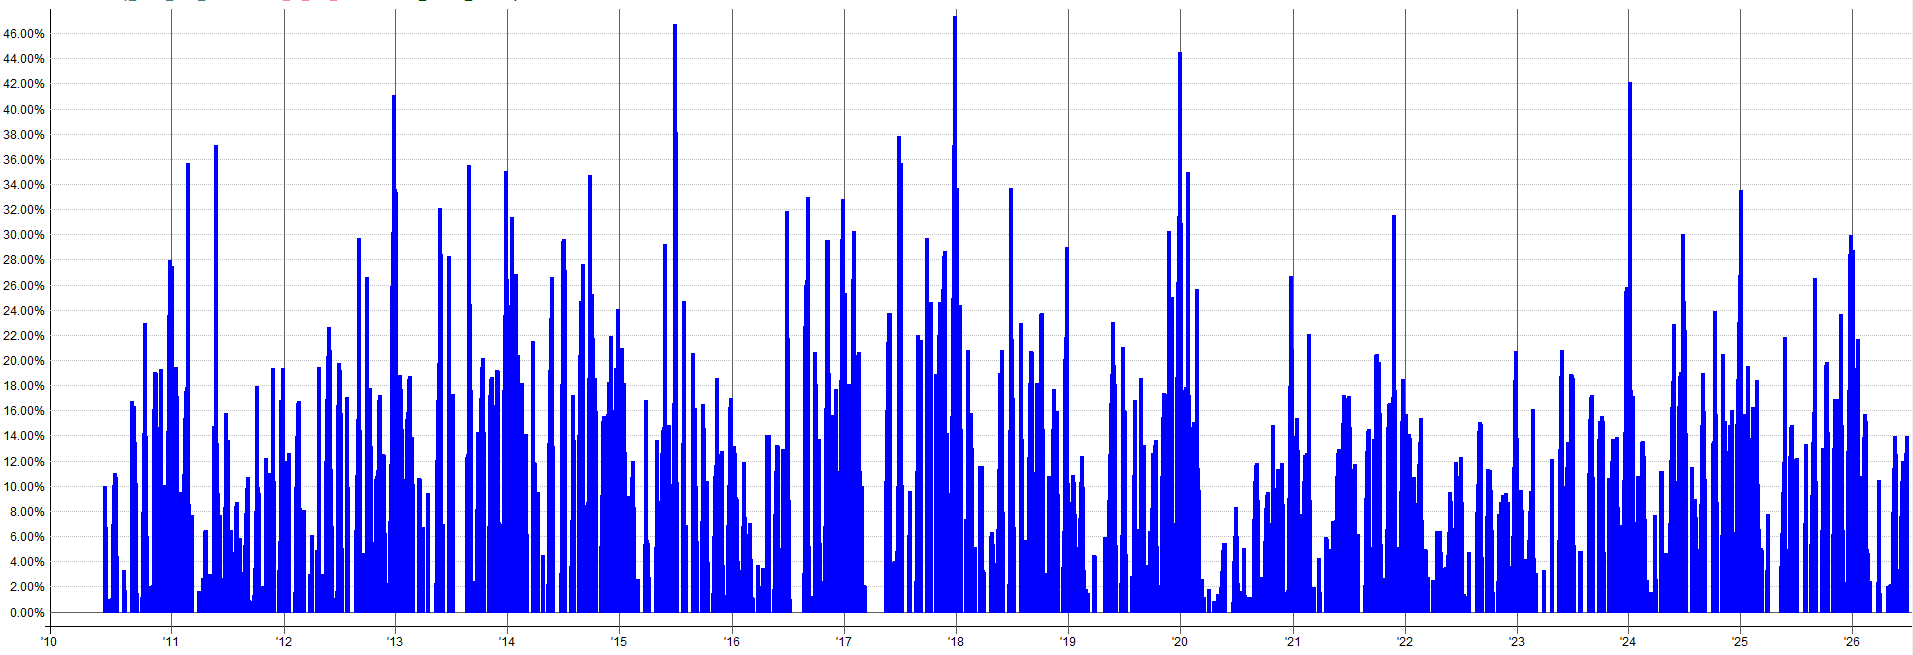
But this isn’t quite optimal.
Equal weight is fine, but because the exposure of these systems is so low, the max exposure never reaches anywhere close to 100%, instead capping out at 47% max exposure. That means at least 53% of capital is sitting and being lazy most of the time.
So we can do an equal-weight allocation, but keep scaling up allocation evenly to each system until max exposure reaches around 100%.
Equal Weight (40% Each System) Allocation:
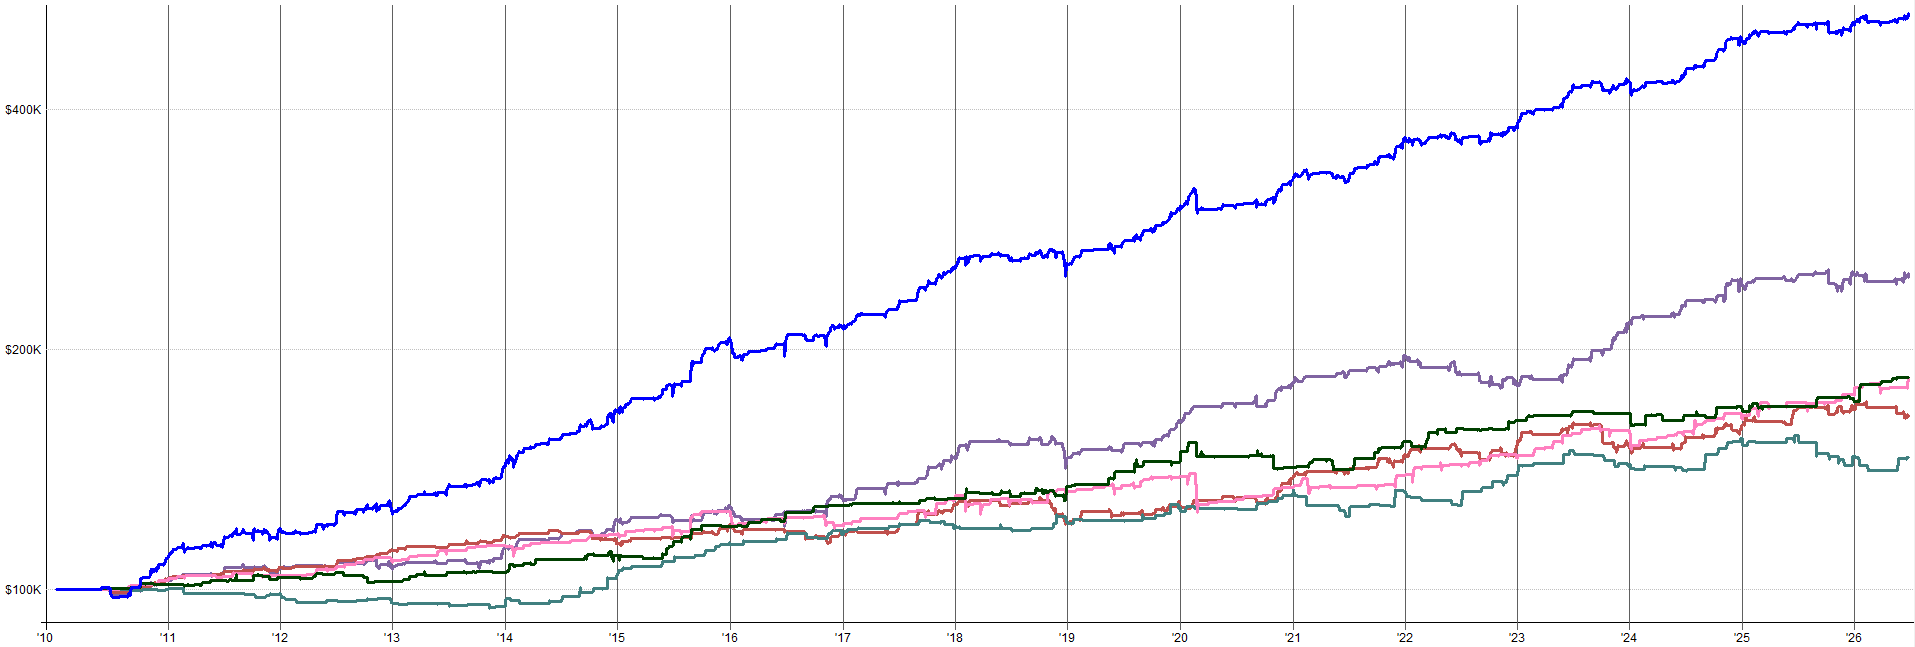

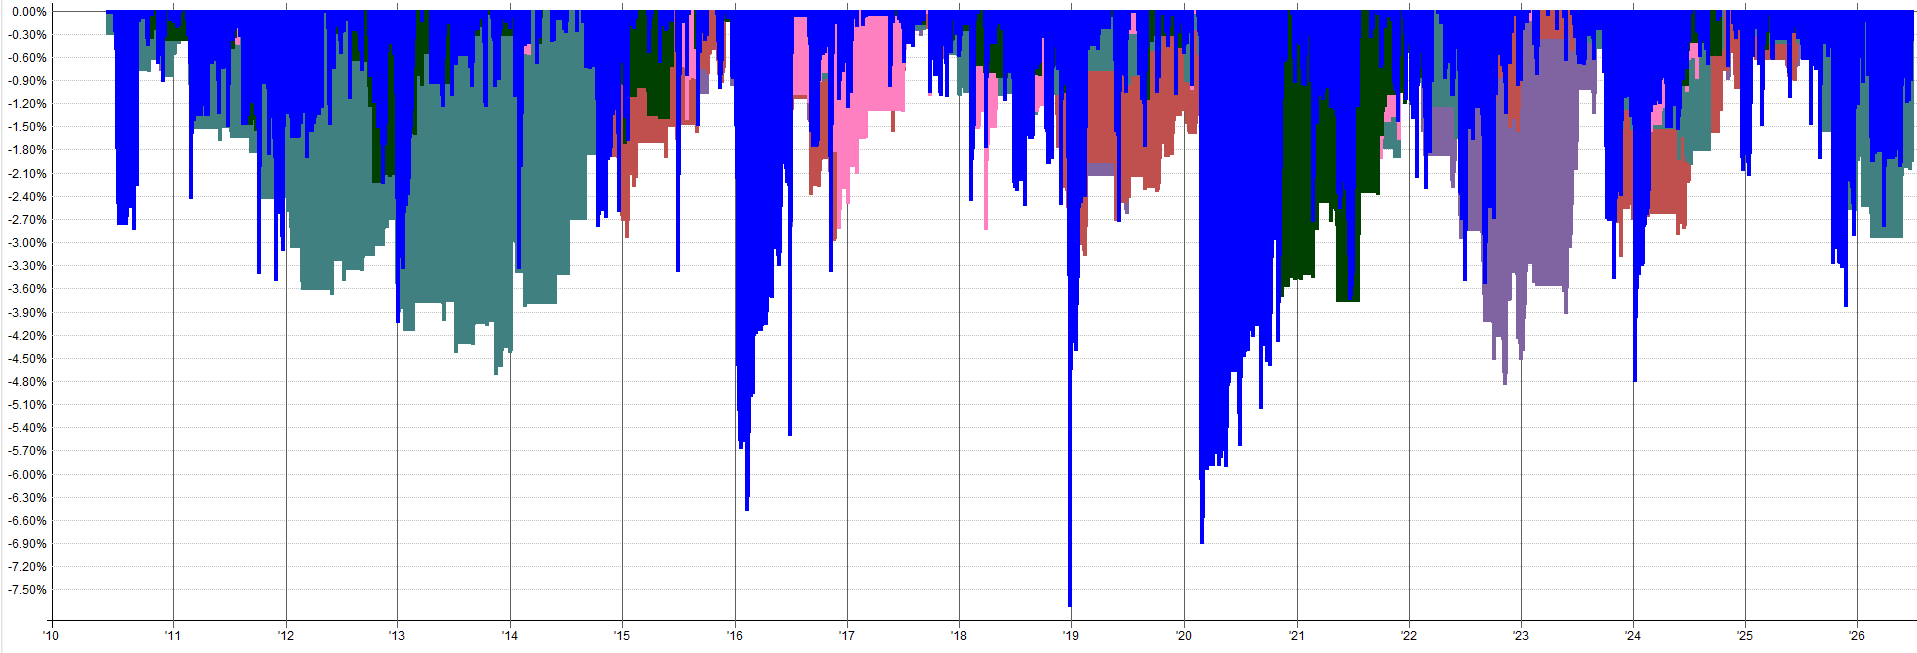
When normalized to around 100% max exposure, the resulting mini-portfolio achieves a CAGR of nearly 11%, max drawdown of 7.71%, Sharpe of 1.77, and is only exposed to the markets on average 12% of the time. That’s capital efficiency if I’ve ever seen it.
And that’s just with a simple equal-weight allocation. We can get slightly more fancy with it and do an inverse volatility normalized allocation as well.
With this allocation method, we don’t simply give all systems the same allocation. We add or subtract allocation based on the historical average volatility of the system. Higher volatility systems get less allocation, lower volatility systems get more allocation. This generally helps with risk-adjusted returns.
The inverse volatility allocations that sum to about 100% allocation are shown below:
Holiday Effect Equities: 17%
Holiday Effect Energy System 1: 17%
Holiday Effect Energy System 2: 27%
Turn Of The Month Effect: 18%
Turnaround Tuesday Effect: 22%
Inverse Volatility Allocation:

But again, let’s normalize these allocations so they can sum to greater than 100% so we can see what this mini-portfolio can do when max exposure reaches around 100%. This will give us a better idea of how this mini-portfolio actually performs when more capital is used.
The inverse volatility allocations that sum to about 100% max exposure are shown below:
Holiday Effect Equities: 36%
Holiday Effect Energy System 1: 36%
Holiday Effect Energy System 2: 57%
Turn Of The Month Effect: 40%
Turnaround Tuesday Effect: 47%
Inverse Volatility Allocation (Scaled to 100% Max Exposure):
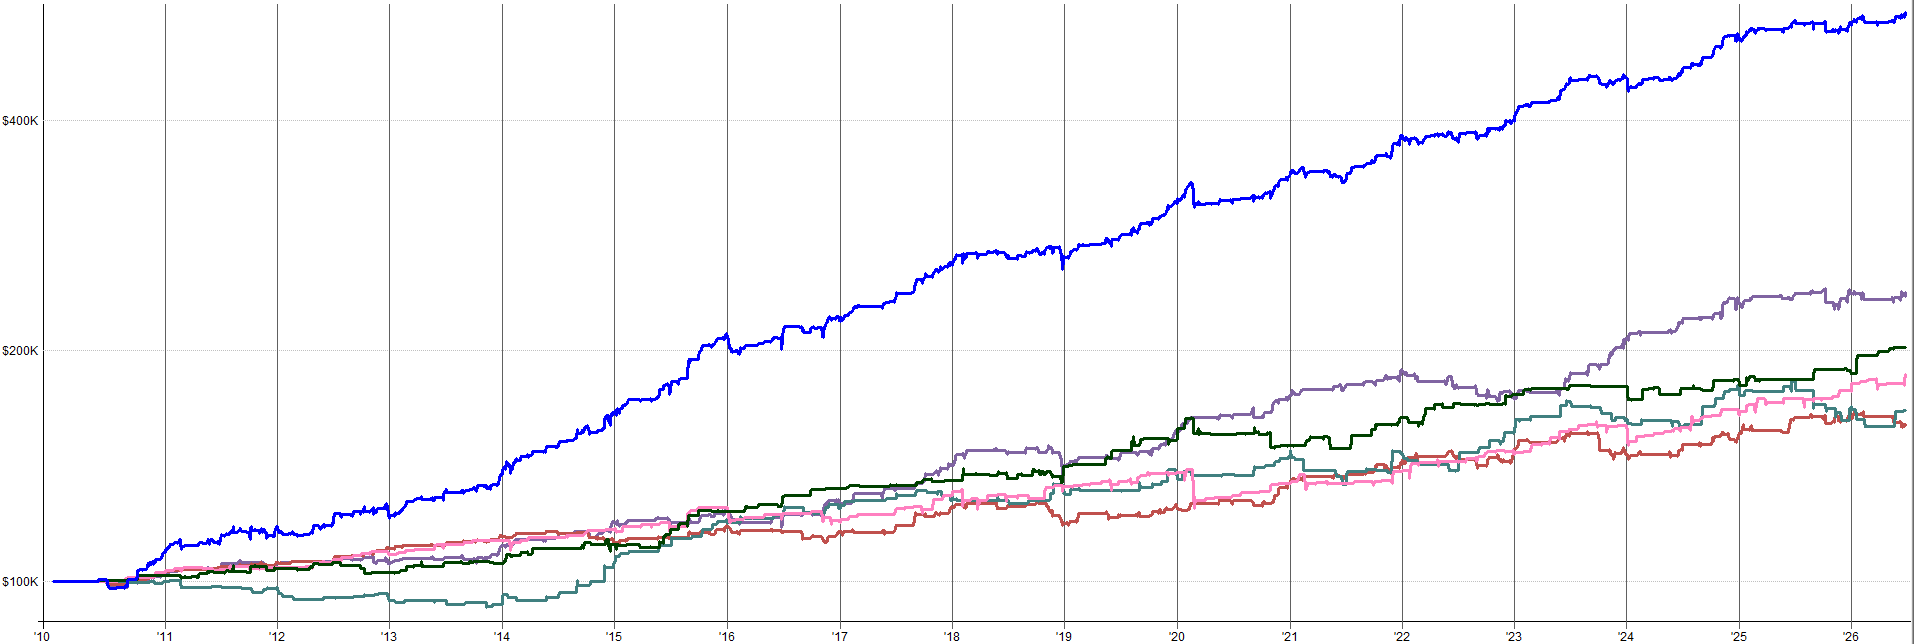

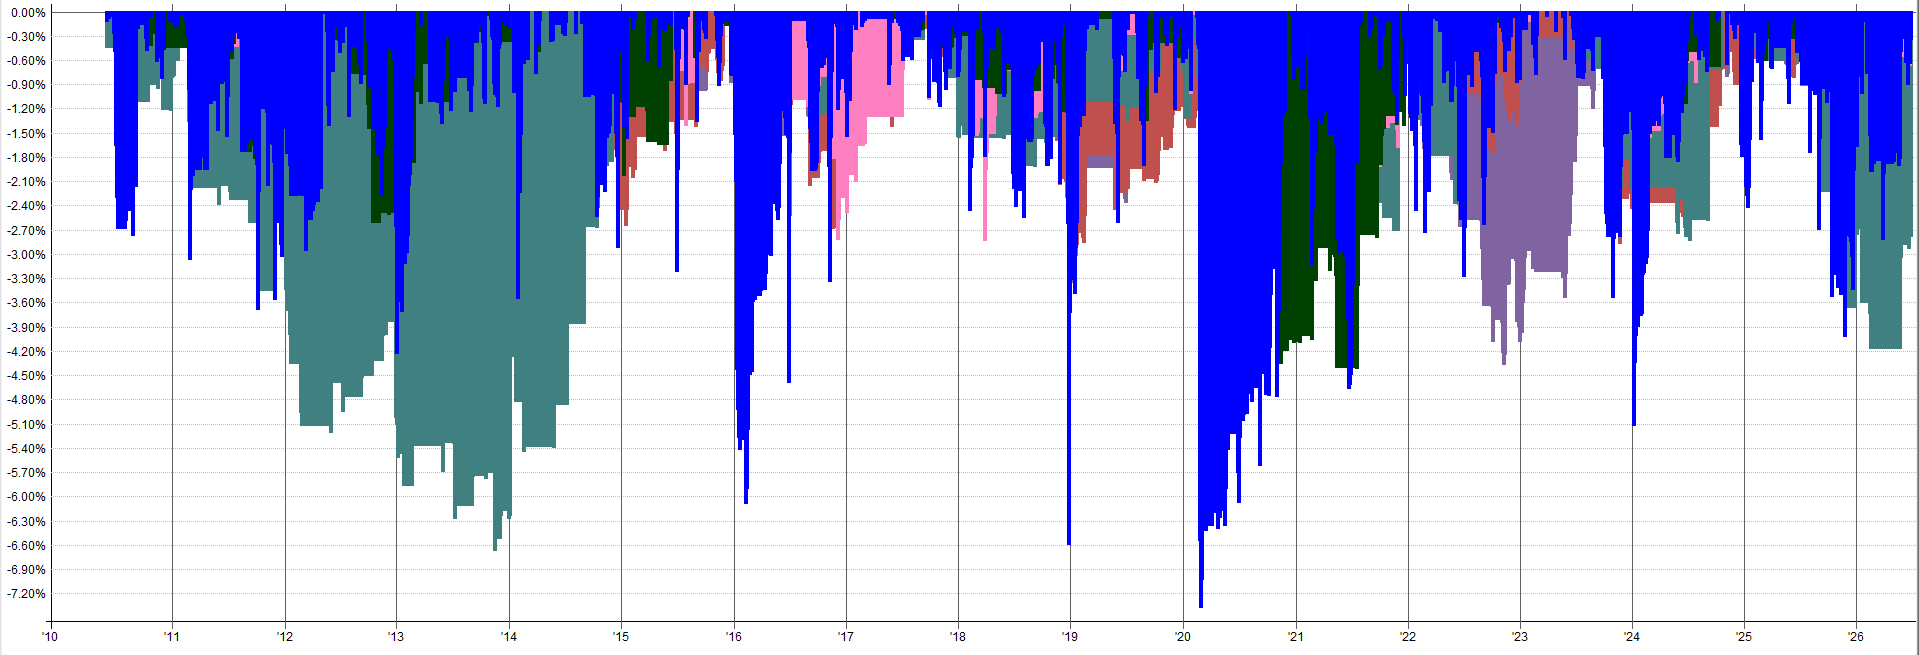
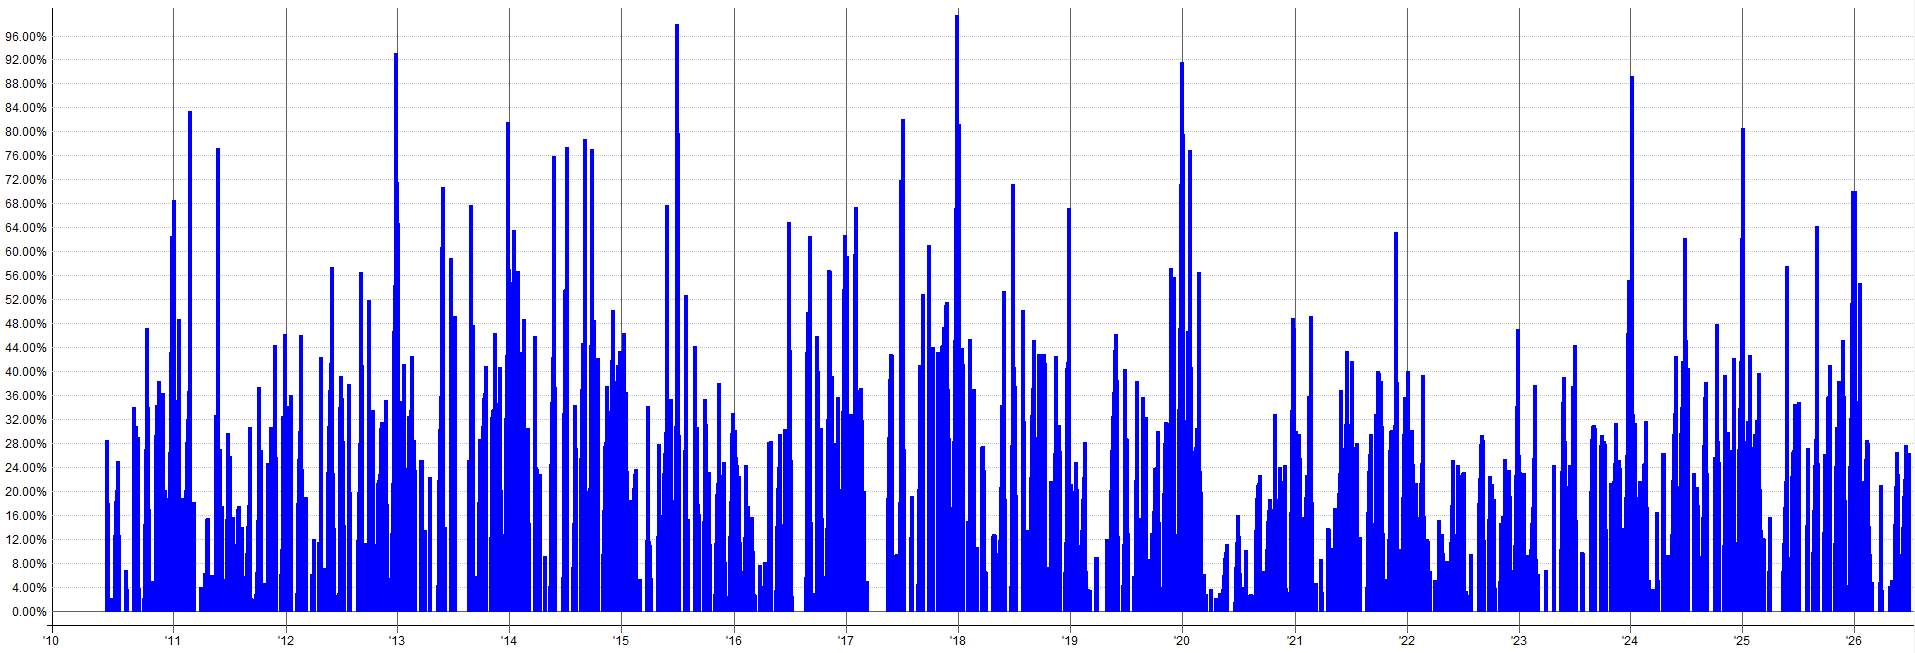
Sharpe is slightly better with the inverse volatility weighting, going from 1.71 to 1.77. Calmar ratio is slightly better as well, going from 1.41 to 1.52.
So while the inverse volatility weighting is better on a risk-adjusted basis, it’s only by a little bit.
For my own portfolio, I took this inverse-volatility weighting approach. But I don’t let the mini-portfolio use 100% exposure. I did that more for comparison purposes above.
Instead, I inverse-volatility weighted it such that the mini-portfolio caps out around 40% max exposure (which results in around 6% average exposure). This is so I can better slot it into my existing portfolio without as many issues.
If I allowed the mini-portfolio to use 100% exposure and then added it to my current full portfolio, which already uses over 100% exposure at times, I would potentially be stacking a lot more leverage on top of my current portfolio, which I don’t want to do. I’m okay with stacking a little more leverage onto my current portfolio at times, hence the 40% max exposure rather than 100%.
The interesting thing is that, the majority of the time, adding this mini-portfolio on top of my existing portfolio at 40% allocation will not lead to much extra leverage use. The majority of the time, I’ll have just happen to have some idle cash sitting around to take the trade from one of these systems. And when I don’t, I’ll simply use a little bit of leverage for a short period of time.
The only times I have to worry about are the very infrequent instances when all five systems within the mini-portfolio happen to be eligible to take a trade at the exact same time and get filled. This can happen and could be scary if I were fully loaded using a lot of leverage.
This happens maybe once every 1.5 to 2 years on average. If you’re going to take this stacking approach, this is the risk you take. The majority of the time the extra exposure usage just uses idle capital lying around, but sometimes the exposure ends up stacking, and you have to accept that, from time to time, this will happen.
Stacking the Mini-Portfolio On Top Of Another System:
Let’s walk through an example of stacking this mini-portfolio on top of an existing trading system.
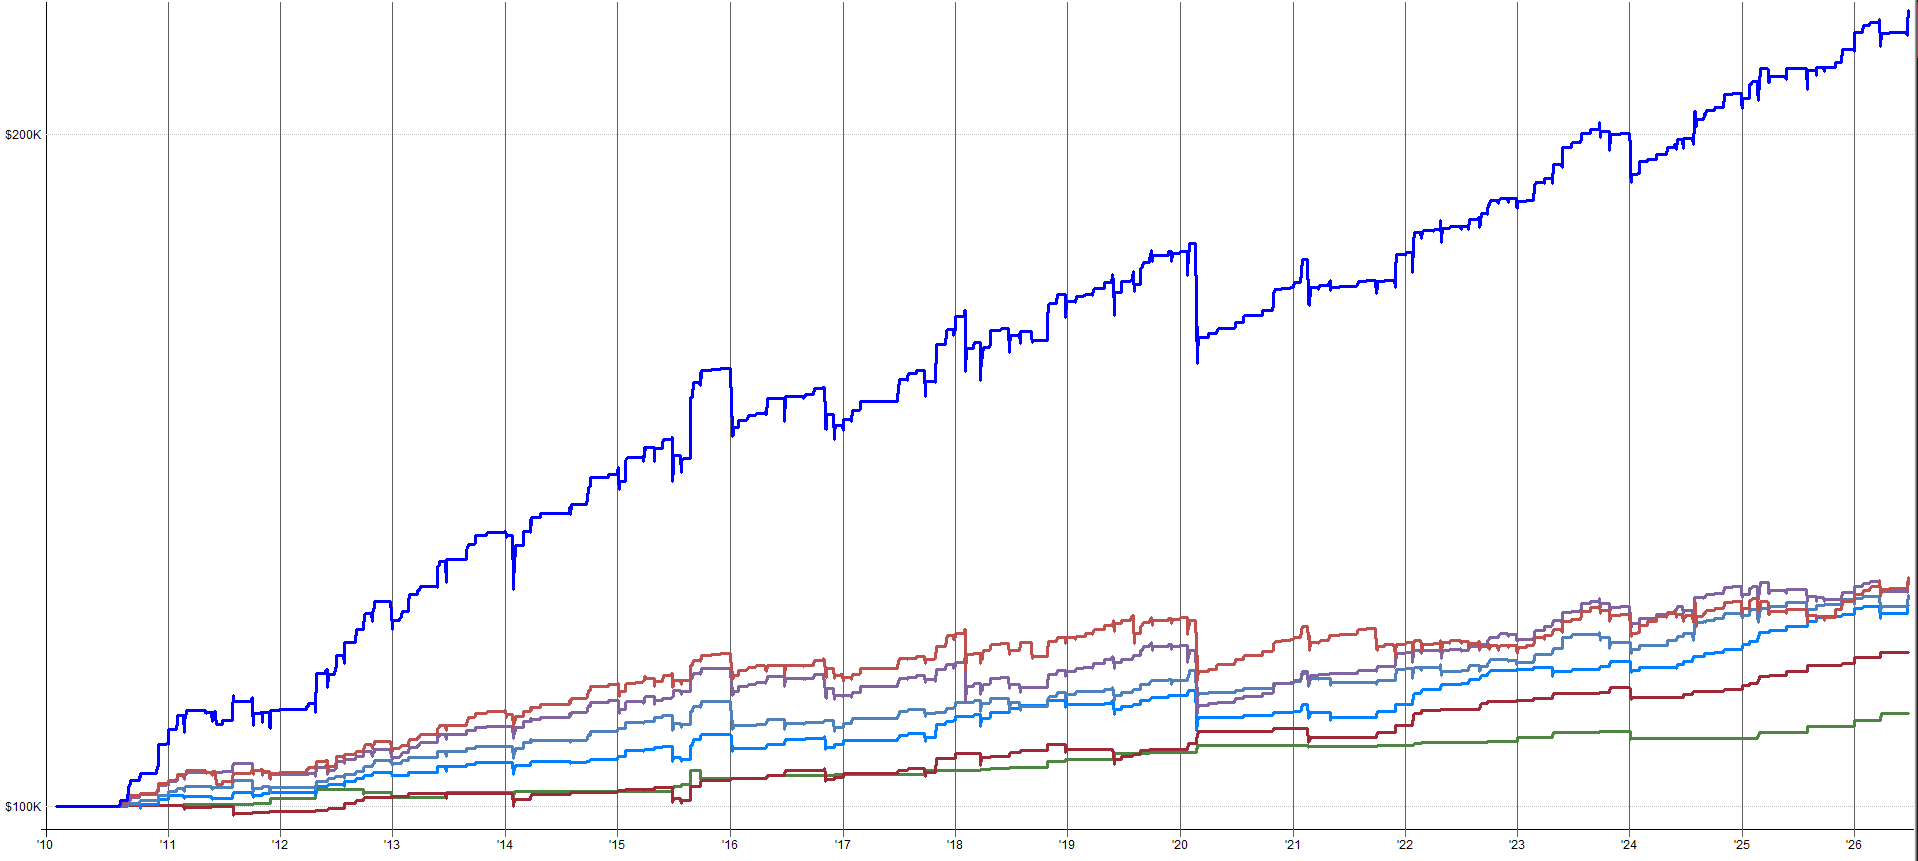
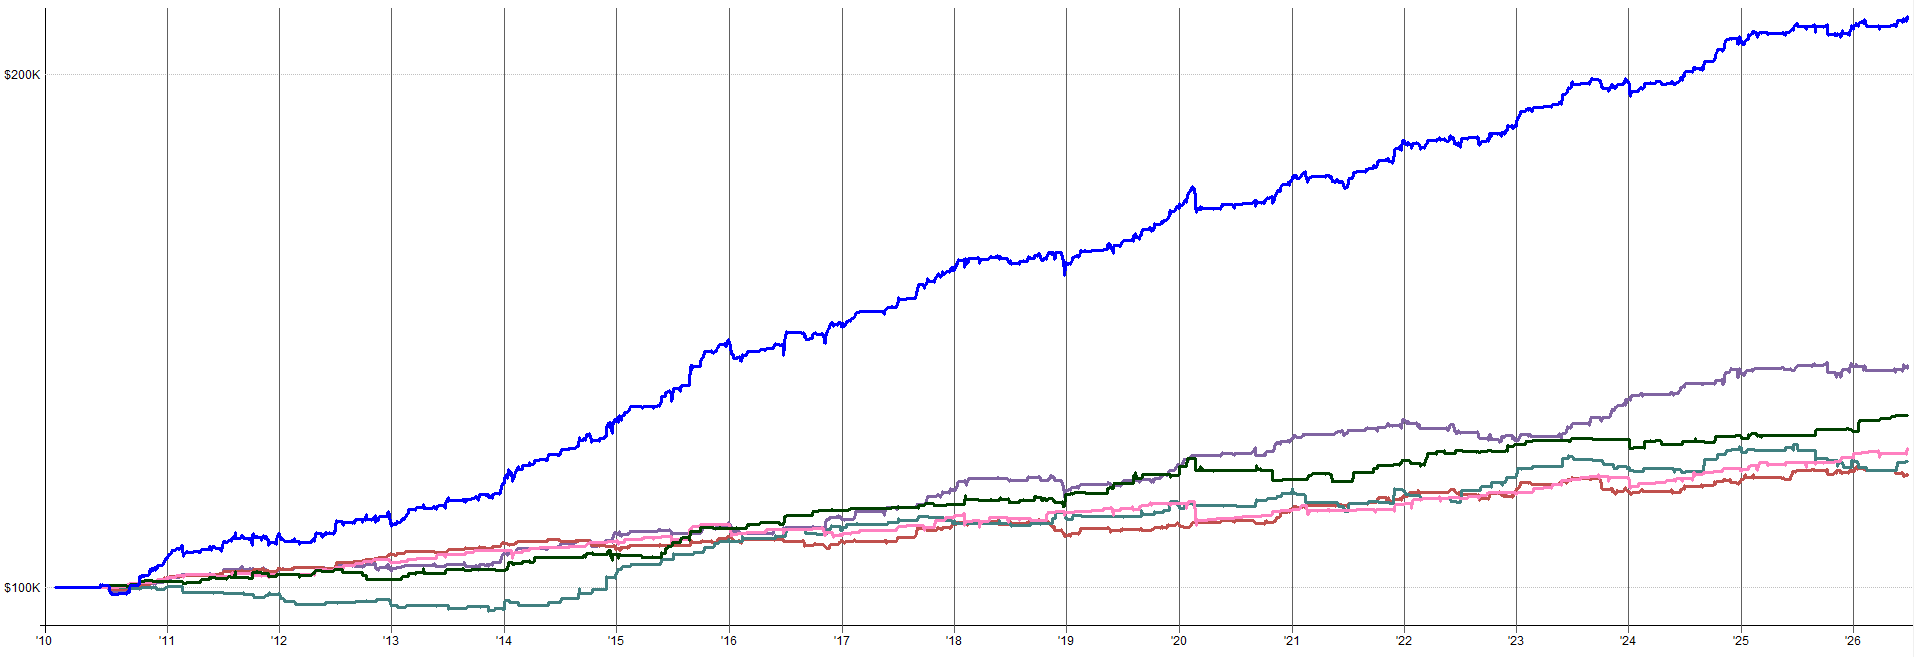
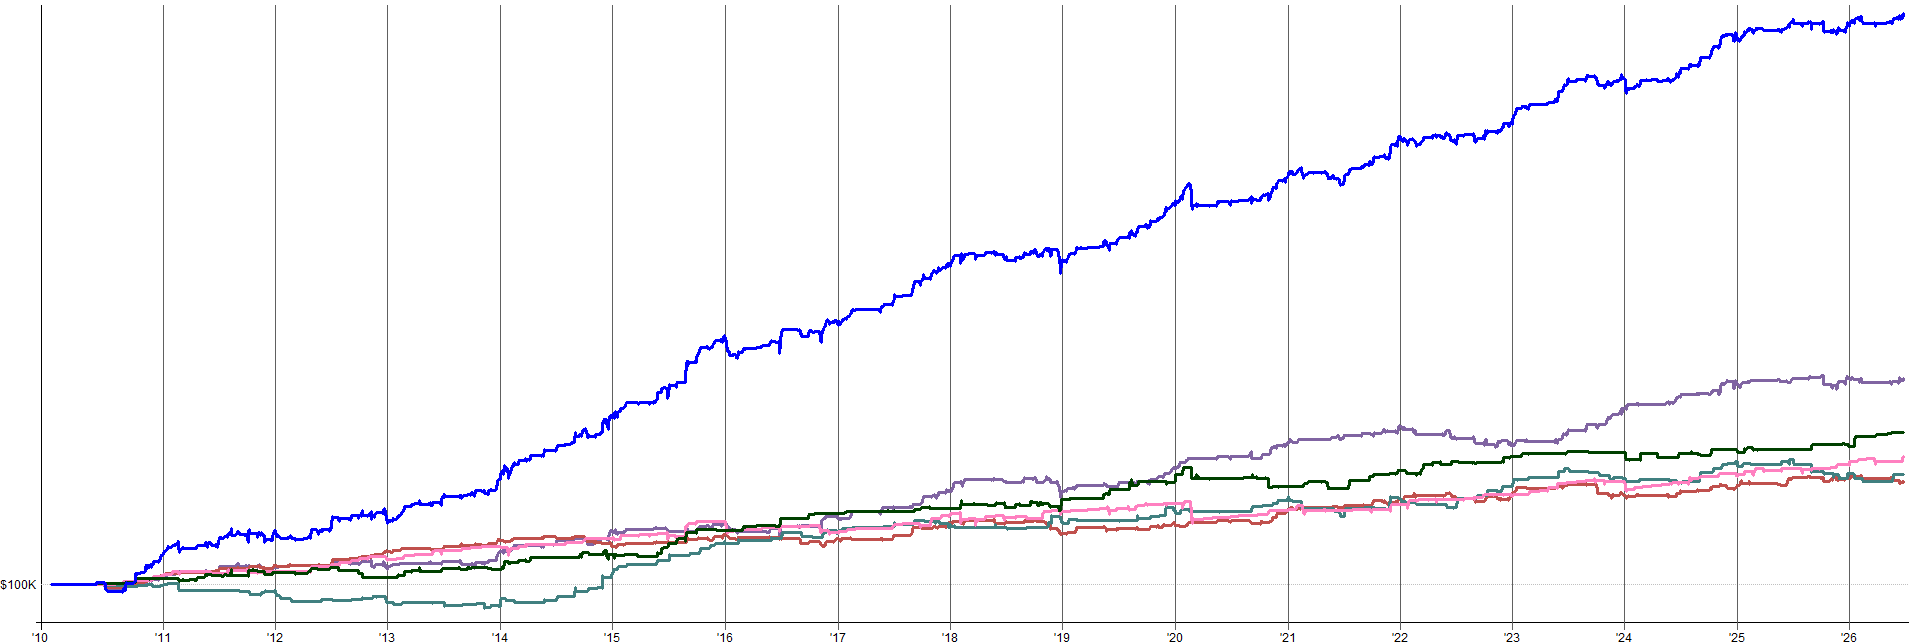
For this comparison, I am going to use one of our momentum systems as the base system. This system trades the Nasdaq 100, S&P 100, and Russell 1000 universes. The results of this system alone since 2010 are shown below.
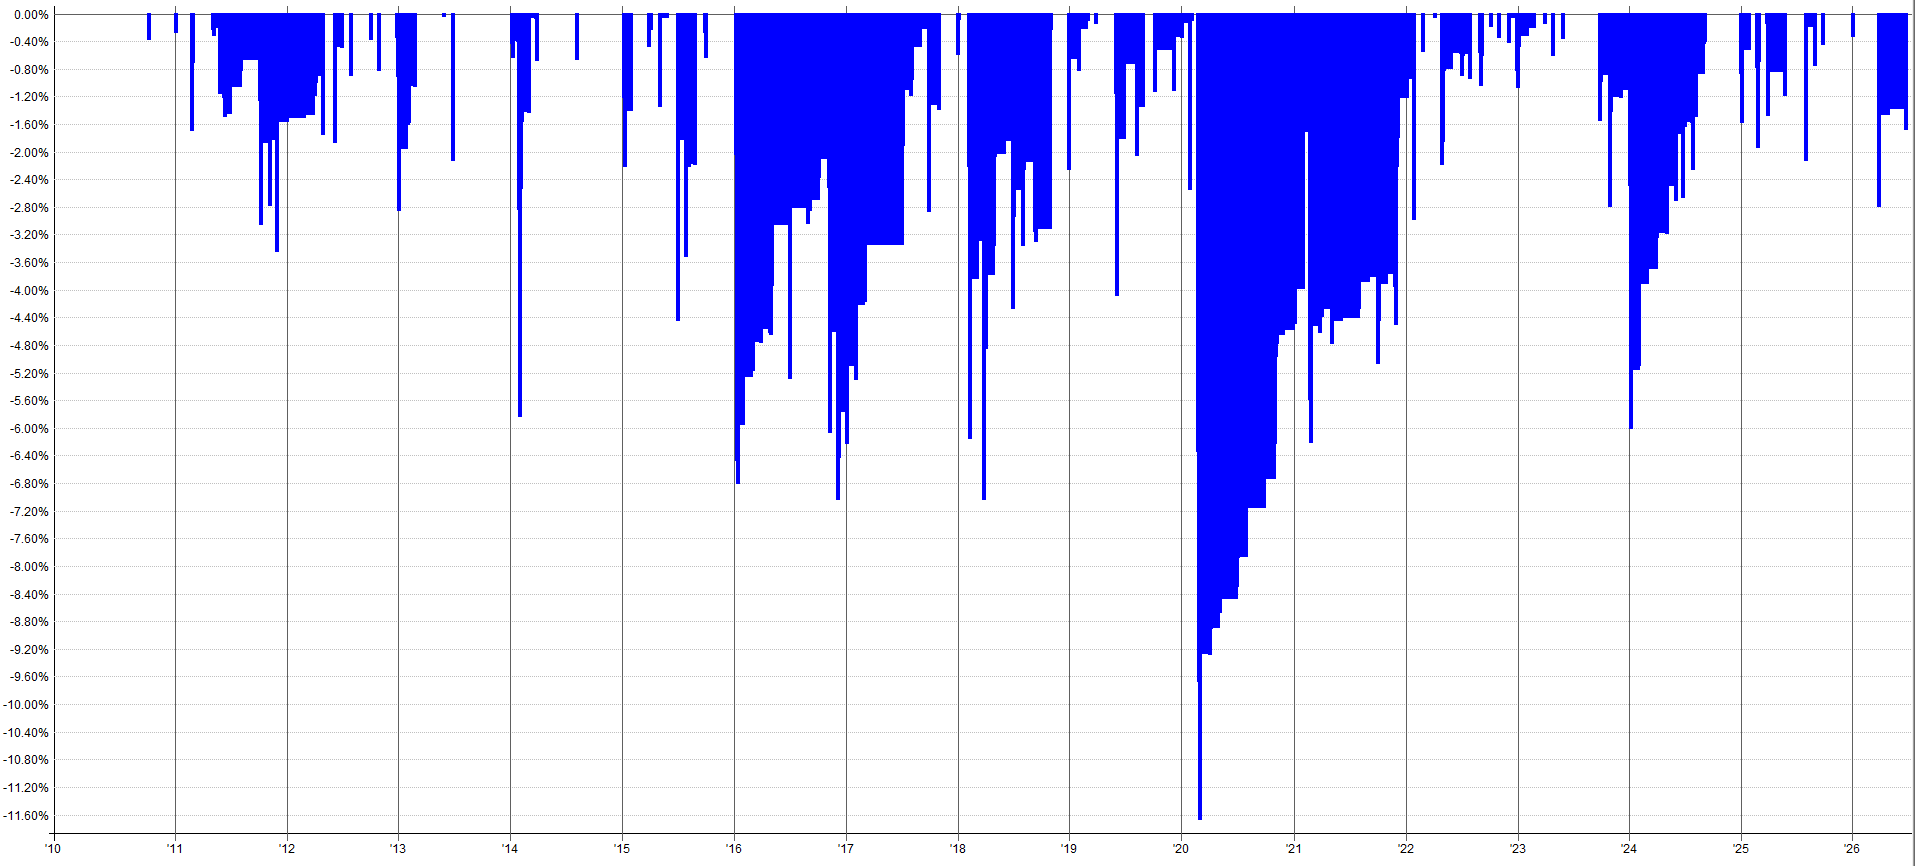
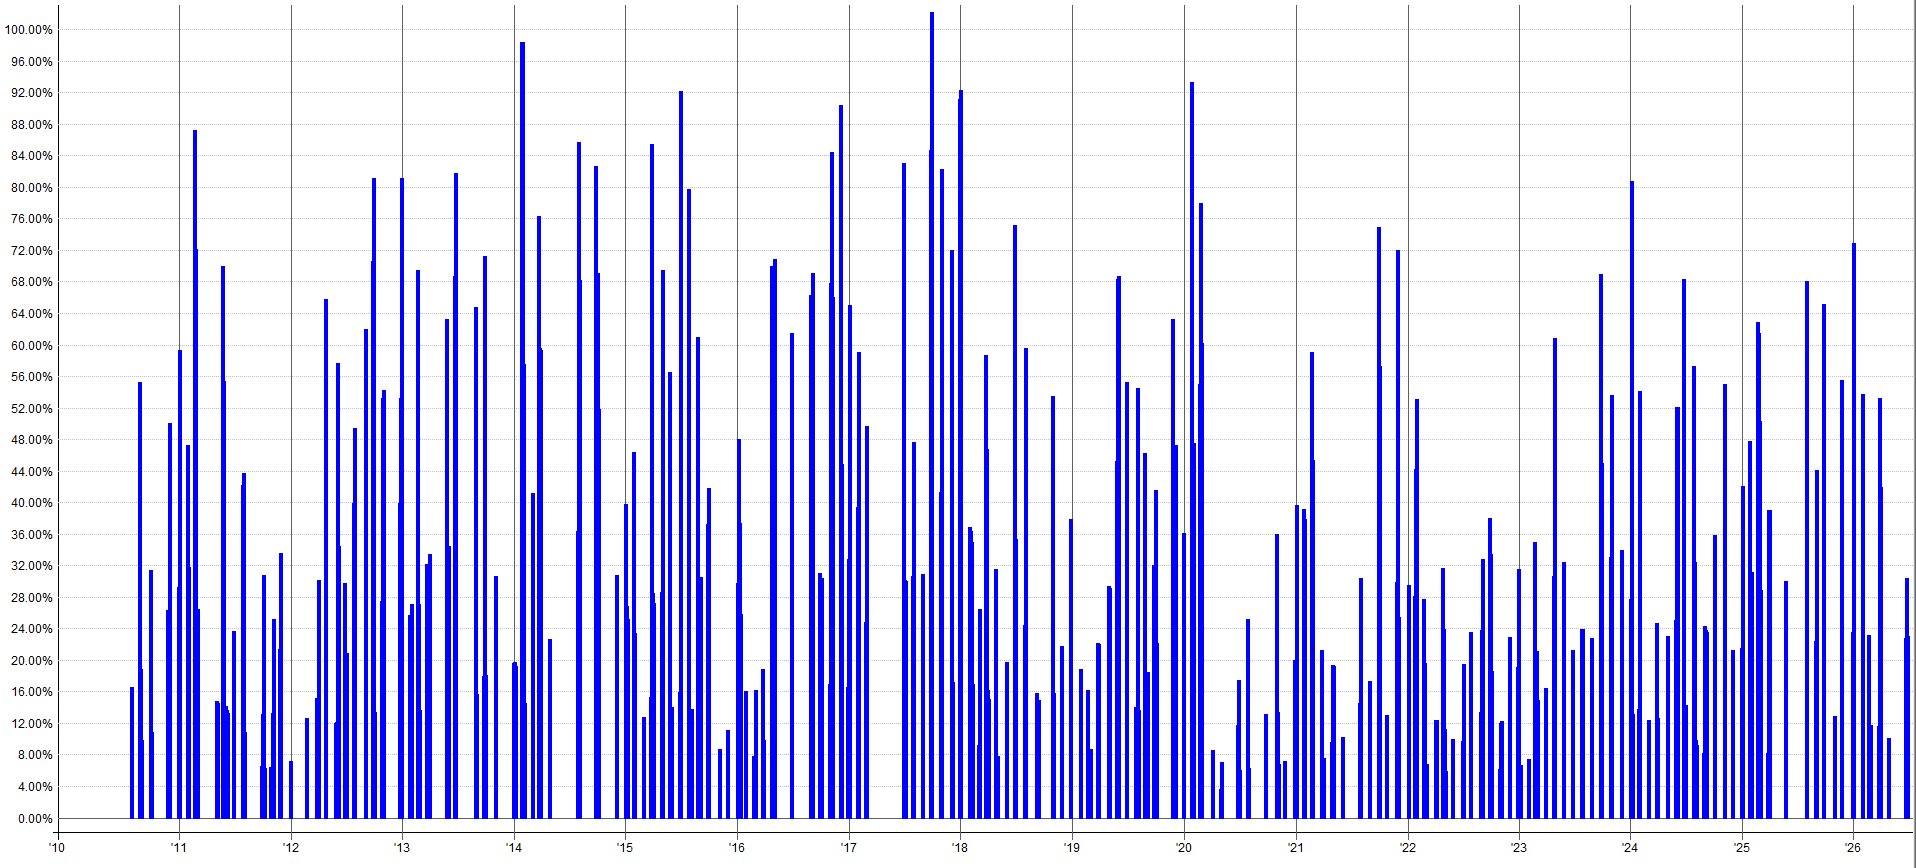
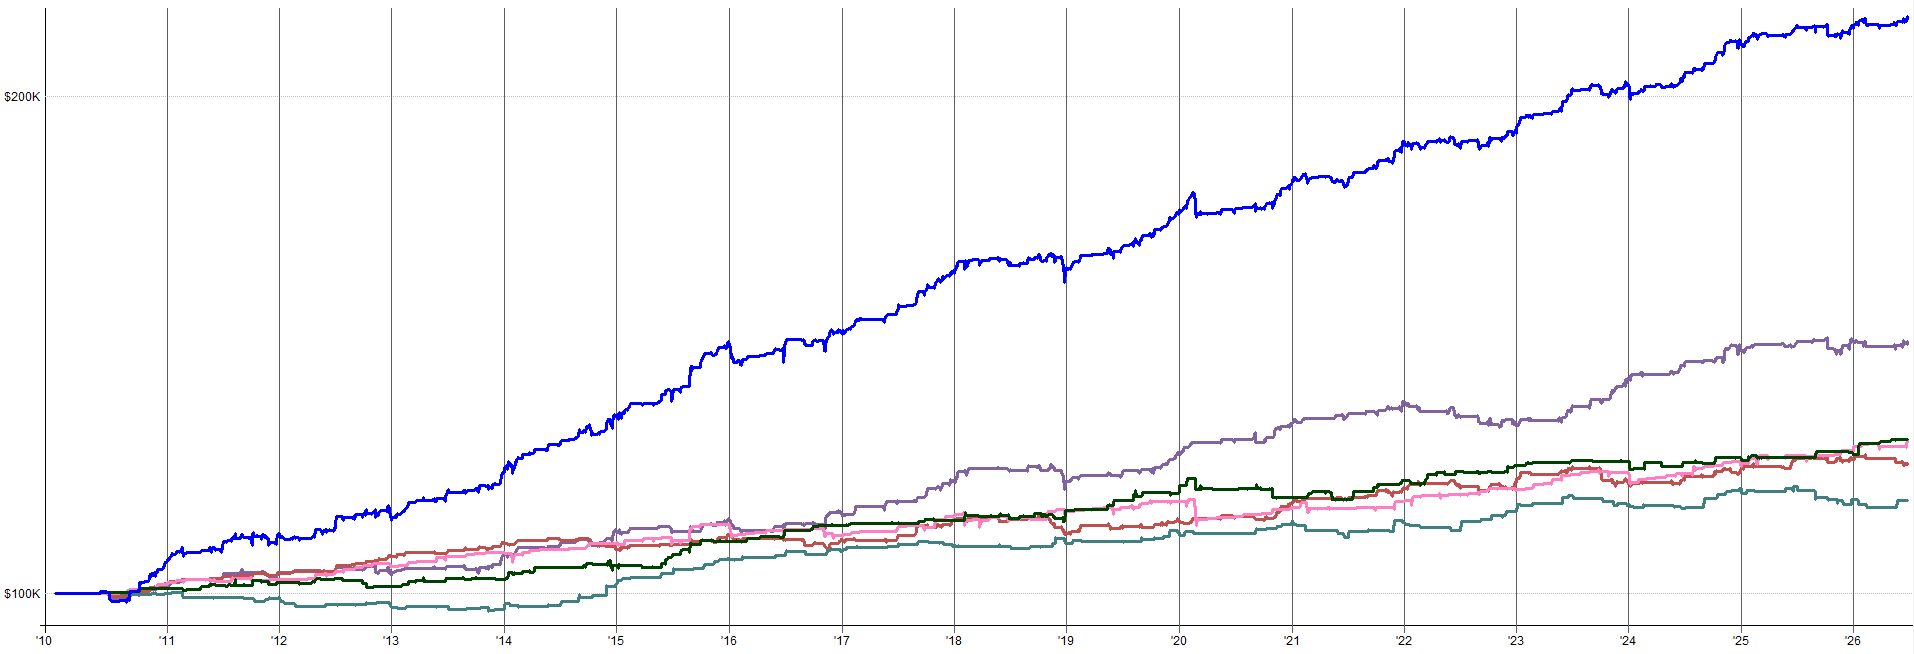
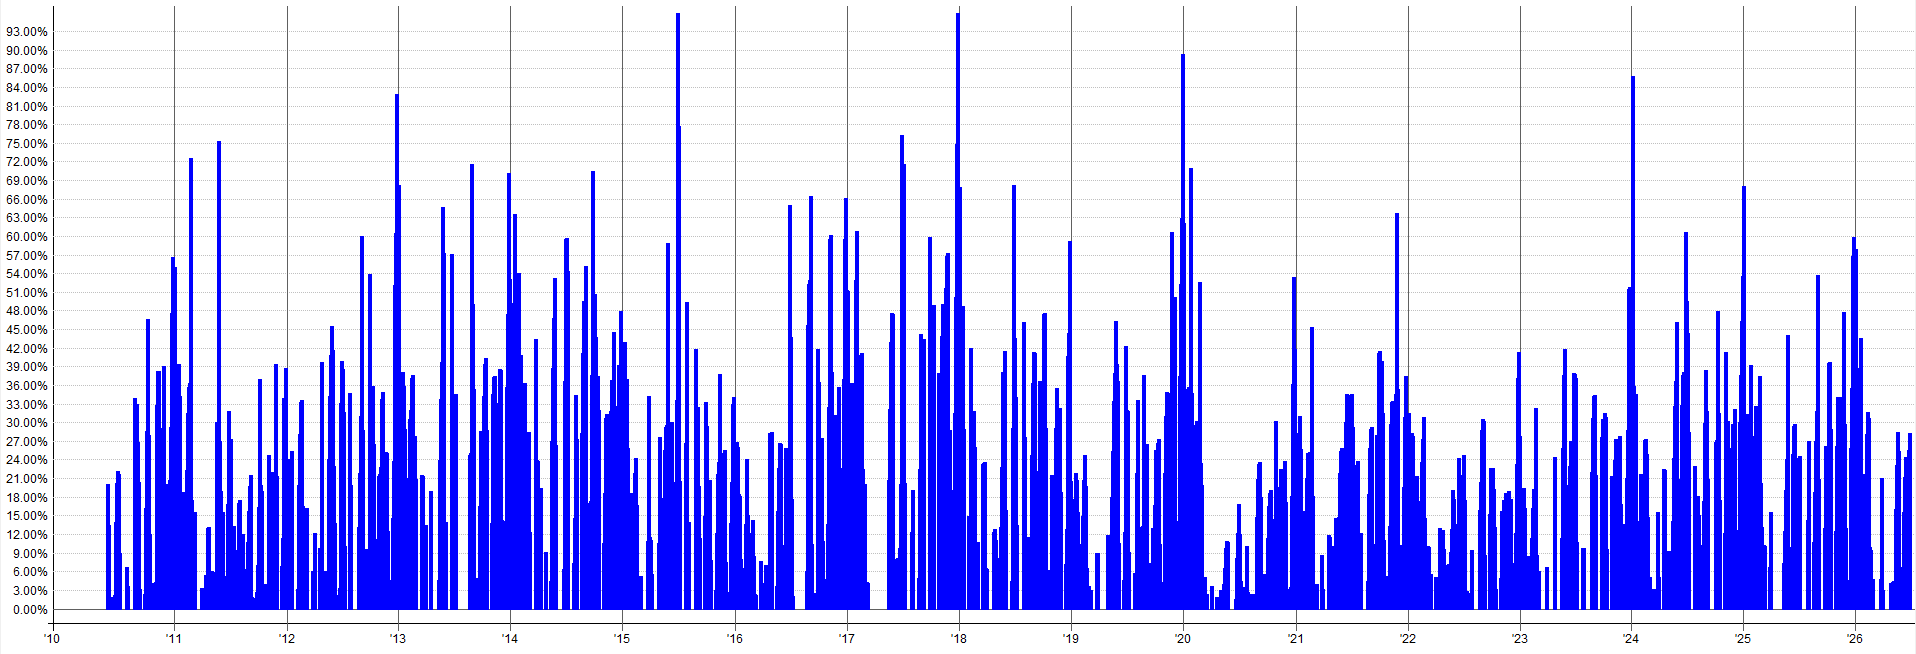
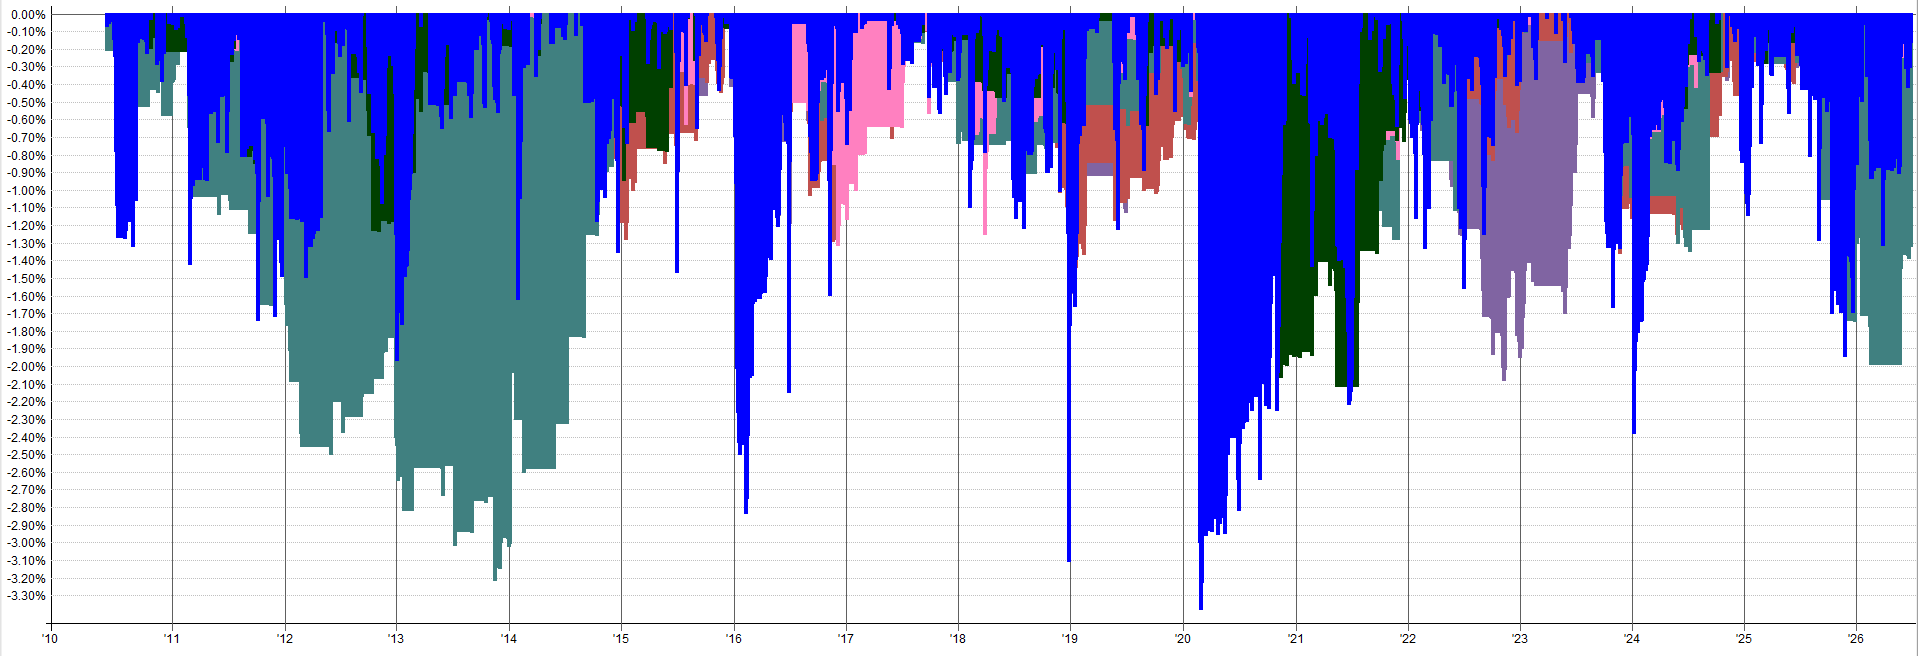
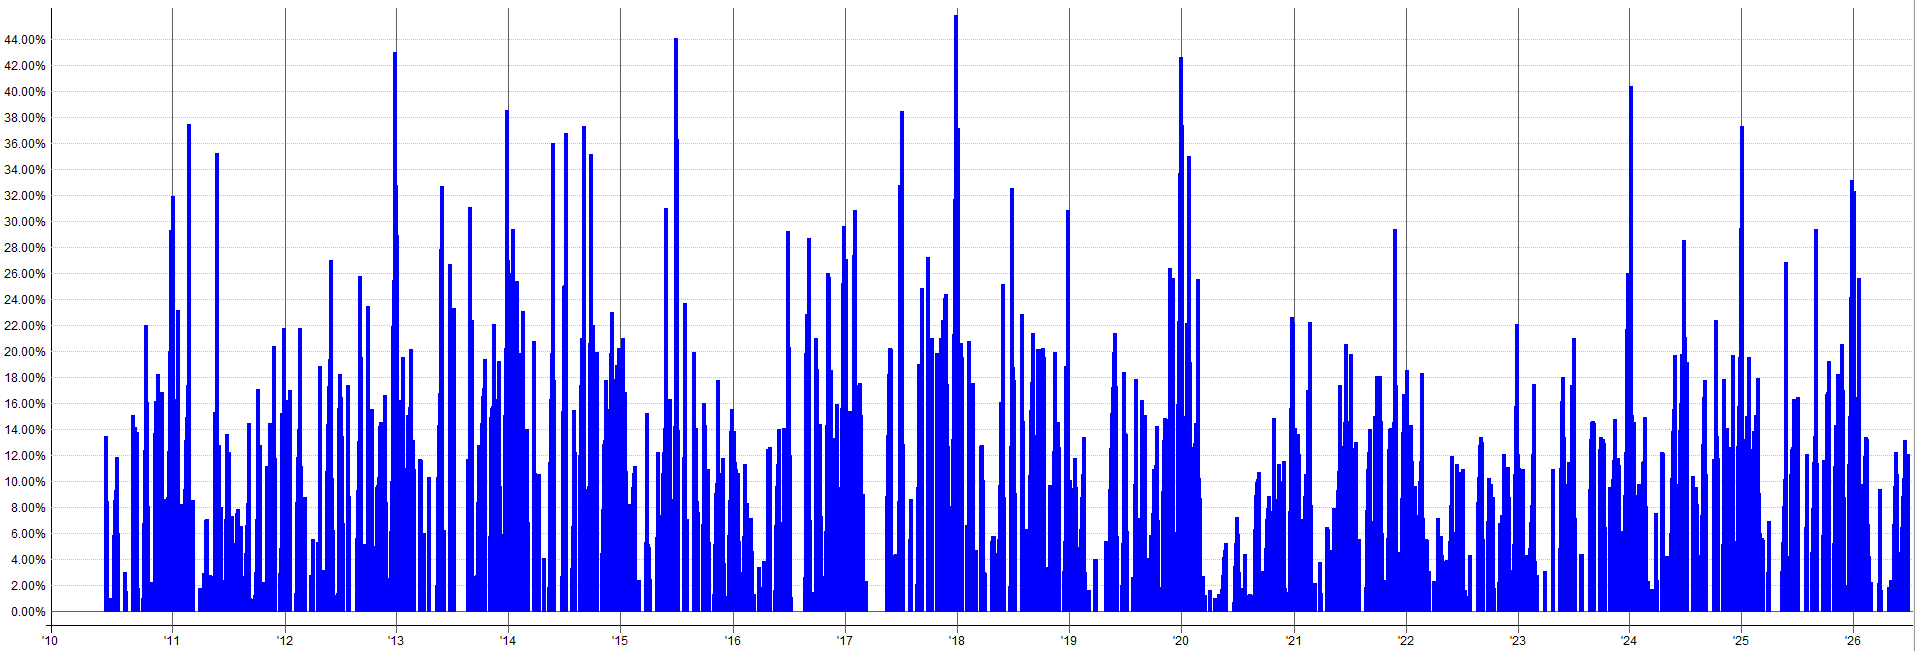
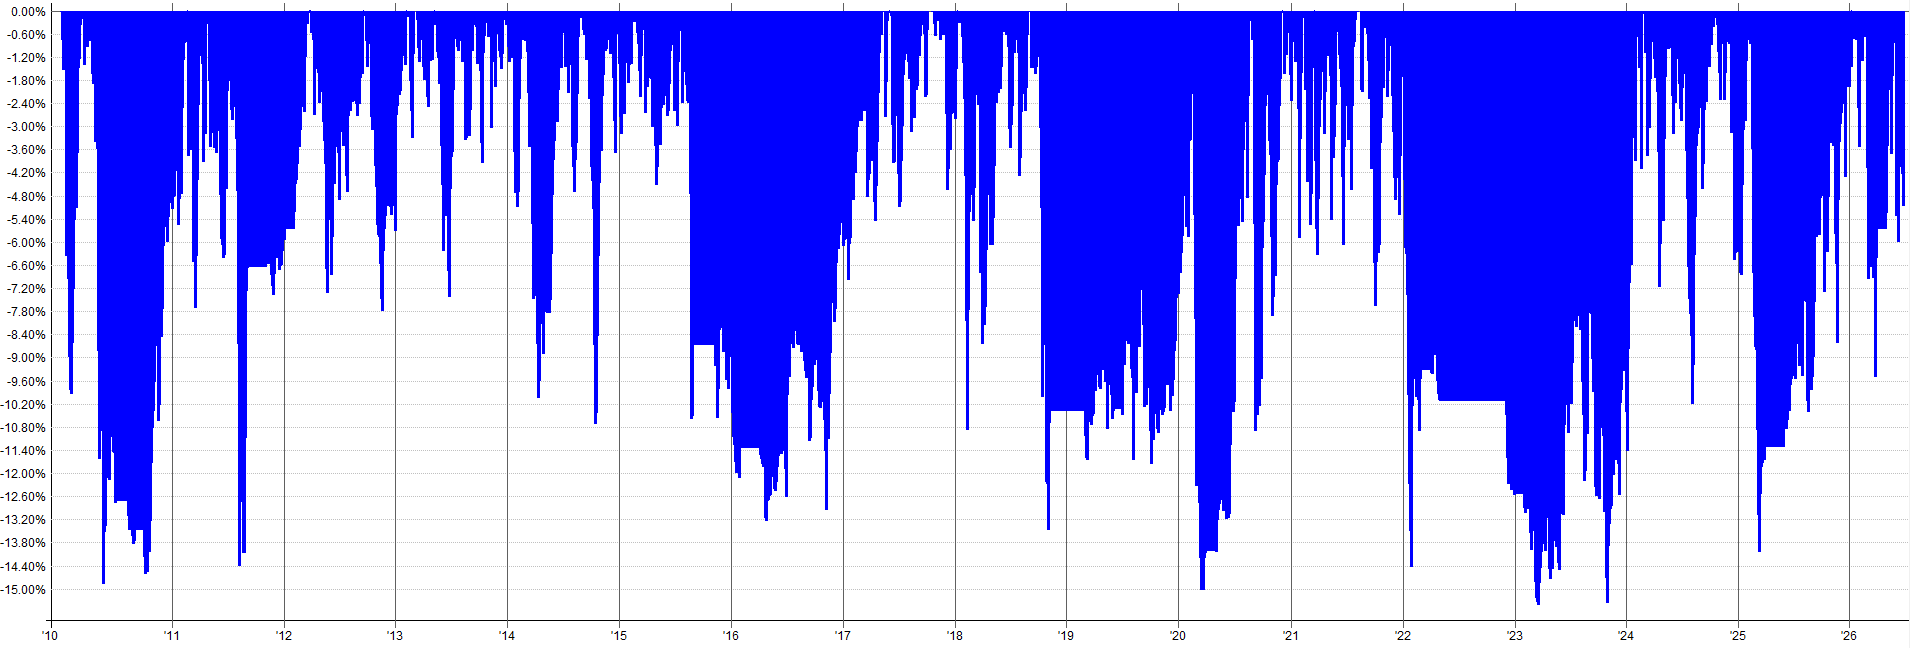
The green, red, and purple lines each represent one of the three universes this system trades. The dark blue line on top is the combined result of the momentum system on three universes. I also show the drawdown profile and exposure profile for the combined momentum results.
US Momentum Base System:
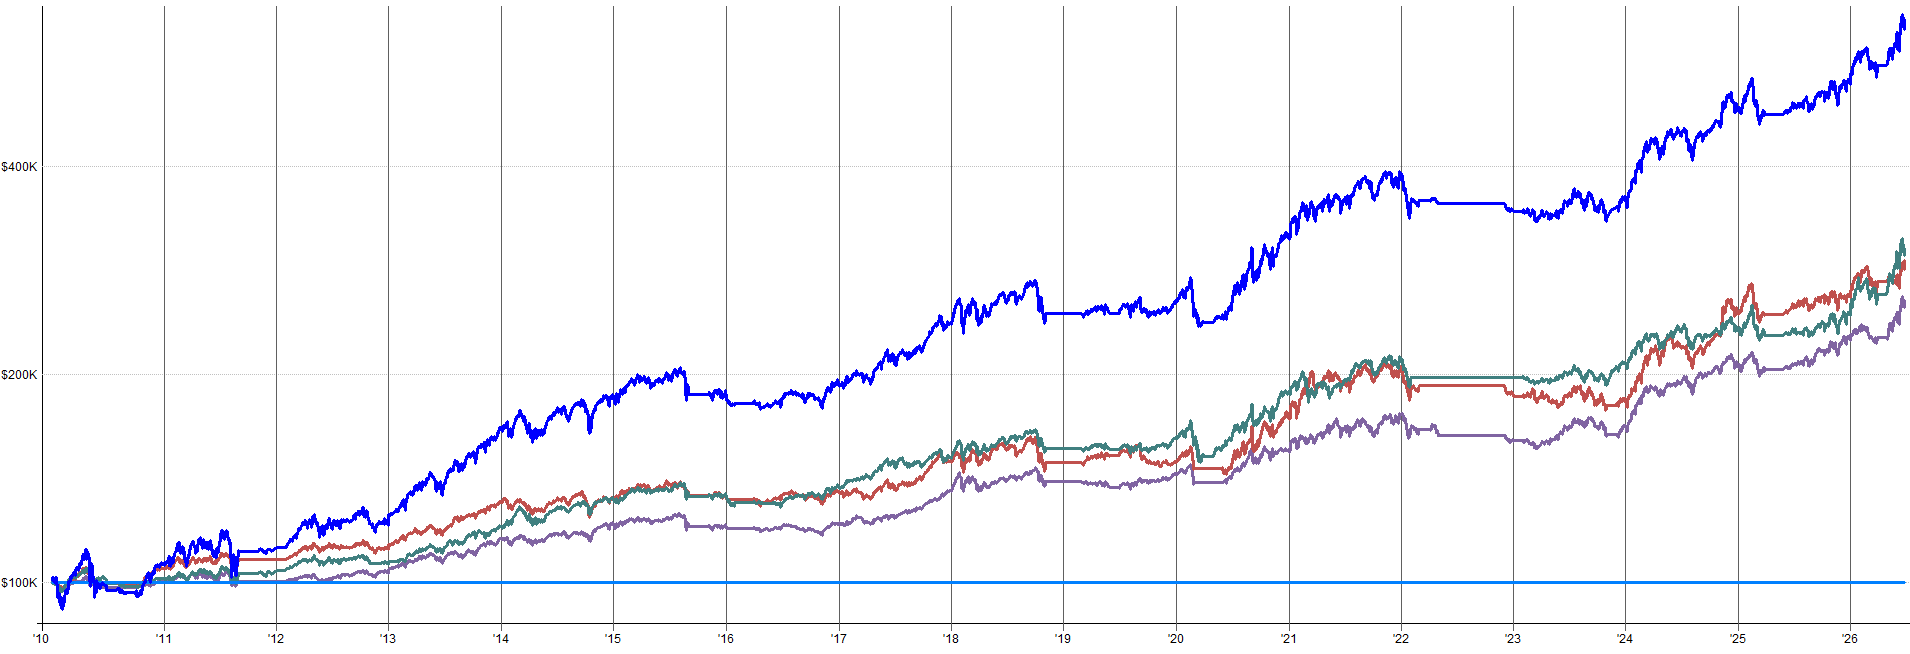

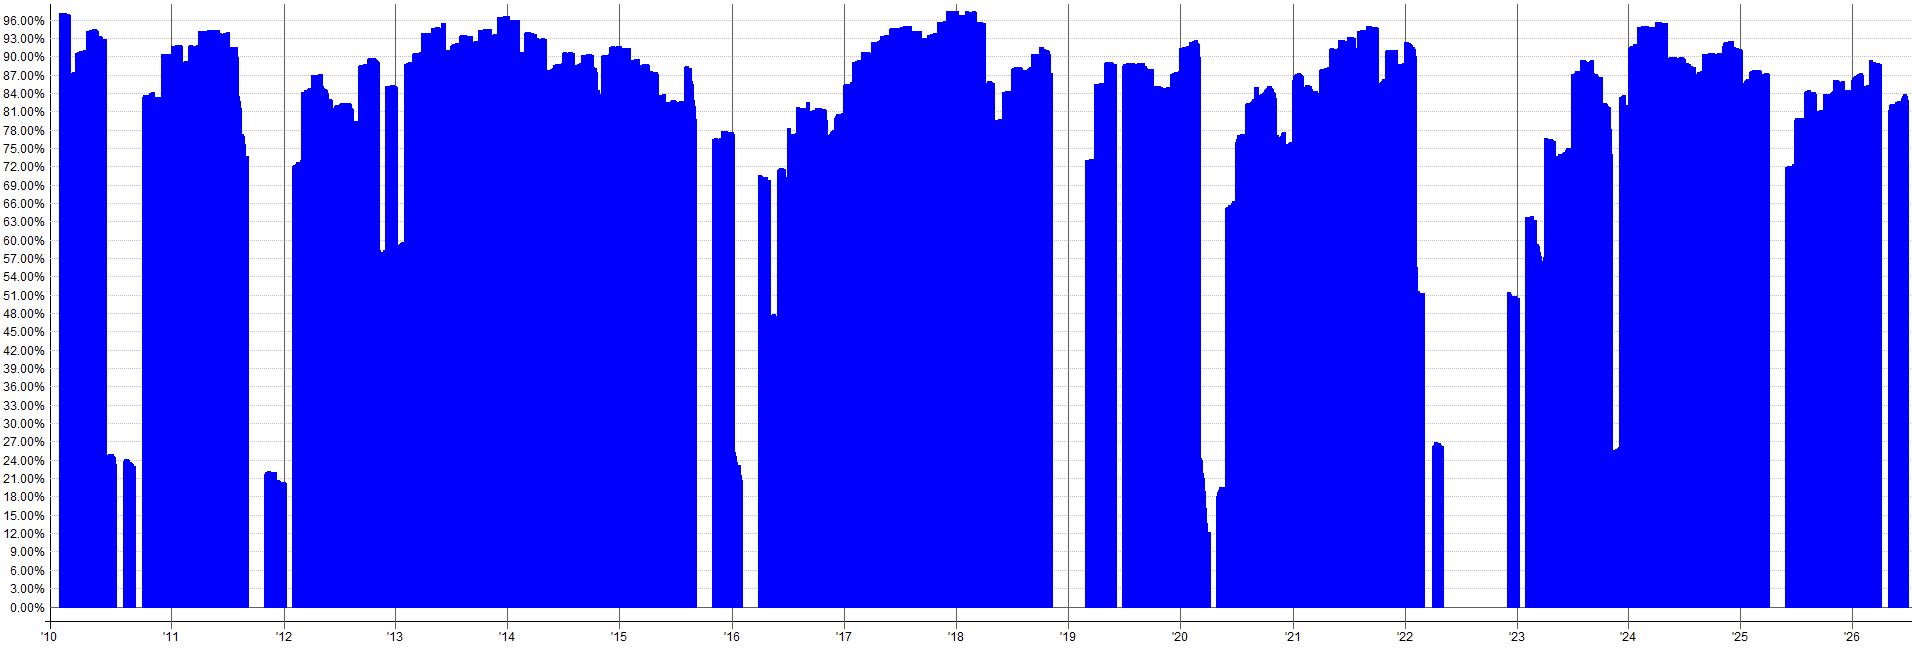
You’ll notice the exposure of the momentum system is generally high, sitting above 80% to 90% for the majority of the time, with some idle periods of no exposure in between. While the mini-portfolio had an average exposure around 5%-10%, this momentum system has an average exposure of 71%.
But what happens when we still trade this momentum system with a full allocation, but also stack the mini-portfolio of five systems on top, sharing the same capital base?
What we will do to start is keep the allocation to the momentum system at 100%, then stack the mini-portfolio on top with an inverse-volatility allocation that caps out at a max exposure around 30%.
But before we stack them together, see the example below of the mini-effect portfolio by itself with an inverse-volatility allocation such that max exposure caps out around 30%:

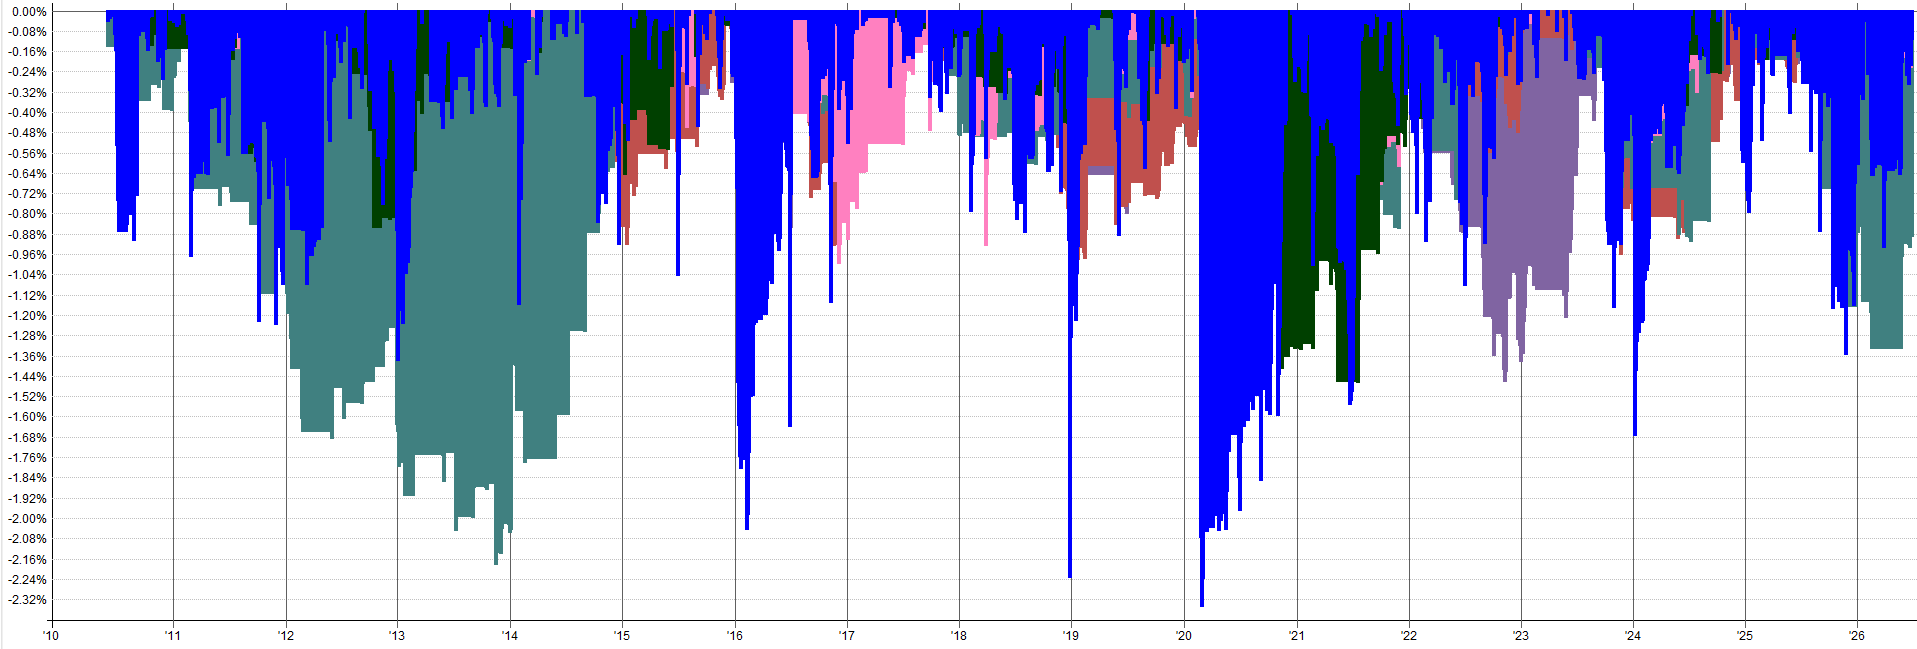
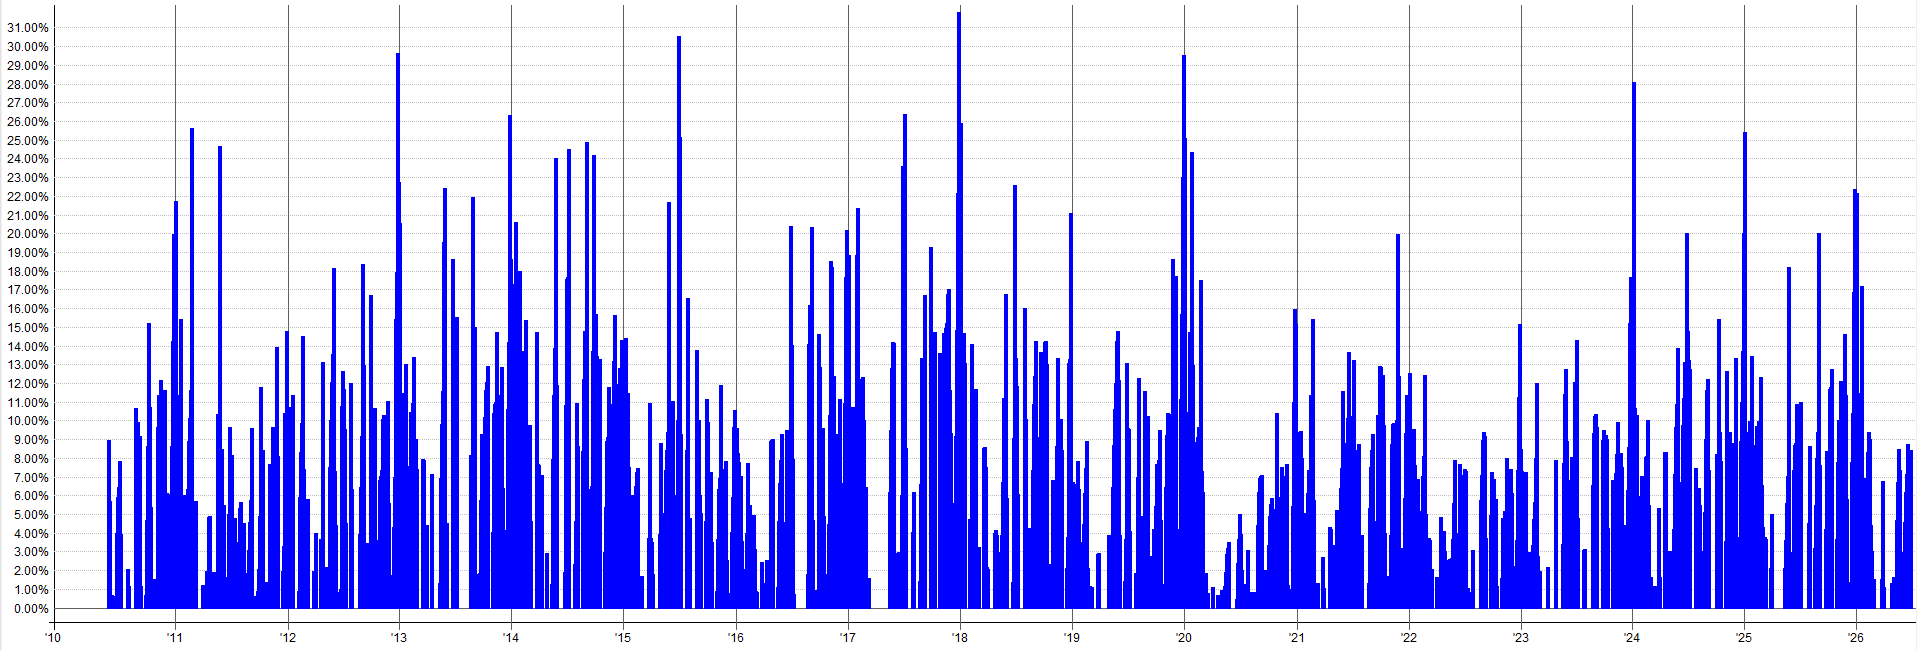
This leads to a CAGR around 3.3%, a max drawdown of 2.35%, and a volatility of 1.96%.
When we stack this exact mini-effect portfolio allocation on top of the existing US momentum system with 100% allocation, we should end up with around 130% max exposure.
Let's see what happens.
US Momentum Base System + Market Effect Mini-Portfolio (130% Max Exposure):
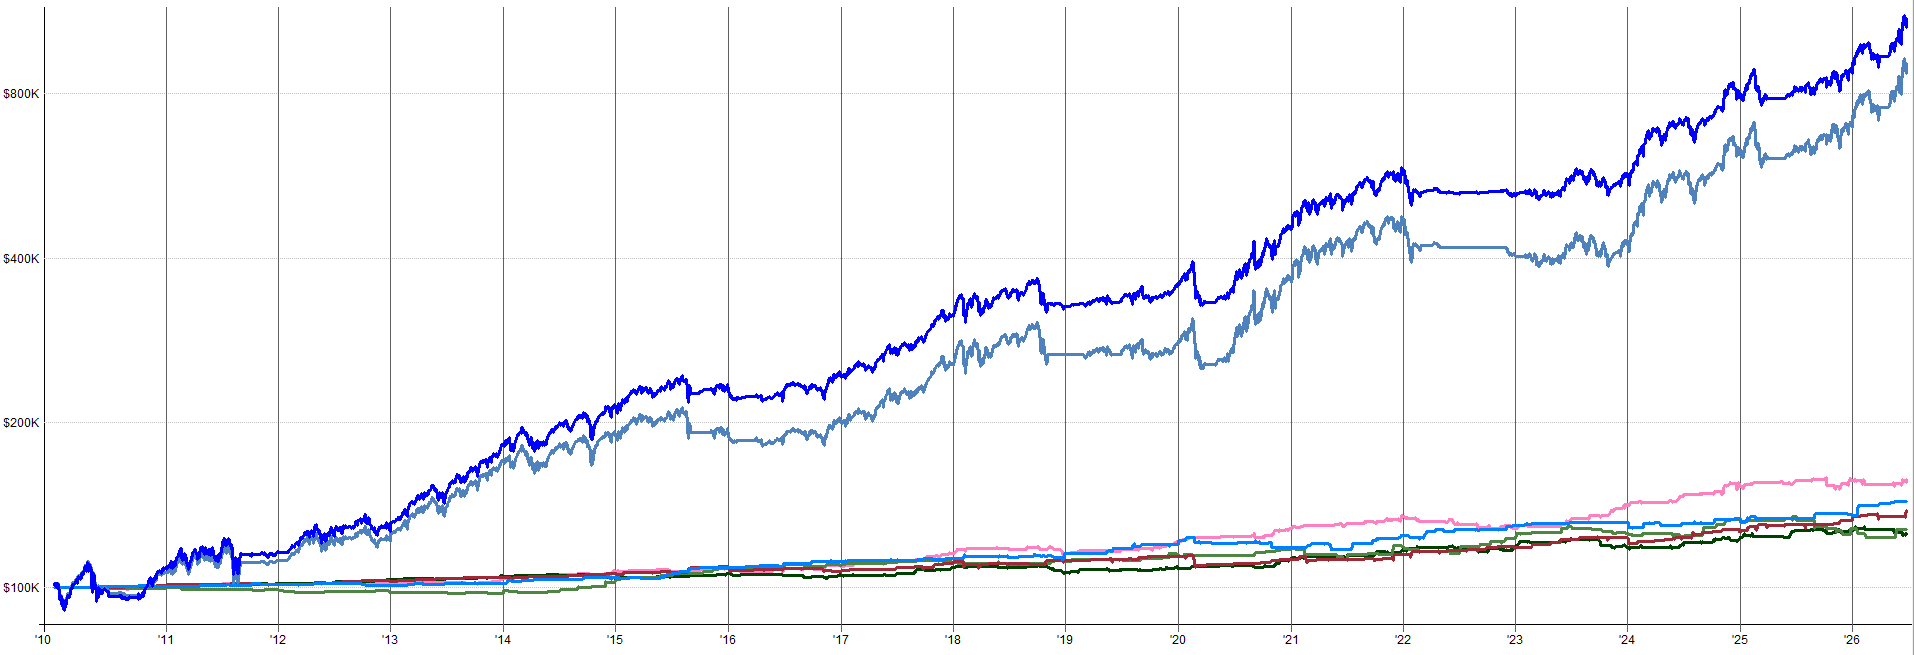

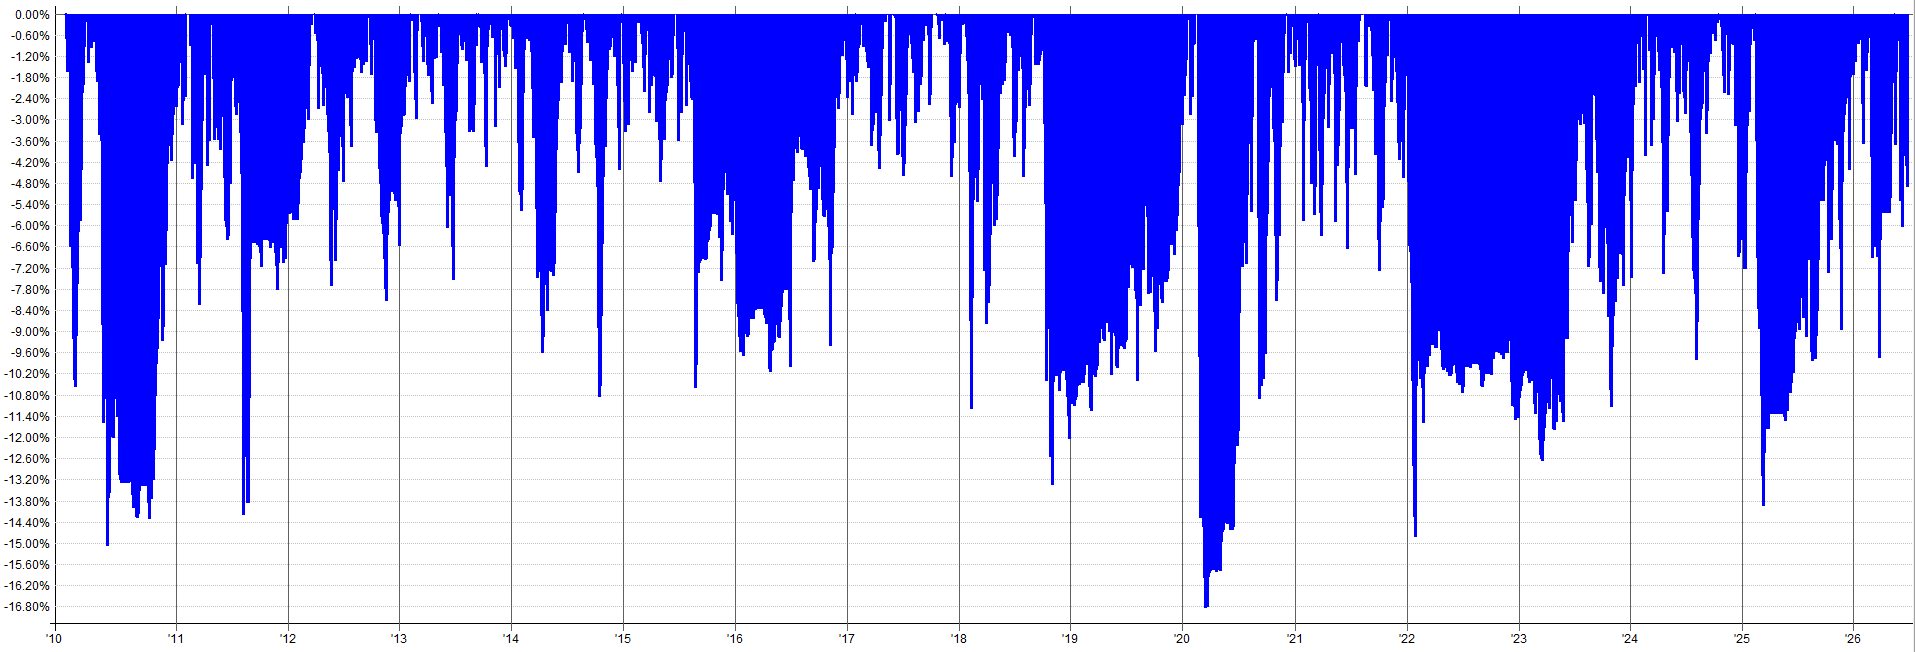
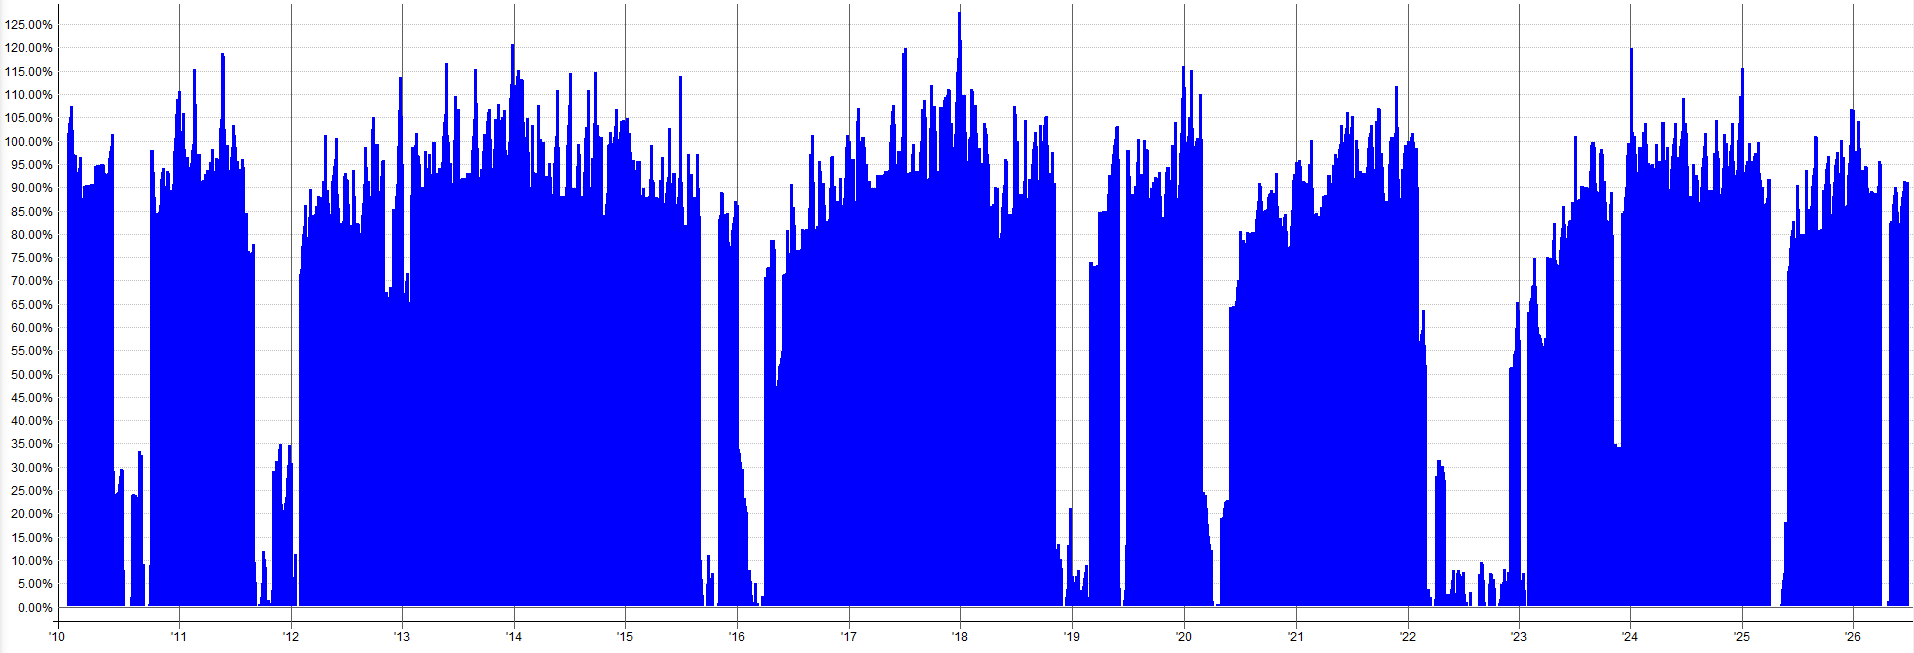
That’s exactly what happens. Max exposure of the US momentum system goes from 97% to 127% (an increase of 30%). The CAGR increases linearly from 12% in the US momentum base system to 15.6% in the US momentum system + mini-portfolio result (an increase of around 3.56%).
So the return and exposure results are additive.
What’s interesting is that volatility goes from 14.78% in the US momentum base system to only 15.58% in the US momentum base system + mini-portfolio. An increase of only 0.8% in volatility, which is interesting because the mini-effect portfolio that was added on top has 2% volatility.
Also, the US momentum base system max drawdown was 15.43% and the mini-portfolio max drawdown was 2.35%. When added together, you would expect a max drawdown of ~17.7%, but that’s not how the portfolio effect works. The resulting combined max drawdown was 16.86%, an increase of 1.43% rather than the full 2.35%.
Also, the momentum base system had an average drawdown of 5.47% and an average drawdown length of 95 days. After adding the mini-portfolio on top, the average drawdown drops to 4.72% and the average drawdown length drops to 81 days.
So long story short, adding this market effect mini-portfolio on top of an existing system (or on top of an existing portfolio of systems) has the capability to stack more returns for a disproportionately smaller amount of increased volatility and drawdown. It smooths out the drawdowns such that, on average, they are not as deep or last nearly as long.
That was the whole purpose of building this mini-portfolio. To create a bunch of simple systems that capture a market phenomenon that has a reason for existing, in a simple and clean way.
Then take those systems (which have a lower return by themselves) and stack them on top of an existing portfolio to generate higher returns for a limited amount of extra downside.
Sure, we take on more exposure risk, but we get compensated for that in returns without having to take on the full downside effects, thanks to the portfolio effect of stacking non-correlated return streams.
And if 130% max exposure isn’t enough for you (remember, 95% of the time the exposure will be significantly below 130%), then we can bump up the market effect mini-portfolio allocations such that the combined result including the US momentum base system peaks at 150% max exposure instead of 130%.
US Momentum Base System + Mini Effect Portfolio (150% Max Exposure):
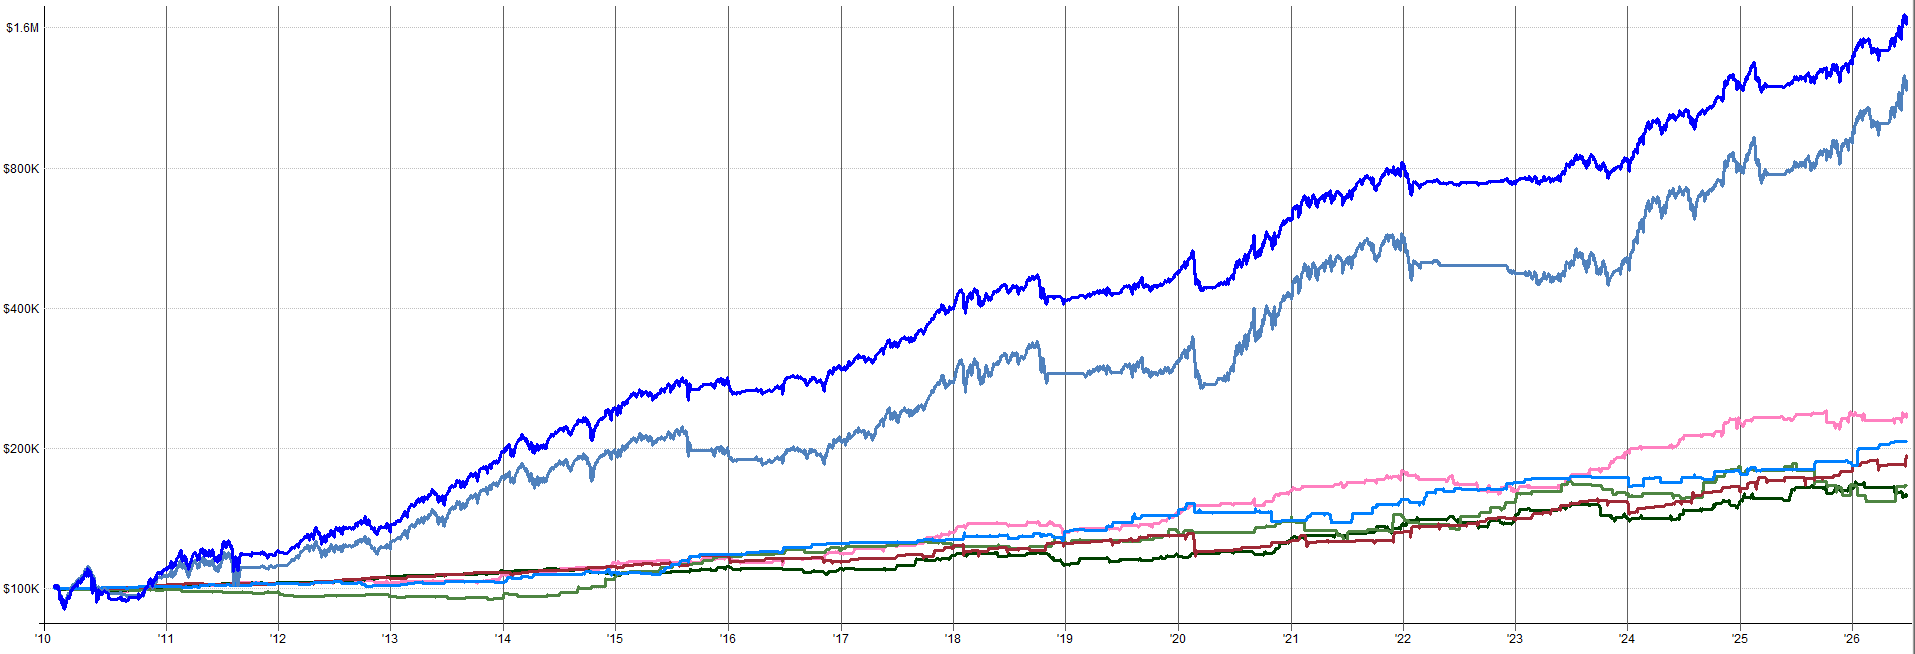

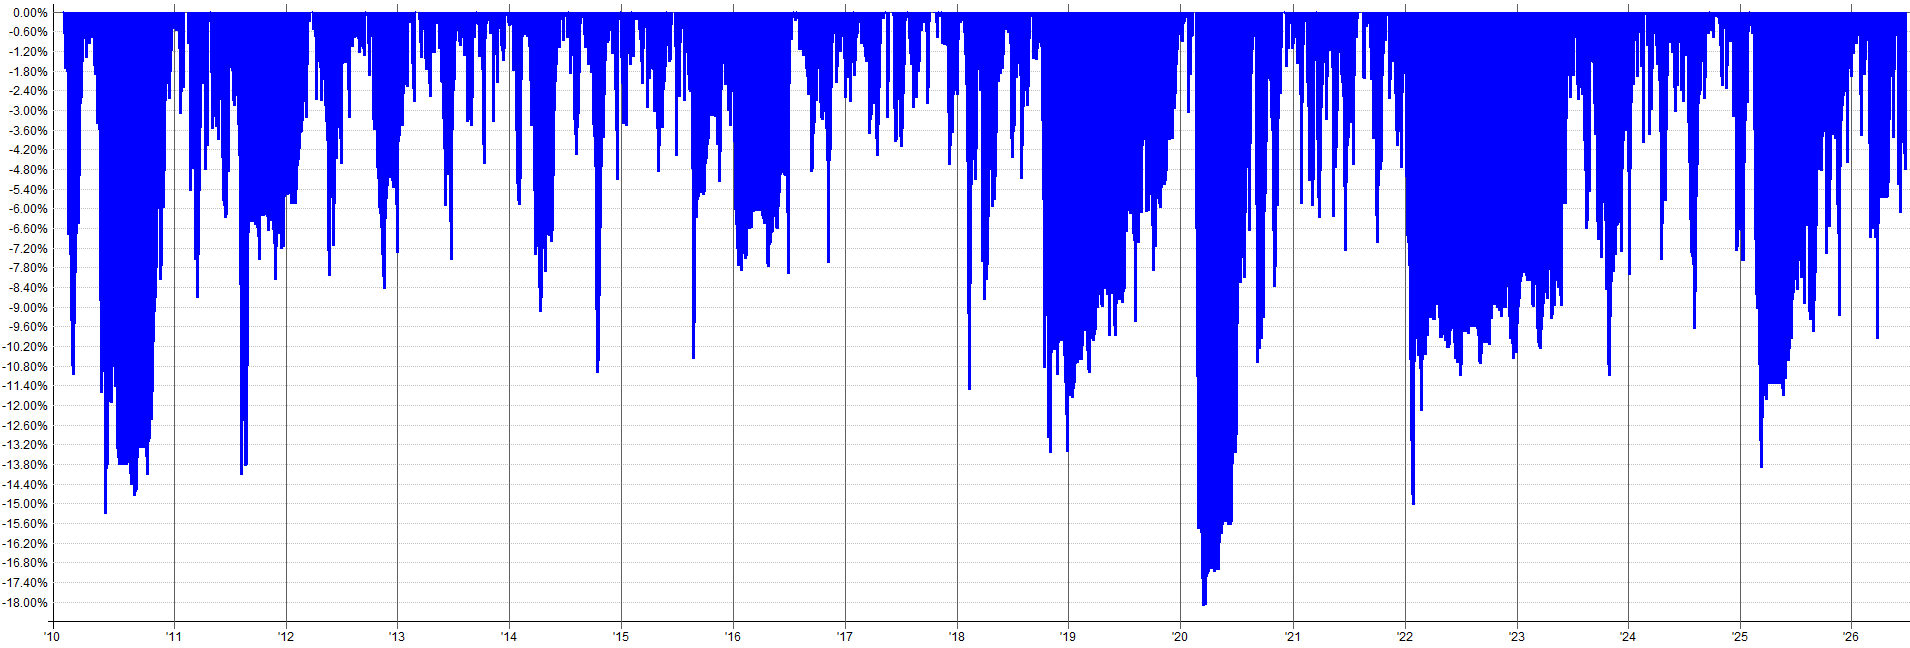
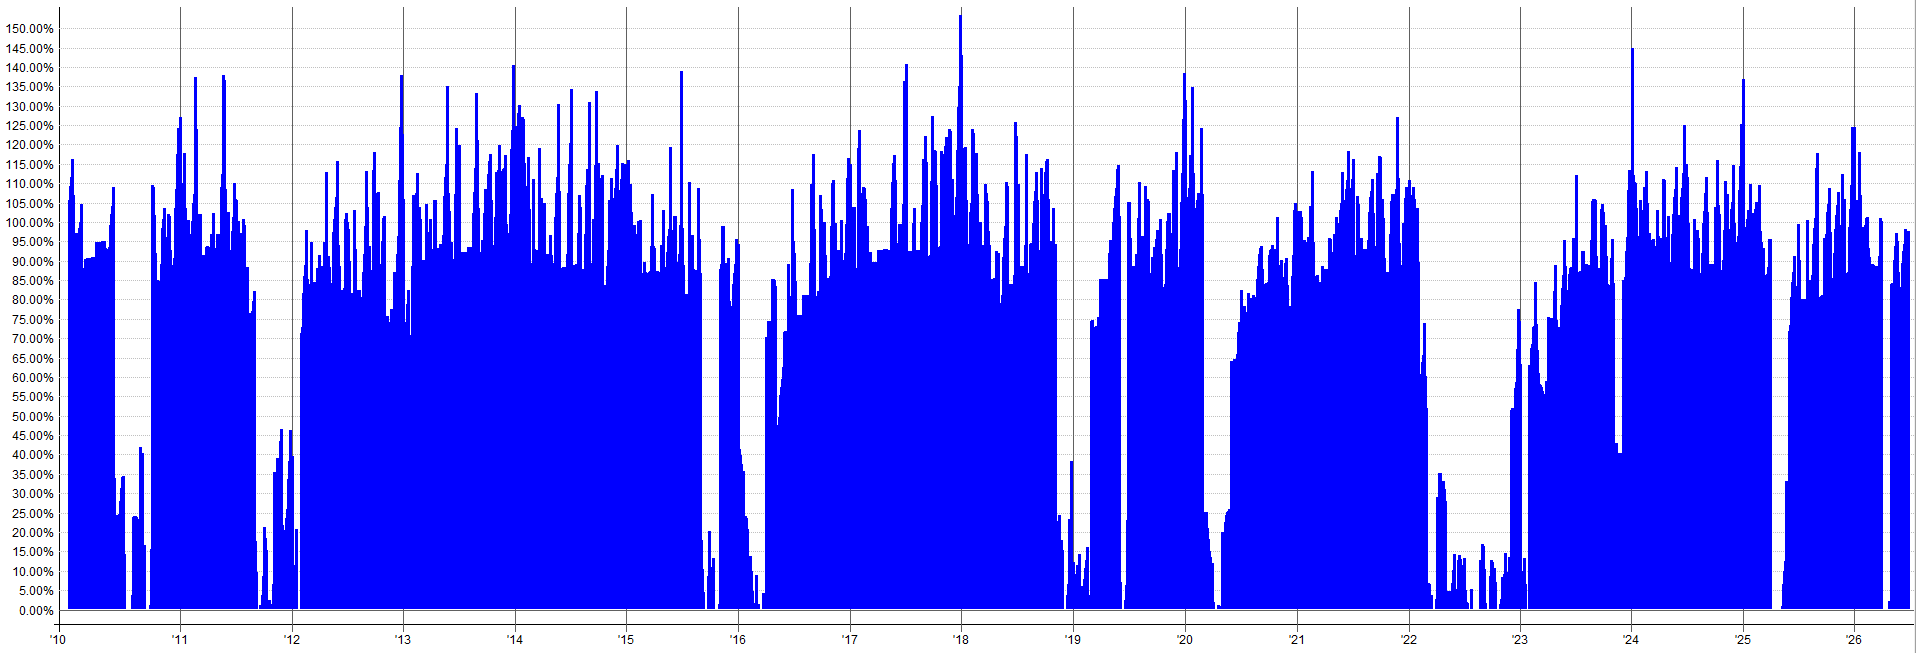
The combined result now tends to spike to a max exposure between 115% and 130%, with only very rare instances climbing close to 150% max exposure.
If we look at risk-adjusted metrics, again we are further improving across the board. The US momentum base system originally had a Calmar ratio of 0.78, which climbed to 0.93 when the market effect mini-portfolio was added with a max exposure of 130%. Once max exposure was allowed to reach 150%, the Calmar ratio climbed further to 1.03. Similar story for Sharpe, going from 0.85 to 1.01 to 1.13.
Average drawdown and average drawdown length again shrink further. The US momentum base system originally had an average drawdown of 5.47%, which dropped to 4.72% when the market effect mini-portfolio was added with a max exposure of 130%. Once max exposure was allowed to reach 150%, the average drawdown dropped further to 4.35%. Similar story for average drawdown length, going from 95 days to 81 days to just 59 days.
Again, this further shows that stacking this market effect mini-portfolio on top of an existing portfolio can be a great way to generate higher returns for a limited amount of extra exposure/downside risk.
Live Trading Expectations:
What to expect over the course of the next year
Let me set some expectations about what including this mini-portfolio is like, so you don’t give up on it 2 months in.
The mini-portfolio, on average, will be scaling into a position maybe once a week or every other week. Roughly 300 orders filled a year, but remember most trades scale in, so that’s more like 60 or so actual trade ideas a year once you normalize for the scaling.
In between the calendar effects (which is most of the year), you are watching nothing happen. You will sit through long stretches where the only system that has placed any orders in a month is Turnaround Tuesday (because it tries to trade every week), and even those orders aren’t filled that often because specific conditions must be met for those orders to get filled. This is all normal. Patience is key.
Also, any single year can be flat or down with this mini-portfolio. The effects play out over a multi-year horizon, not a single calendar year. There have been many stretches of time where the mini-portfolio has been flat in terms of returns for 1-2 years.
You should expect this can, and will, happen. That’s why we trade many systems. One system may be having a rough year, but the market effect mini-portfolio makes some good gains. Other times, the market effect mini-portfolio has a flat stretch of returns, but your other three momentum systems pick up the slack.
Keep Sensible Sizing:
The whole purpose of me developing this market effect mini-portfolio was for a specific need I had. I wanted to be able to “fill in the exposure gaps” within my portfolio to make it more capital-efficient. Meaning, my portfolio has less idle capital lying around and being lazy.
The idea was that I’d make a handful of systems that have very low exposure and are only in the markets for a short period of time. Then I could take this combination of low-exposure systems and stack them on top of my existing portfolio without scaling the allocations to my existing portfolio down. The market effect mini-portfolio would then be using the idle cash on the edges of my portfolio exposure when lazy capital is lying around to generate an extra few percent return per year.
Occasionally, the existing portfolio will already be fully exposed when the market effect mini-portfolio wants to use capital, so I would allow it to take on small amounts of leverage to fill the positions it wanted. So if you plan to do the same, we should briefly discuss the dangers of using too much leverage.
Do not run this market effect mini-portfolio with 100% allocation on top of your already 100% allocated portfolio of other systems. Keep the allocation somewhat sensible. Leverage is just as much your enemy as it is your friend.
Consider capping the market effect mini-portfolio allocation to somewhere between 10% and 50% allocation on top of what you already have. Pick up an extra 1%-5% return by running these systems with small to modest levels of leverage, and call it a day.
Do not run it hot trying to max out returns and then blow up during the next Covid-like event.
Operational Reality:
Five systems that scale in and out can mean 10+ orders at a time to track, place, and manage when multiple systems kick on at the same time. Trying to fill the exposure gaps in your portfolio to become more capital-efficient does come with some more operational complexity. You need to decide for yourself if the extra couple of percentage points of CAGR are worth that extra workload to you.
More workload means more room for mistakes, more commission costs, and potentially more stress/headaches. If you plan to trade these systems by hand, it could become a real burden.
There may be weeks where you hardly have anything to do, then a few days where you’re placing hundreds of orders and most aren’t even filled, which could get frustrating. And frustration almost always leads to mistakes, at least for me.
This is why some sort of full or partial automation is so crucial to help you manage the operational load. I am not fully automated, but I only have to click a few buttons every morning to place my trades. It doesn’t matter if I have 2 systems or 200, it’s the same amount of work.
This is what has allowed me to branch out into systems that scale in and out, because my systems can handle the extra order flow with no issues.
Conclusion:
The Market Effect Research series has now been five articles long. The first four articles built five standalone systems on top of four distinct calendar effects:
Holiday effect in equities
Holiday effect in energies
Turn of the Month effect
Turnaround Tuesday effect
This article, which combined everything together into a mini-portfolio.
Each of these systems captures a phenomenon in the markets that has a good reason to exist and has persisted through time. The reason why the institutional players haven’t completely taken the PnL from these effects is simply because they have better things to focus on. These effects are not appealing to them: holding periods are too long, returns are too low, you have to hold beta exposure, etc.
But this is perfect for a retail trader. These are the exact things that we can trade and make money on over time. The low average exposure is actually beneficial to us, as we can stack these low-exposure systems on top of an existing portfolio to press the portfolio exposure a little higher during periods of time that have historically shown higher-than-average positive returns.
Run this market effect mini-portfolio as an overlay on top of a base system/portfolio you already trade, and it becomes a real lift to your PnL that compounds a little extra on top of whatever you are already doing. Hopefully that thought process makes sense.
Let me know if you have any questions.
Happy trading!
Disclaimer
The information and services provided by the Systematic Trading with TradeQuantiX newsletter are for educational and informational purposes only and do not constitute financial advice, investment recommendations, or guarantees of trading performance. Any information provided is general in nature and does not take into account your individual circumstances. Trading involves significant risks, including the potential for substantial financial losses, and past performance is not indicative of future results. The information is provided ‘as is’ without warranty of accuracy or completeness. All decisions and actions based on the information provided are the sole responsibility of the reader. You should seek independent professional advice before trading. The Systematic Trading with TradeQuantiX newsletter is not liable for any losses, damages, or outcomes resulting from the use of this information or our services.
RealTest Code:
See below for the code to combine all systems together into one combined mini-portfolio result. You can also play with the relative system allocations.
Paid members can also access the full code for all five individual systems and the code to combine them in the GitHub.
There is also an excel sheet called “Allocation_Sandbox.xlsx” which can be used to scale up and down inverse volatility allocation targets to the mini-portfolio. It can also cap max allocation to an individual system if you don’t want any one system to have too large of an allocation.
Simply input the target allocation (the yellow “Target” cell) percent and the max allocation cap (the yellow “Max Cap” cell) and the sheet will solve the inverse volatility allocation weights of each system for you.
