

All Weather Portfolio Research: Part 1
A case study on off-the-shelf All Weather style portfolio's

I’m not really sure why but I’ve had an on and off fascination with ETF trading systems in the past year. To most people, ETF trading systems probably seem boring, but boring can still be a good implementation to a portfolio of other systems, if done right. I have tried a couple times to build an ETF trading system, but haven’t quite satisfied myself with the outcome yet. The type of ETF trading system I am interested in is an All Weather style portfolio.
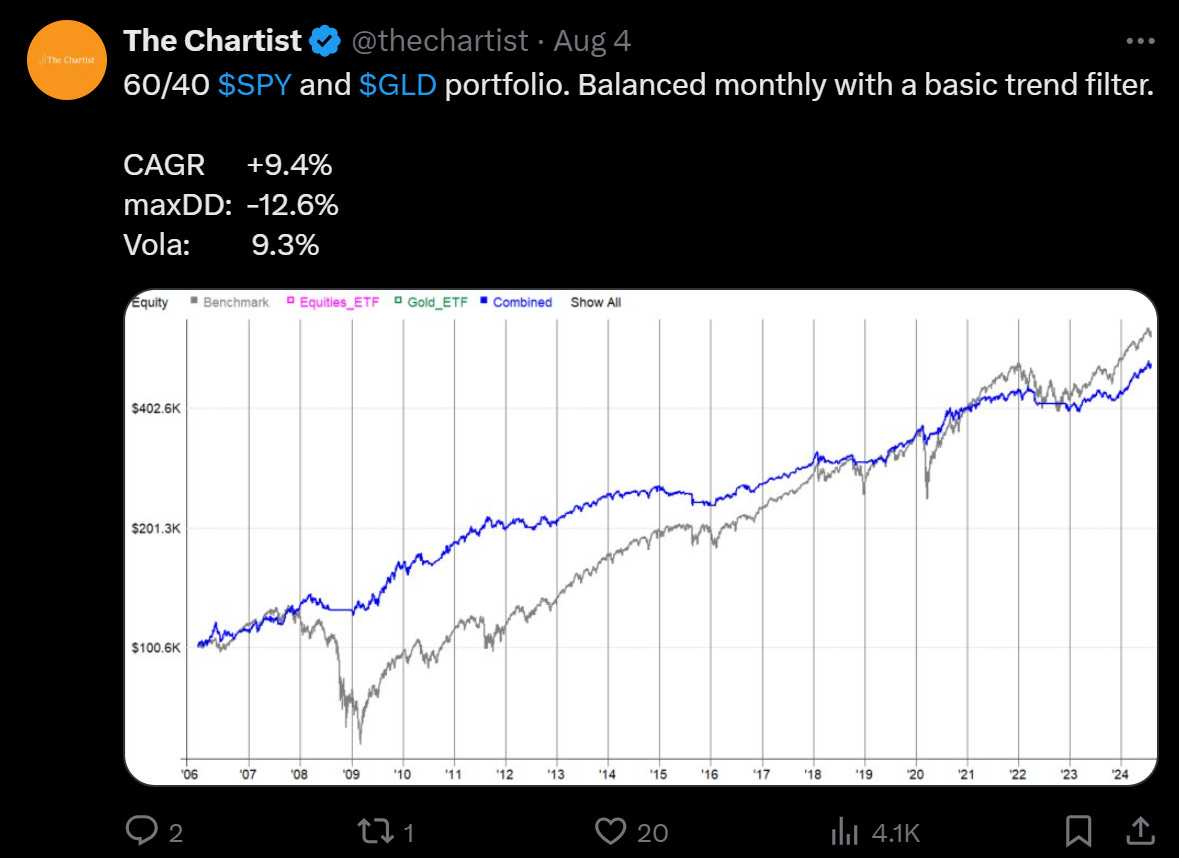
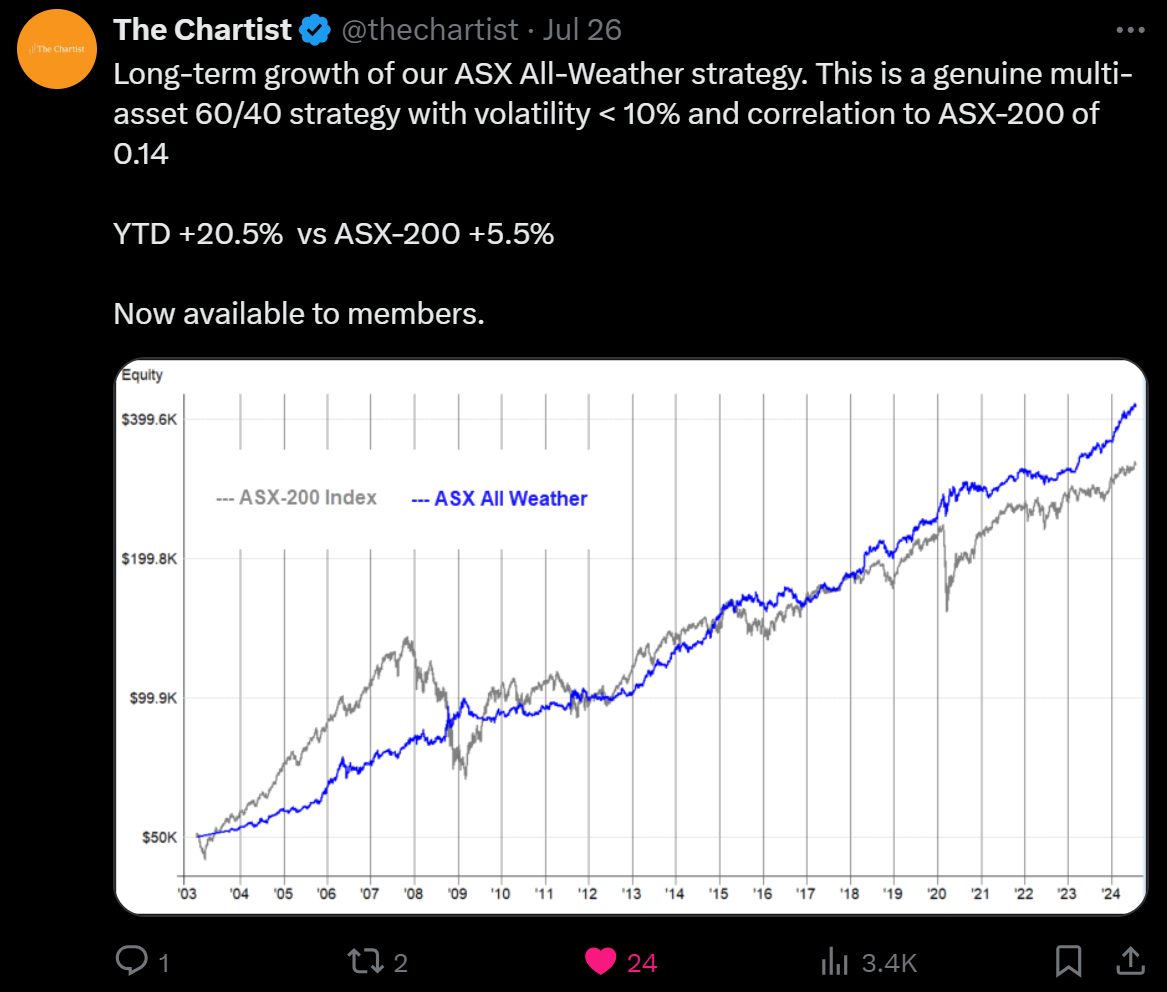
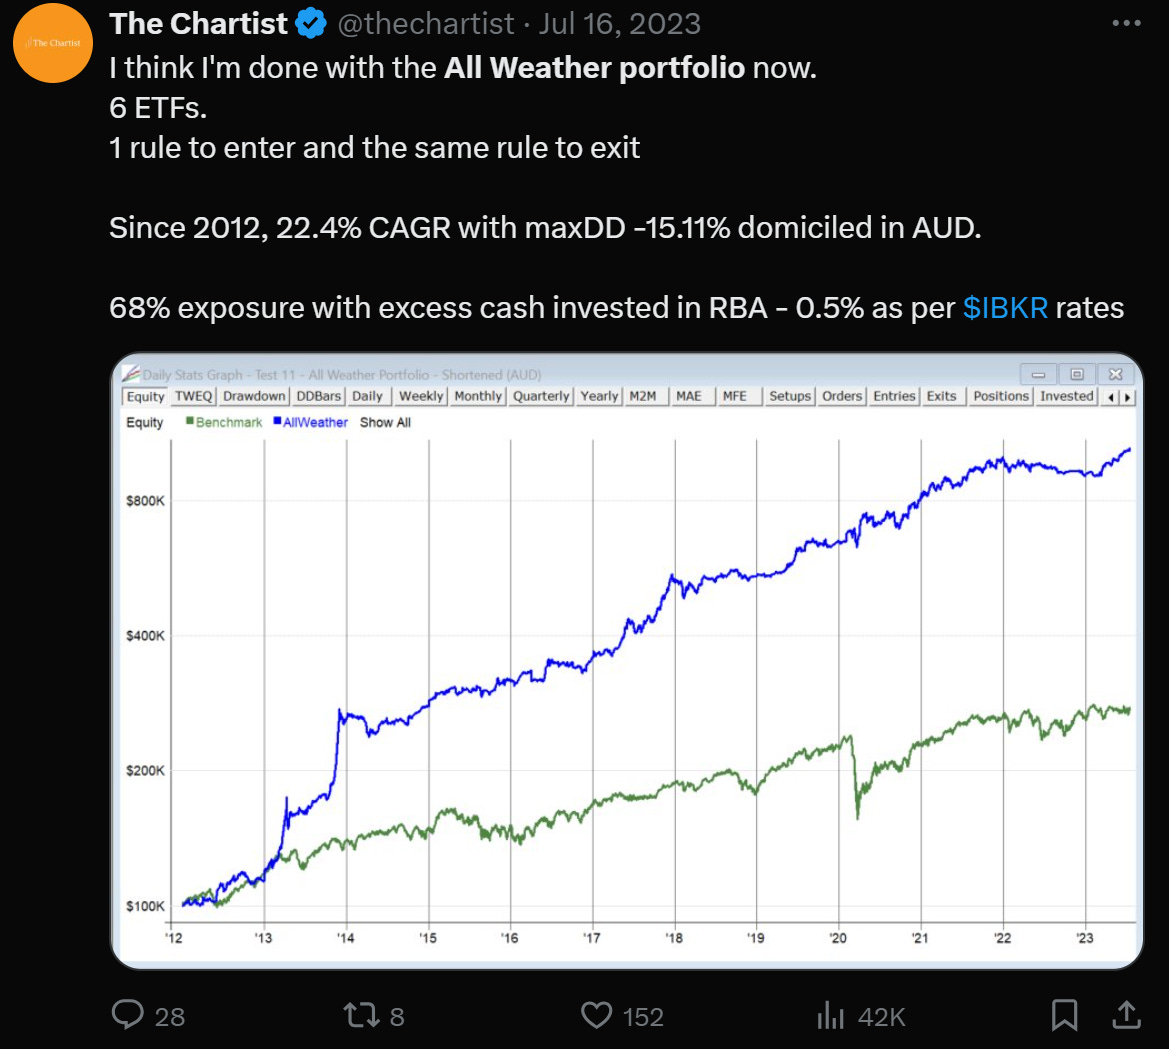
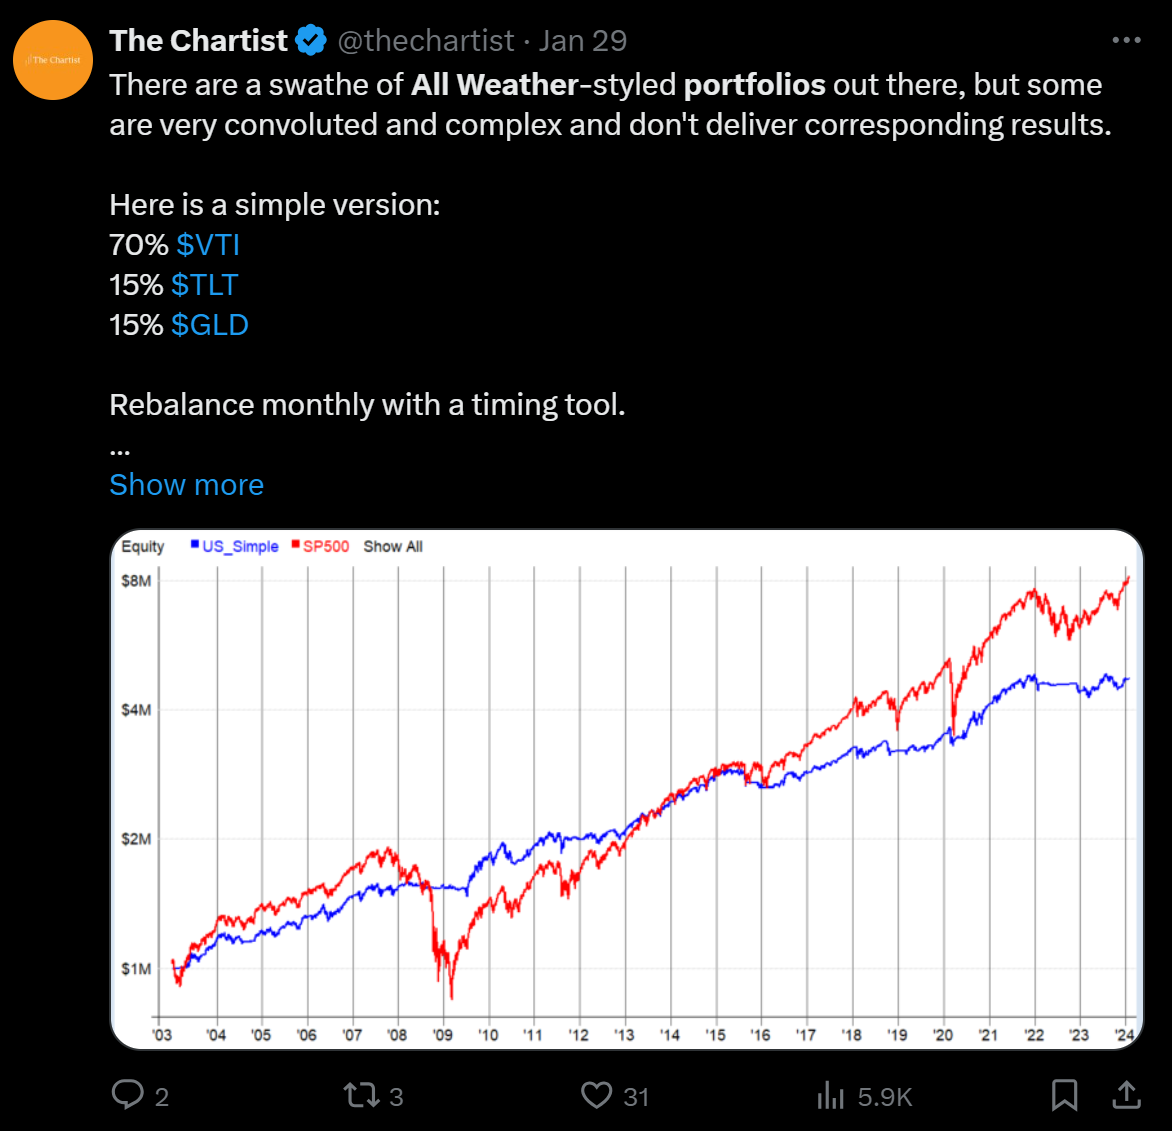
If you don’t know what an All Weather portfolio is, it’s a term made famous by Ray Dalio. My interpretation of an All Weather portfolio is a diversified investment portfolio that seeks to provide stable returns during any economic environment. There are many different interpretations and styles of All Weather portfolios you could make. I’ve seen many posts on X about people having All Weather style portfolios that they have created with their own twists to them. The Chartist on X has shared quite a few examples in the past which you could use as ideas for your own All Weather portfolios. See a couple examples below:
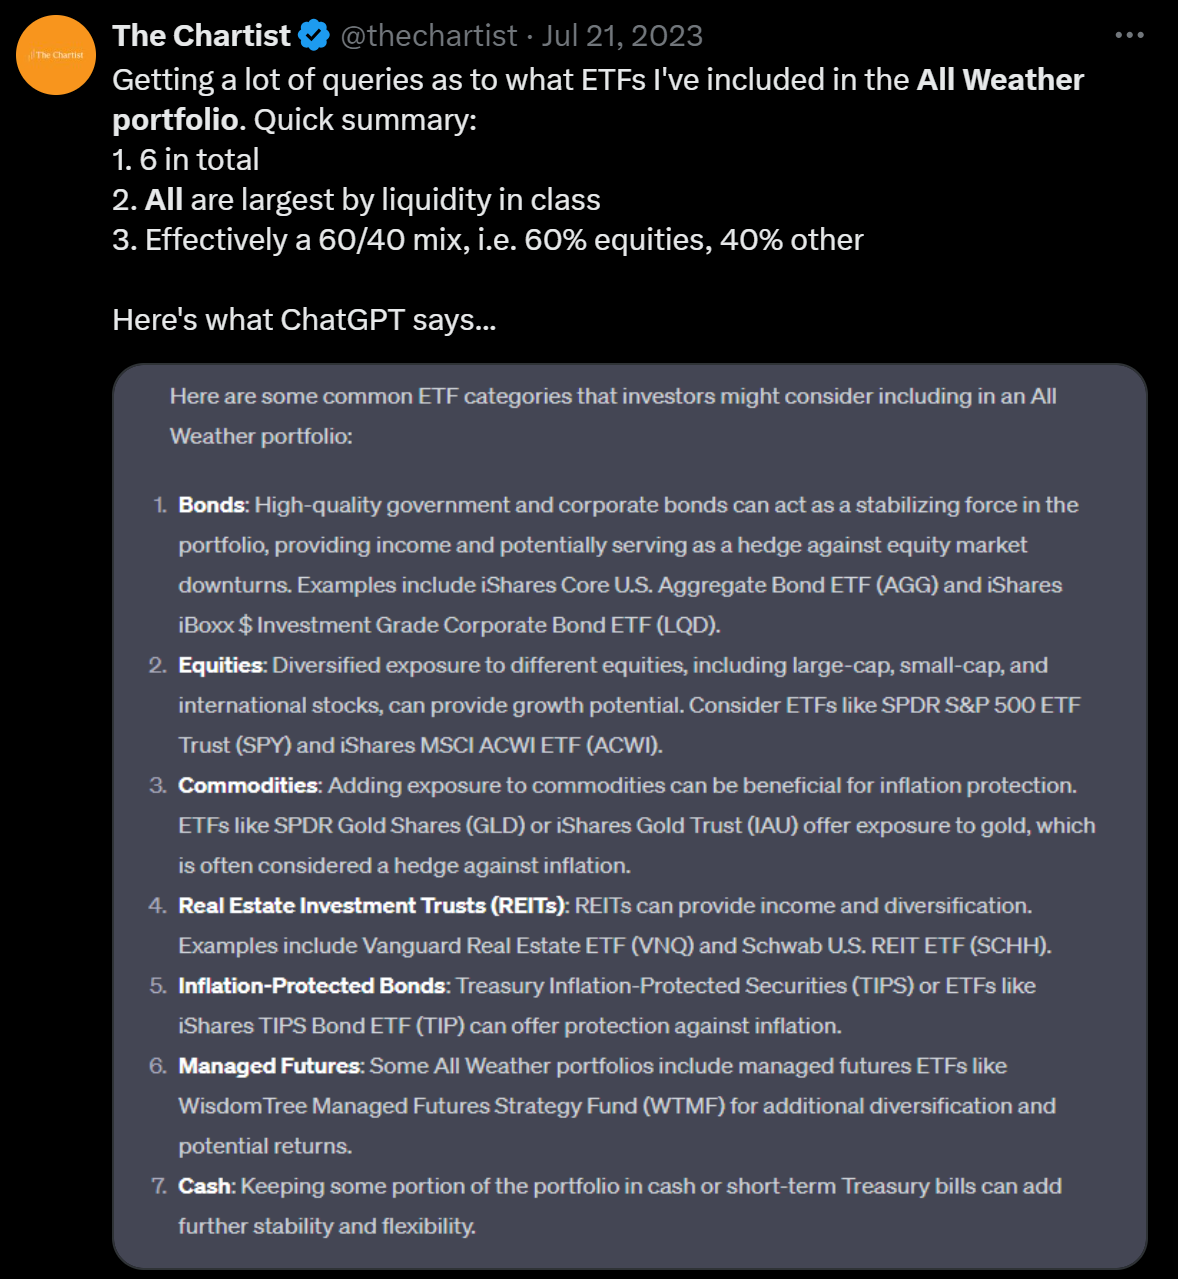
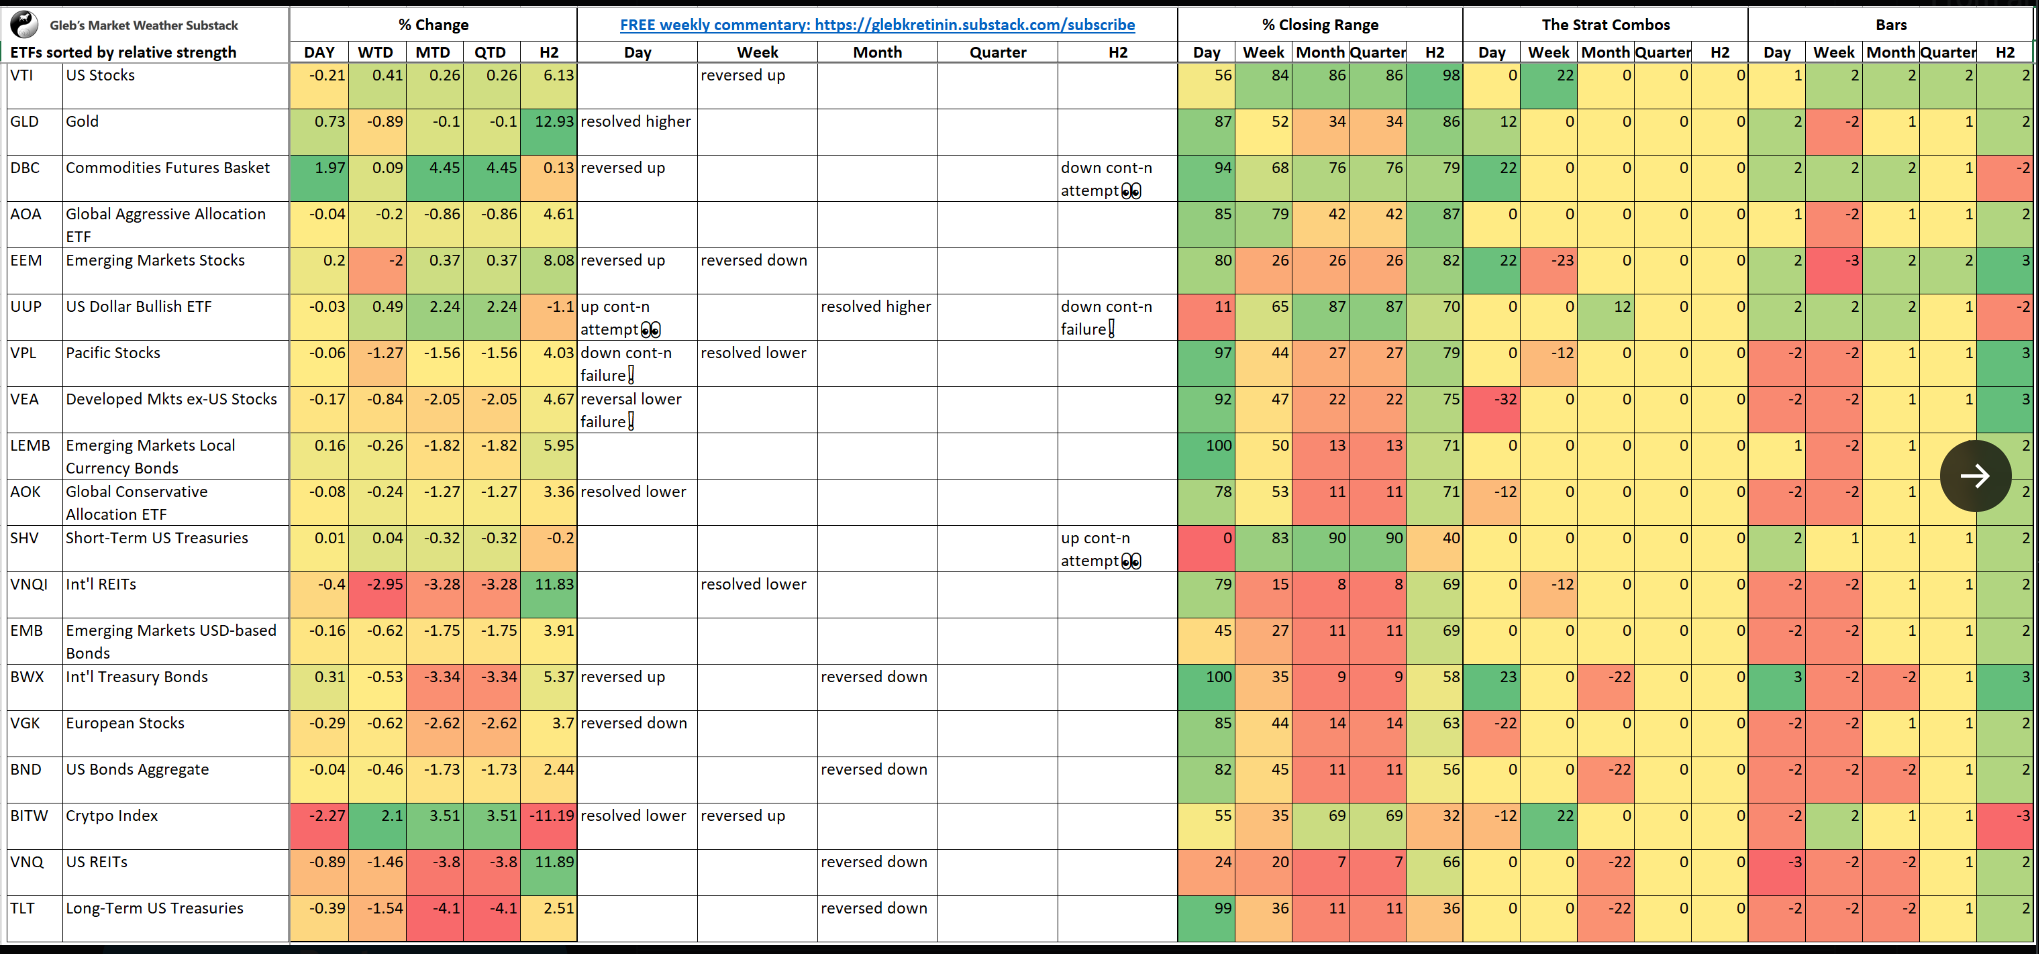
Another example I found on X is someone’s All Weather portfolio but with exposure to more stocks globally. I like this concept because being exposed to just one market economy can lead to time periods of lagged performance compared to the rest of the worlds economic growth. The US has historically had a very bullish and trending stock market, but who’s to say that will continue forever? Being exposed to emerging and growing economies of the world can only lead to goodness in my eyes.
These All Weather portfolio examples above look interesting and promising. The only issue is the system rules and/or the ETFs traded are not disclosed, so I cannot test them for myself. So I am left with just my imagination based on the limited information provided.
While some have shown promising results when it comes to All Weather portfolios, others are skeptical. Traditionally, All Weather portfolios are static. The assets they trade are fixed, you buy and hold them with a fixed allocation, and the rebalance period is fixed in time. This may be too ridged to work forever, a more dynamic approach may be required to navigate all market environments. But many don’t consider a dynamic approach to be considered “All Weather”.
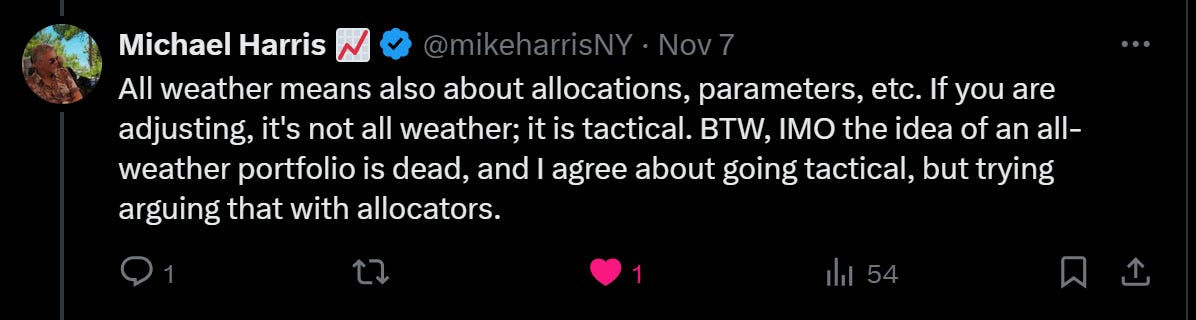
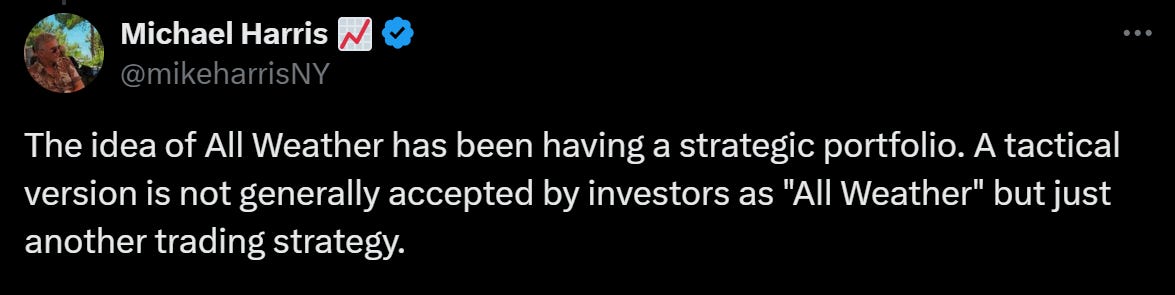
I fully agree with the point made in these tweets. Though I do think the definition of “All Weather” should be able to include dynamic allocations and something slightly more sophisticated than buy an hold a set of assets for an indefinite period of time. Anyway, we will save this for part 2 of this article, this article is just going to focus on static/traditional All Weather portfolios.
I have wanted to develop an All Weather portfolio for awhile now because I think they can have many benefits. The first benefit is they tend to provide decent returns with low volatility, this may be enticing for a risk adverse person who does not handle drawdown well. This is also good for a person nearing retirement age who may be willing to give up some absolute performance in return for a more consistent and stable performance, since they will be living off that money throughout retirement. A second benefit of an All Weather portfolio, if created carefully, can act as a replacement for a savings account. Maybe you are saving for a big purchase in the short to medium term, like a house or a car, and you don’t want those savings subject to high market volatility, an All Weather portfolio could be a good investment for this scenario.
Even my personal situation could benefit from an All Weather style approach. I currently trade a portfolio of many trading systems and sometimes that can comes with high volatility, so it could be beneficial to add some low volatility trading systems like an All Weather style trading system. I could also see a benefit in using an All Weather trading system in a separate 401K or IRA account for retirement. I guess my point is no matter your age or goals, there is likely a scenario where an All Weather portfolio could make sense.
I have in the past attempted once or twice to develop my own All Weather portfolio, but wasn’t quite satisfied with the results. So I went back to the drawing board and restarted with some online research of All Weather portfolio examples. I want to understand what other people had created before I gave another attempt at crating my own All Weather portfolio. If I can learn from what others have done, then maybe I can start from a solid foundation and add my own twist from there.
After looking around online, I found this website where someone modeled many versions of All Weather style portfolios. The website is called Optimized Portfolios, and they have a section where they create what they call Lazy Portfolios. See this link to explore the website: Lazy Portfolios
Out of the many All Weather style portfolios they show, I decide to check out a few and see if I could replicate the results. I figured if I put in the work to mimic some of these portfolios, a few of them may stick out and catch my interest for further exploration. The few portfolios I chose to try and emulate are:
The 60/40 ETF portfolio
The Warren Buffet ETF Portfolio
Ray Dalio All Weather ETF Portfolio
Leveraged Ray Dalio All Weather ETF Portfolio
Tom’s Tail Risk ETF Portfolio
The Golden Butterfly ETF Portfolio
Gyroscopic Desert ETF Portfolio
Leveraged Gyroscopic Desert ETF Portfolio
The 2022 All Weather Portfolio
We have a lot of ETF portfolios to code up, review and reflect on. Some of them look quite interesting and I strongly encourage you check out the website linked above that shares these ETF portfolios, it’s very interesting. One note before we jump in, a lot of these ETFs were not available pre 2010 or 2011. I started these backtests around 2010 or 2011 because that allowed me to capture a data history with a complete set of ETFs for each portfolio. Further work may be needed in the future to collect data going back further in time to understand correlations and performance, but for now we will just start with what’s readily available to us. Also, note that each of these backtests of All Weather portfolios used a quarterly interval to rebalance the allocations within each portfolio. You could choose whatever rebalance interval you wanted, I just assumed quarterly to start.
While we go through these backtests of All Weather portfolios, let’s make some notes of our observations and things we like and don’t like, it will come in handy later when we develop our own All Weather Portfolio. With that said, let’s jump into it!
The 60/40 ETF portfolio:
This portfolio is a classic. It’s used by many people as a “benchmark” portfolio, meaning they compare their own results to the 60/40 portfolio. The 60/40 portfolio has been around for over 70 years, developed in 1952 by Harry Markowitz. The goal of the 60/40 portfolio is to provide 60% allocation to equities for long term growth and 40% allocation to bonds to serve as volatility protection. There has been a lot of talk recently about if the 60/40 portfolio is “dead”, meaning it doesn’t work anymore. I won’t go into those details much but if you are interested here is a link discussing why 60/40 may be dead: The Death of 60/40.
People can say whatever they want, how a particular investment style is “dead” or maybe even how great one style is. I try not to get bogged down in all the noise, I need to do the research myself and come up with my own conclusions. So that’s what I am going to do, I coded up the 60/40 portfolio and checked out the performance for myself. The portfolio uses the ETFs:
60% VTI
40% VGIT
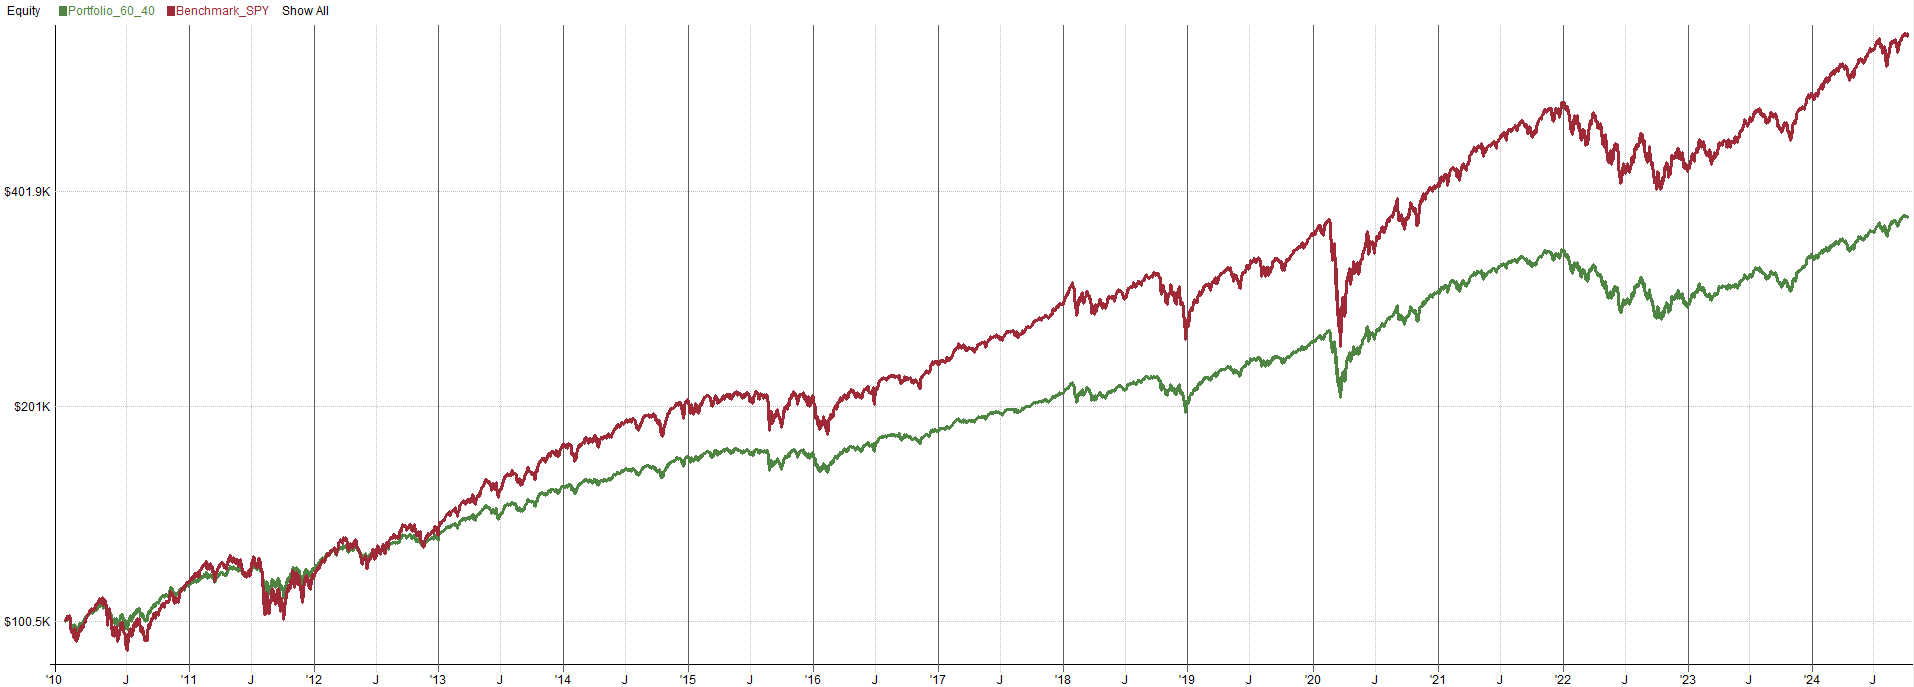

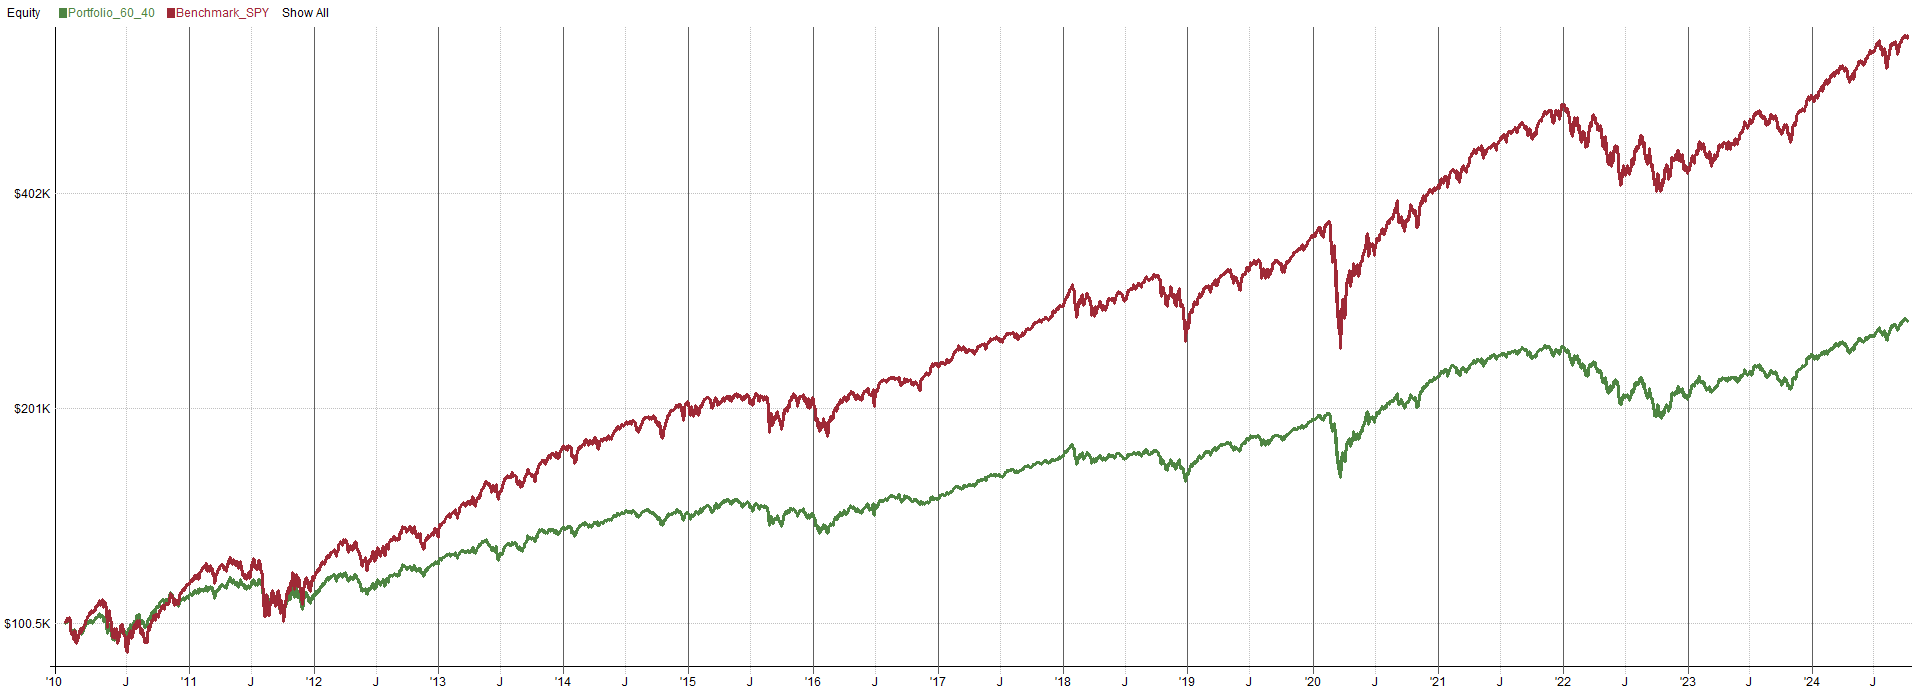
If you hate volatility, then the 60/40 may be interesting to you. It’s simple in concept and easy for the everyday investor to mimic, just two ETFs. You can see from the equity curve that the day to day volatility is definitely lower, but to achieve that you sacrifice outright returns. Intuitively that makes sense, volatility and outright returns tend to be on opposite ends of the spectrum. You have to balance how much volatility you are willing to endure to get the returns you want, but generally you can’t have both low volatility and high returns, at least not with very simple portfolios.
One thing that sticks out to me about the 60/40 portfolio is the nasty drawdown in 2022 that took over two years to recover. This is due to stocks and bonds becoming positively correlated to the downside. Stocks and bonds have been correlated to the upside in the past, but usually not both to the downside during a bear market at the same time, at least not in recent years. See the images below for SPY vs. TLT historical performance with a rolling 100 day correlation between the two ETFs:
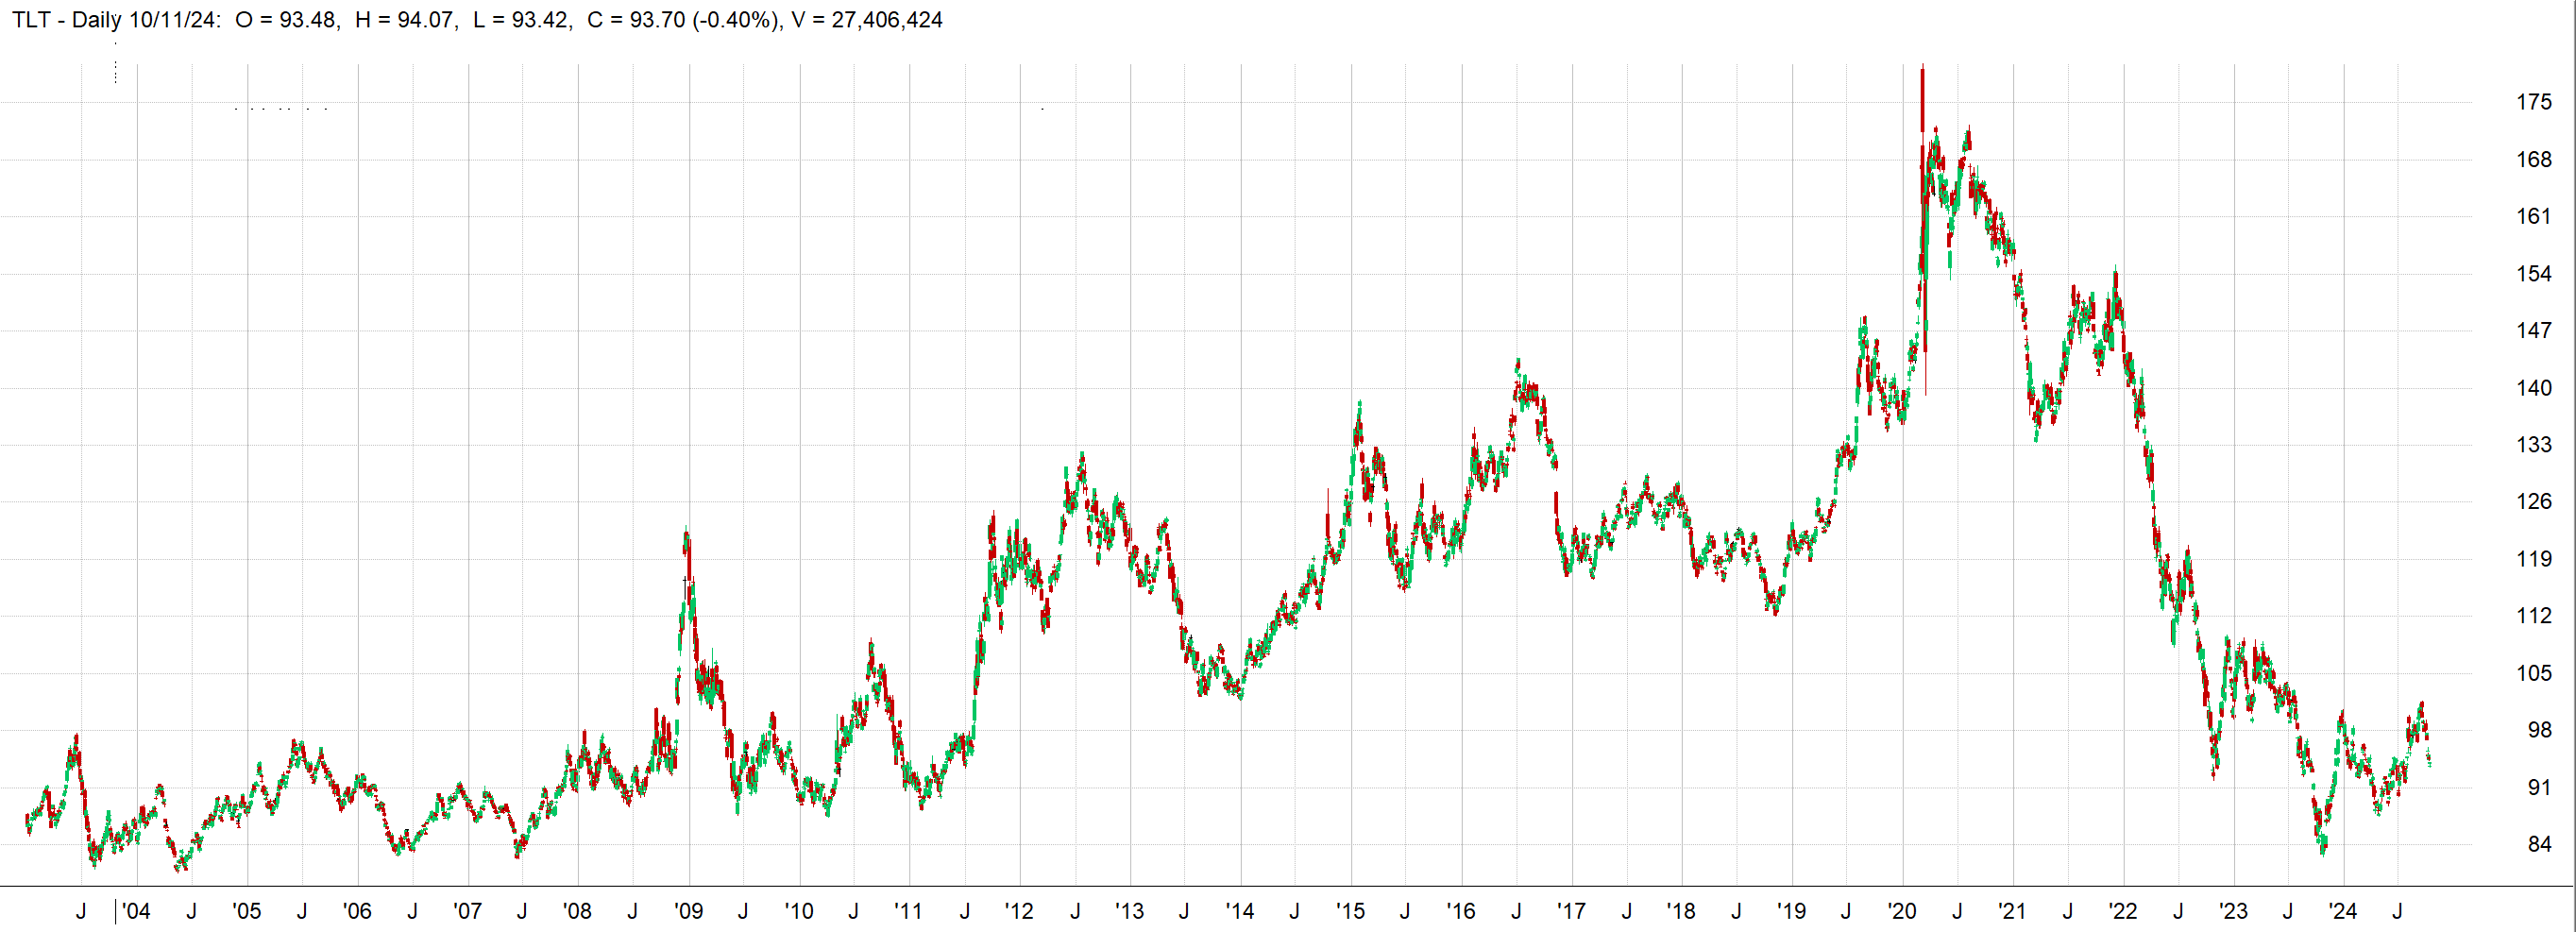
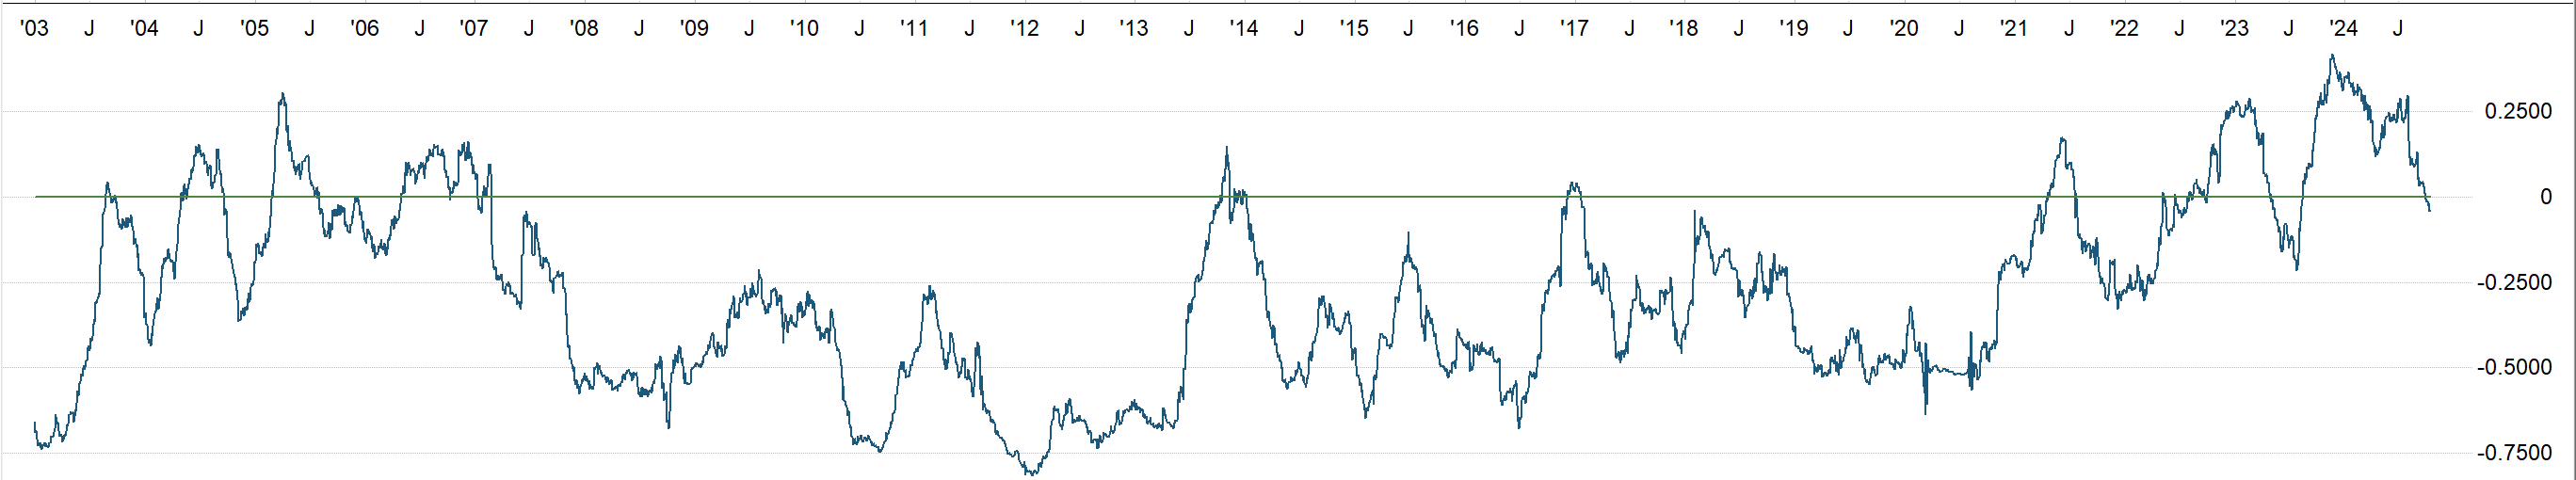
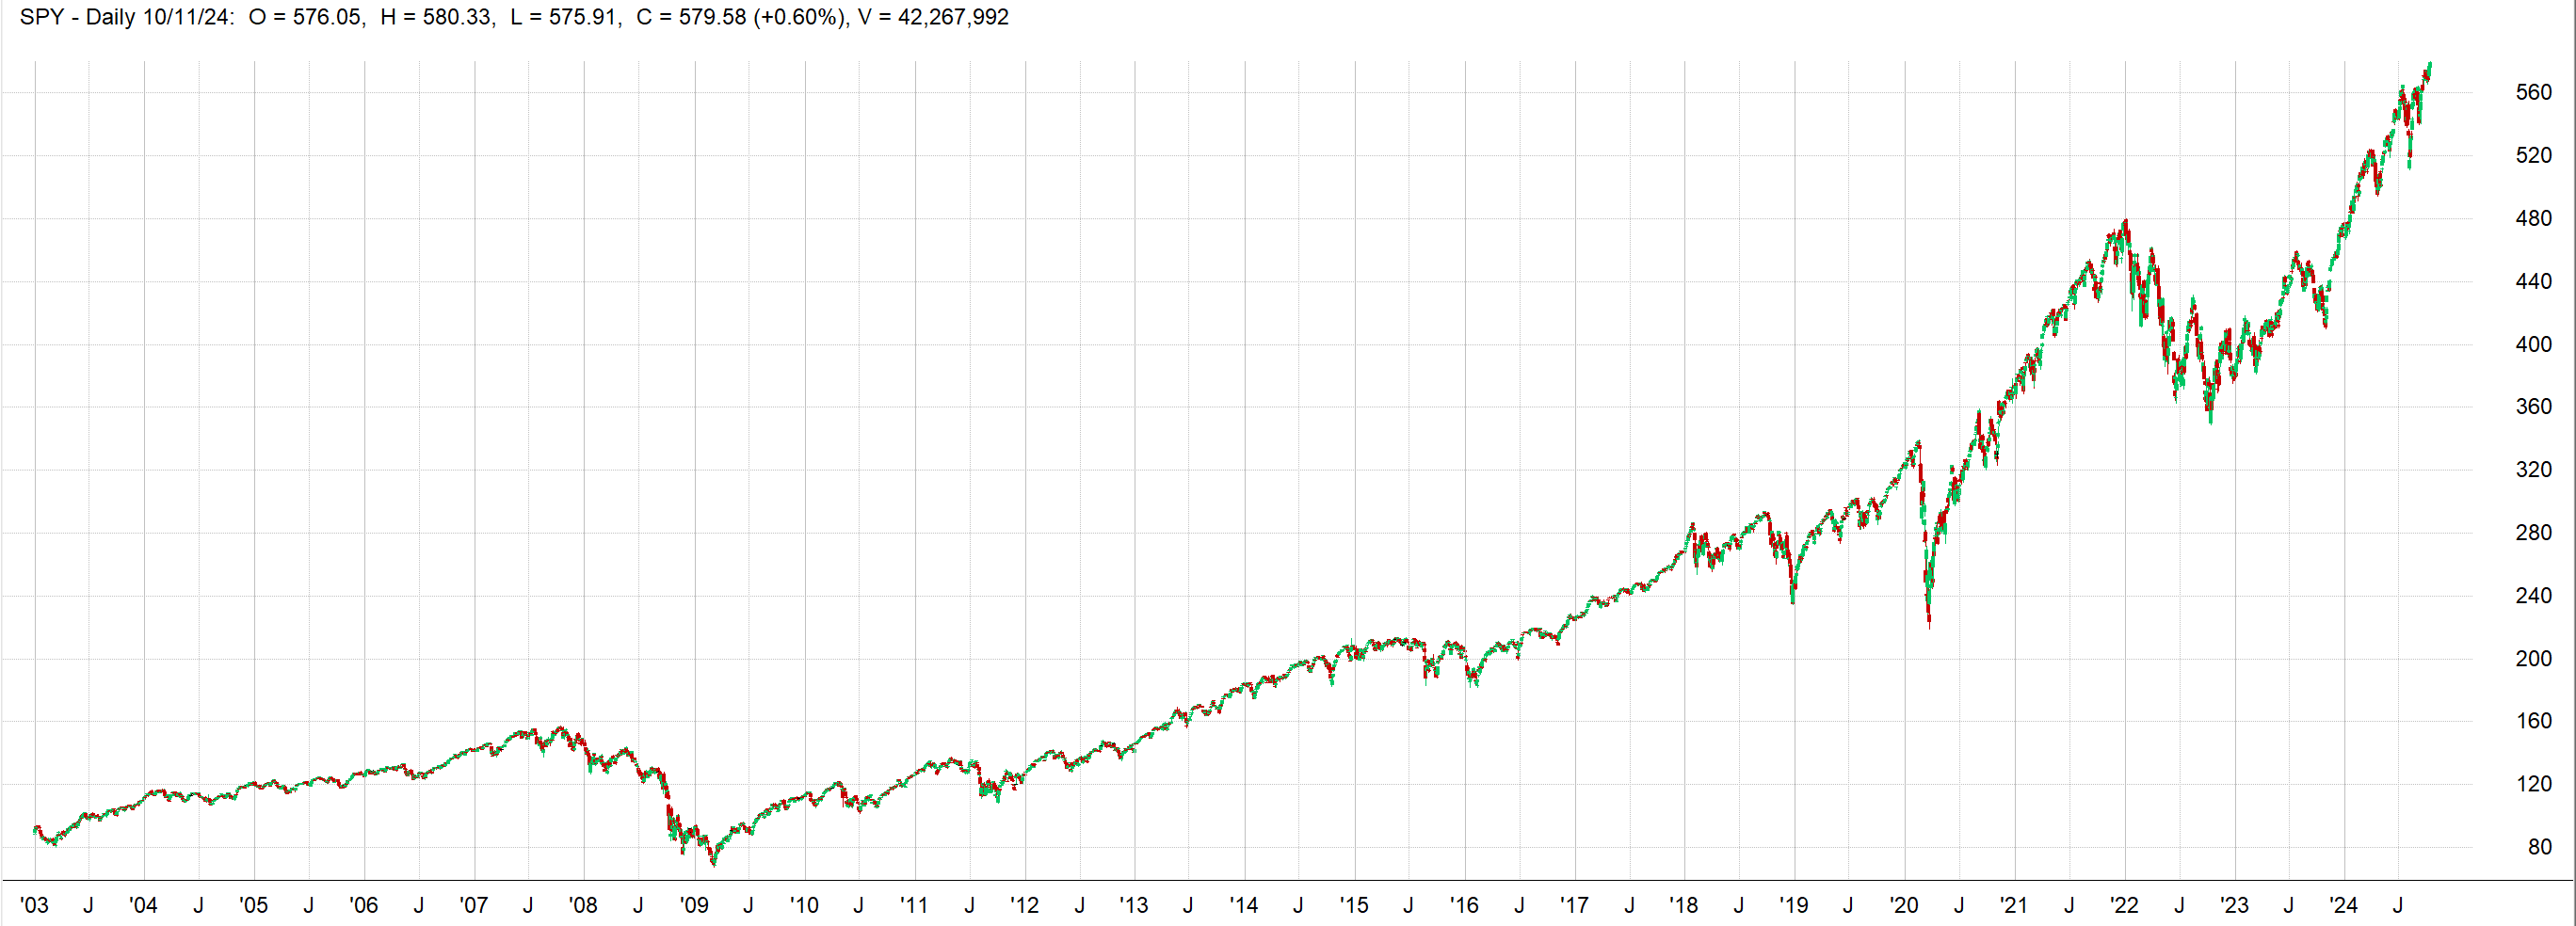
You can see the crash of 2008 had a negative correlation, so when stocks went down bonds went up, helping stabilize the portfolio. For many years the correlation has been below zero, but in the past few years correlation has slowly been rising, leading to periods of time where the 60/40 portfolio will suffer. 2022 had periods of positive correlation, which is why the performance in 2022 was not as good as many would have hoped.
What this shows me is the 60/40 portfolio is not quite diversified enough to withstand any market environment. While stocks and bonds will likely have their place in an All Weather portfolio, we probably need to consider other instruments outside of just stocks and bonds. We need more correlation variation over time.
The 60/40 portfolio above was using the US equities ETF VTI. If you want to go international with the 60/40 portfolio and be exposed to equities outside of the US markets you could use the equity ETF VT (60% international equities). Below is the 60/40 portfolio using the ETFs:
60% VT (international equities)
40% VGIT

This version of the 60/40 performs worse, but that kind of misses the point. There is no guarantee that US equities will outperform in the future, so it may make sense to include international equities into the portfolio, that call is up to you. Using international equities definitely brings more diversification than just having US equities. Thus, when we develop our own All Weather portfolio, it may make sense to include international equities for the diversification purpose. They may help us in the future if US equities start to underperform other portions of the world.
One thing to note, though I am making these comments based on how the equity curve behaves, this is in no way proof of a good or bad trading system. This is just where I personally like to start with these kind of investigations. When I am trying to replicate an idea I see online or in a book, the first thing I will do is try to replicate the performance with my own trading software. If I can’t replicate the performance closely, then the idea gets thrown in the trash. If I can replicate the performance and the equity curve looks attractive, then I will take the system into a further deep dive of testing. Checking out the equity curve is like my initial filter of if a trading/investment approach is worth my time and further work. This is why I am making surface level comments just based on what I see from the equity curves, I am trying to understand if this system even warrants the time of further investigation by me. I am not trying to come to the conclusion that an ETF portfolio is good just because the equity curve looks good. It is important to do your own detailed research before taking any trading/investment approach and putting real money into it, do not blindly invest/trade a system just because the equity curve looks nice.
Notes:
	60/40 Portfolio

Import:
	DataSource:	Norgate
	StartDate:	Earliest
	EndDate:	Latest

	IncludeList:	VTI, VGIT {"ETFs"}   //US Equities
	//IncludeList:	VT, VGIT {"ETFs"}   //International Equities

	IncludeList:	SPY

	SaveAs:	ETFs.rtd

Settings:
	DataFile:	ETFs.rtd
	StartDate:	1/1/2010
	EndDate:	Latest
	AccountSize:	100000

Parameters:
	allocVTI:	0.60    //US Equities
	//allocVT:	0.60    //International Equities
        allocVGIT:	0.40

Data:
	Entry:	InList("ETFs")
	alloc:	item("alloc{?}", ?symbol)

Library:
	EndOfQuarter: EndOfMonth and Month % 3 == 0


Strategy: Portfolio_60_40
	Allocation:	S.Equity
	Side:	Long

	Quantity:	S.Alloc * alloc
	QtyType:	Value

	EntrySetup:	Entry
	ExitRule:	EndOfQuarter

	Commission:	Min(0.01 * FillValue, Max(0.005 * Shares, 1))

Benchmark: Benchmark_SPY
	EntrySetup:	Symbol=$SPY
	ExitRule:	Dividend > 0
The Warren Buffet ETF Portfolio:
Everyone knows Warren Buffet, he needs no introduction, he is considered one of the best investors of all time. This is why I found it intriguing to check out the Warren Buffet ETF portfolio. Looking further into this portfolio, it turns out this isn’t the portfolio he actually invests in, Warren Buffet tends to invest in actual companies as opposed to ETFs. Instead, this portfolio is what Warren Buffet wants the trustee of his estate to invest in upon his passing. It appears Warren Buffet wants his money to be invested in a 90/10 portfolio when he passes. 90% of the money should go into an equity index fund and 10% will go into short-term government bonds.
From what I have heard about Warren Buffet, he has always been very equities heavy in his portfolios. It appears like his objectives are to maximize long term portfolio growth. The 90/10 portfolio would have a large focus on maximizing returns with the small allocation to bonds to act as a “parking garage for cash”.
“I think in Buffett's eyes, this 10% is less of a stocks hedge and is simply more like a parking garage for cash. Keep in mind this is just the portfolio in which Buffett's estate is supposed to be invested. It is not necessarily a portfolio he recommends to retail investors. The value of his wife's portfolio can easily sustain huge drawdowns and still cover her living expenses, so its riskiness is sort of irrelevant for its intended purpose. Retail investors can't say the same”. Warren Buffet ETF Portfolio
So, it seems like this portfolio is aimed at absolute growth and the 10% bond allocation is really just to be used for living expenses. It is mentioned this portfolio is not recommended for retail sized accounts but instead massive accounts that can withstand high volatility and still have a lot of money left over for covering life’s expenses.
Anyway, let’s just code it up and see how it does. This portfolio is very similar to the 60/40 portfolio and uses the ETFs:
90% VOO
10% VGSH
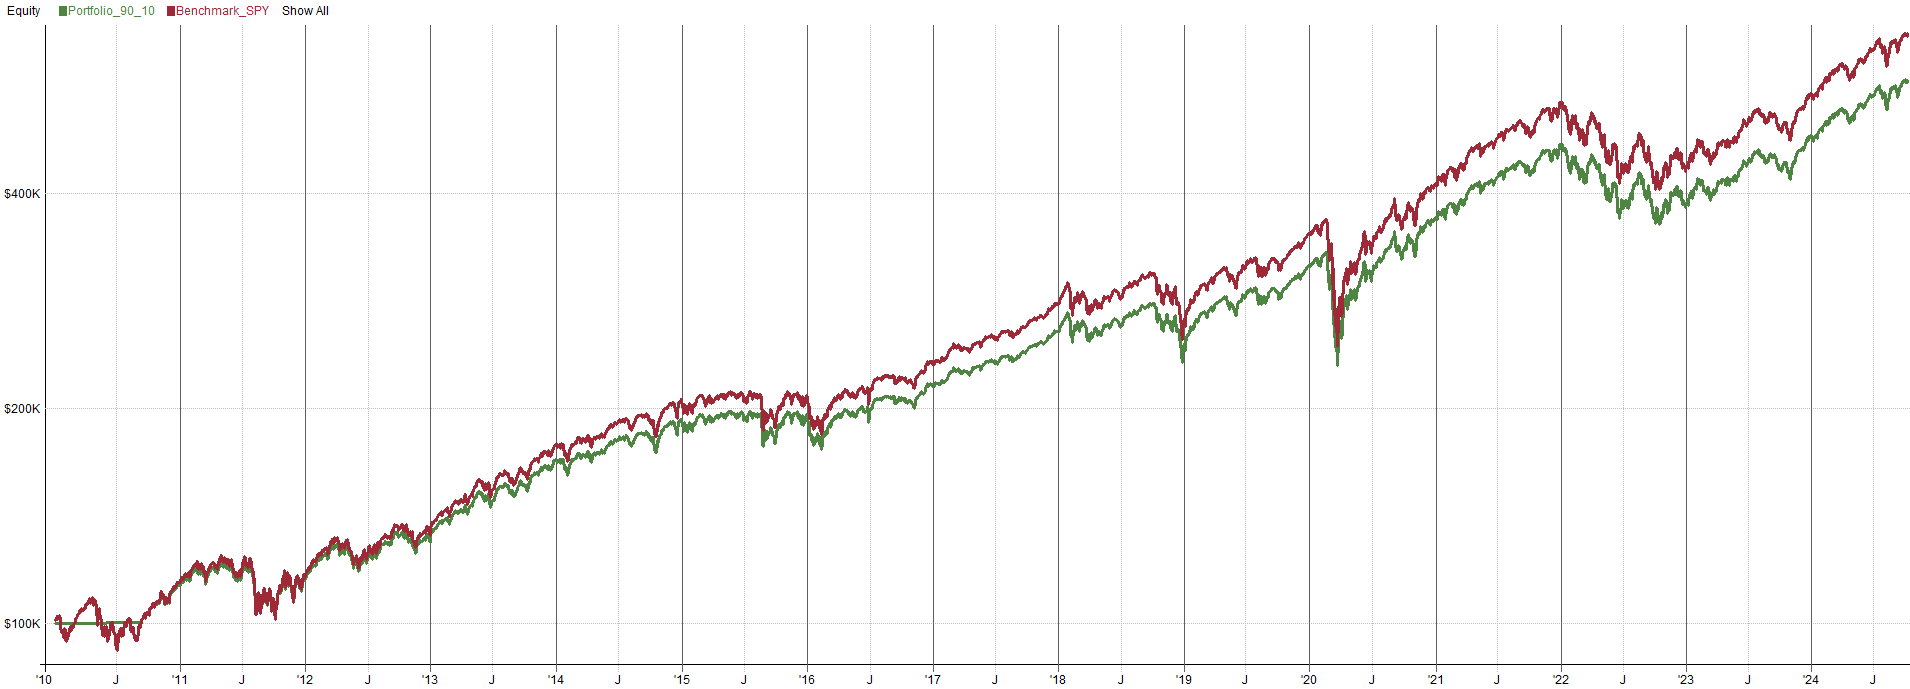

This one is similar to the 60/40 portfolio, just has more volatility since more money is allocated to equities. The portfolio slightly underperforms the S&P 500 benchmark index without much reduction in volatility, so at this point you may as well just own the SPY ETF. Granted, the disclaimer with this portfolio is that it was made with the specific purpose of using bonds as a piggy bank for cash. I’m not sure we learned too much new here other than solidify the idea that a 2 ETF portfolio may be too simplistic. Also, when it comes to these ETF portfolios, it seems like there is a tradeoff between volatility and returns.
To go international and be exposed to equities outside of the US markets you could use the equity ETF VT (90% international equities) and if you wanted to be exposed to long term bonds instead of short term bonds then you could use the ETF VGLT (10% long term bonds). Using these ETFs result in very similar results to the image above, but the international equities yield slightly worse returns, similar to the 60/40 example. I won’t show the equity curve because I think you can image how it would look.
Notes:
	90/10 Portfolio

Import:
	DataSource:	Norgate
	StartDate:	Earliest
	EndDate:	Latest

	IncludeList:	VOO, VGSH {"ETFs"}   //US Equities

	IncludeList:	SPY

	SaveAs:	ETFs.rtd

Settings:
	DataFile:	ETFs.rtd
	StartDate:	1/1/2010
	EndDate:	Latest
	AccountSize:	100000

Parameters:
	allocVOO:	0.90
	allocVGSH:	0.10

Data:
	Entry:	InList("ETFs")
	alloc:	item("alloc{?}", ?symbol)

Library:
	EndOfQuarter: EndOfMonth and Month % 3 == 0

Strategy: Portfolio_90_10
	Allocation:	S.Equity
	Side:	Long

	Quantity:	S.Alloc * alloc
	QtyType:	Value

	EntrySetup:	Entry
	ExitRule:	EndOfQuarter

	Commission:	Min(0.01 * FillValue, Max(0.005 * Shares, 1))

Benchmark: Benchmark_SPY
	EntrySetup:	Symbol=$SPY
	ExitRule:	Dividend > 0
Ray Dalio All Weather ETF Portfolio:
Another person who needs no introduction, Ray Dalio, the inventor of the All Weather portfolio. A portfolio designed to maintain stability during any economic environment.
As the name suggests, the All Weather Portfolio is designed to be able to “weather” any storm. It uses asset class diversification based on seasonality in the interest of limiting volatility and drawdowns. The holdings and the allocations thereof correspond to Dalio's view on economic “seasons.” Dalio's strategy and expertise are so pervasive that the phrase “all weather” is now used to describe other portfolios that behave like his in surviving any economic climate, e.g. “investing in an all weather portfolio.”
Dalio proposes that the following four things affect asset value:
Inflation
Deflation
Rising economic growth.
Declining economic growth.
It’s a very attractive concept, a portfolio that makes decent returns with minimal risk, in any market environment, outperforming the S&P 500 on a risk adjusted basis. Like I mentioned before, I am interested in the All Weather approach for many reasons, so I am excited for this one. If you have money just sitting around making little to no interest in a bank account, then an All Weather style portfolio may peak your interest. It’s allegedly less risky than investing in the S&P 500 but generally provides better returns than the risk free rate, definitely a win win. The All Weather portfolio is made up of several components:
30% equities
40% long term bonds
15% intermediate term bonds
7.5% commodities
7.5% gold
A fairly diversified combination of assets. With the low allocation to equities, this portfolio is definitely focused on stability over outright performance. The introduction of commodities and gold is interesting. These assets tend to trend and different times than equities historically and they have different drivers than equities in terms of what makes them trend, so they should work as decent diversifiers. This portfolio can be built with the following ETFs:
30% VTI
40% VGLT
15% SCHR
7.5% GLDM → (I am replacing this with GLD for backtesting since it has longer history)
7.5% BCI → (I am replacing this with DBC for backtesting since it has longer history)
Here is the backtested performance of the All Weather portfolio
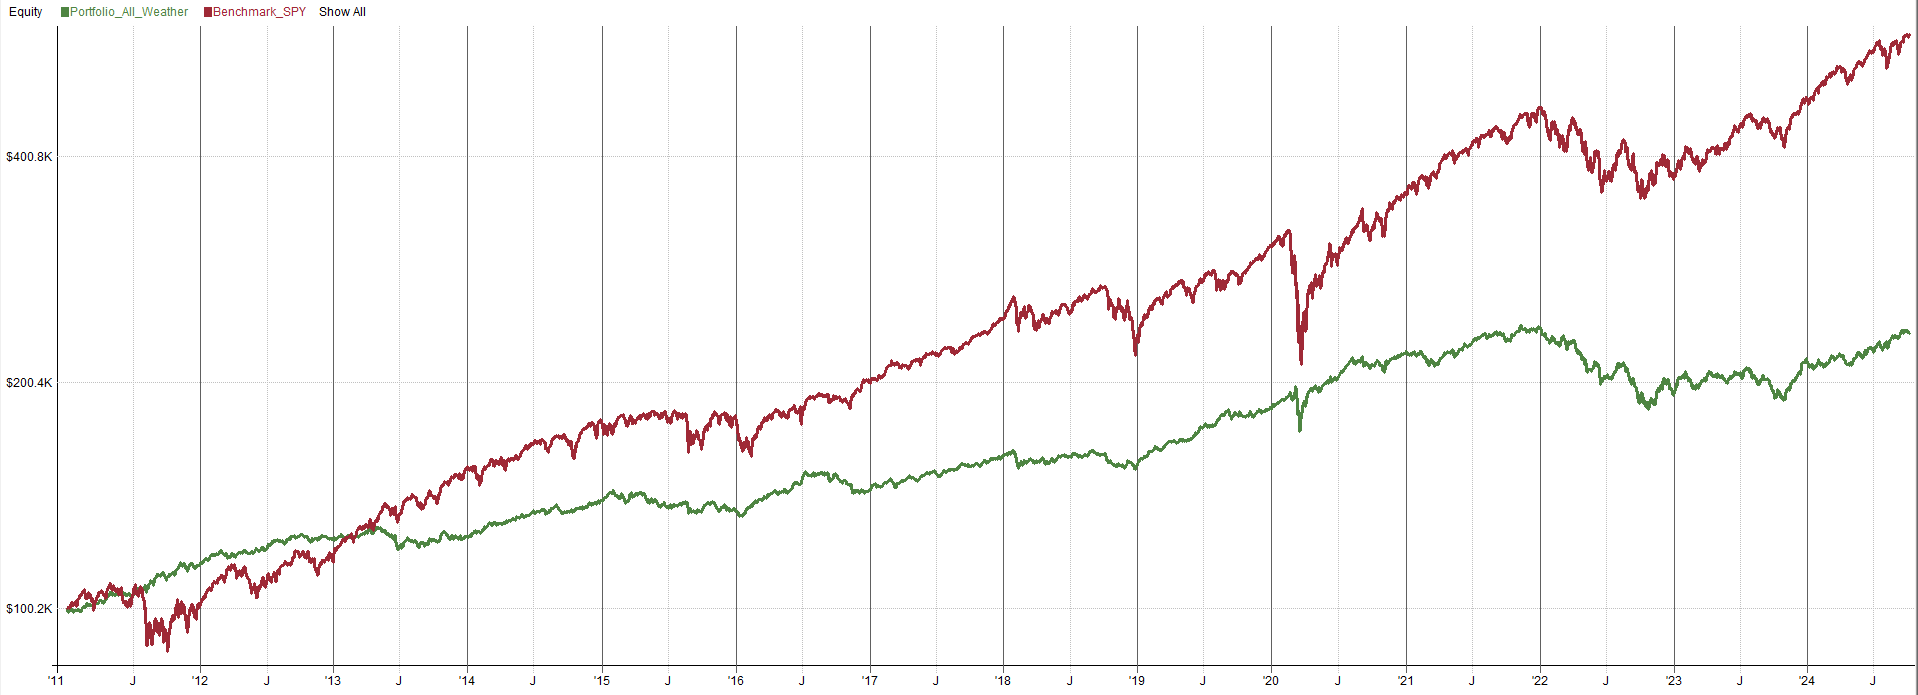

Well, the portfolio definitely has lower volatility than the S&P 500. Also, the performance has been pretty stable, at least up until 2022. Obviously, some market regime occurred in 2022 that has not occurred any other time in recent history because the All Weather portfolio definitely struggled. I’ve noticed this myself with my own trading and strategy development, 2022 was just a tough time for some reason, I have not figured out the reason yet. If this portfolio had continued its performance between 2011 to 2022 for the entire time period, I think we would have found our winner for an All Weather approach. Recent times however, have pointed out a flaw in the traditional All Weather approach that we will have to learn from.
Something is definitely missing, if this All Weather portfolio it was properly diversified then the 2022 bear market would not have had such an impact. I am not sure at this point what diversifier the Ray Dalio All Weather portfolio is missing, hopefully we can learn more as we test out more portfolios. That all being said, the portfolio is definitely a great starting point for creating our own All Weather portfolio. It is probably a good idea to consider having gold and commodities in our own All Weather due to the diversification they generally tend to bring.
Leveraged Ray Dalio All Weather ETF Portfolio:
Continuing with the Ray Dalio All Weather portfolio, some may find the profile of the returns (smoothness of returns) interesting, but the absolute return to be boring. Meaning they like how the All Weather portfolio behaves, they just wish it was juiced up a little bit more. So, if you are trying to amplify the returns a little, you could go for a 2x or 3x leveraged All Weather portfolio. I think 3x is a little crazy so let’s test out the 2x portfolio instead. To do this, we will use the same allocation percent as the unleveraged version, just swap out the ETFs with leveraged ETFs. OptimizedPortfolio.com lists the following leveraged ETFs:
30% SSO (2x S&P 500)
40% UBT (2x long term treasury bonds)
15% UST (2x intermediate term treasury bonds)
7.5% DIG (2x oil and gas → not a perfect 2x commodity ETF but likely as close as you will get)
7.5% UGL (2x gold)
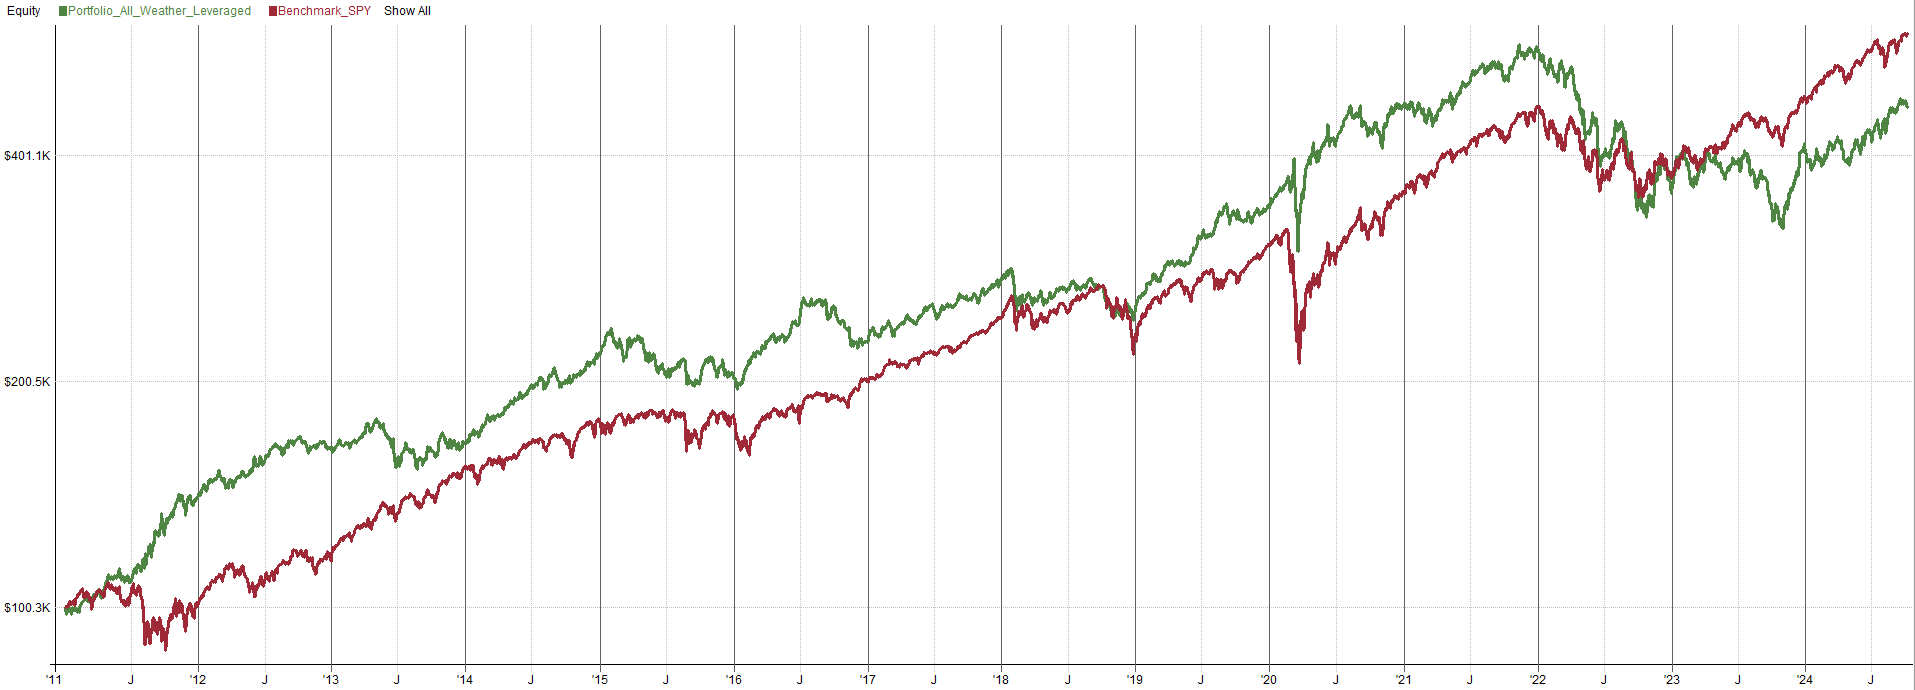

This version of the All Weather portfolio definitely has beefier return profile, but the volatility is massive, and the drawdown is huge. To me, this kind of defeats the purpose of an All Weather portfolio. To be honest, you would be better off with buy and hold of SPY, the volatility and drawdown of SPY is lower and the returns are similar to the leveraged All Weather Portfolio.
While the leveraged All Weather portfolio is not as attractive as it seems on paper, there are some concepts we can learn from. Leveraged ETFs could be used in a smart way to get more bang for our buck. We could take a 2x ETF and allocate half the amount to it. When we do this, we end up with the same amount allocated in terms of the returns we will get, but with the 2x ETF we still have the other half of the allocation sitting around. We could use the other half of the capital in another ETF to diversify further. We will have to test out this assumption to ensure its valid because leveraged ETFs have a small decay built in, so a 2x leveraged ETF may not be exactly 2x, it’s likely more like 1.9x due to the decay. So we may have to mess with the allocation to get it just right, but this idea could make our money go further and provide higher returns without sacrificing low volatility and low drawdowns.
Notes:
	All Weather Portfolio

Import:
	DataSource:	Norgate
	StartDate:	Earliest
	EndDate:	Latest

	IncludeList:	VTI, VGLT, SCHR, GLD, DBC {"ETFs"}   //All Weather ETFs
	//IncludeList:	SSO, UBT, UST, DIG, UGL {"ETFs"}   //Leveraged All Weathr ETFs

	IncludeList:	SPY

	SaveAs:	ETFs.rtd

Settings:
	DataFile:	ETFs.rtd
	StartDate:	1/1/2011
	EndDate:	Latest
	AccountSize:	100000

Parameters:
	allocVTI:	0.3
	allocVGLT:	0.4
	allocSCHR:	0.15
	allocGLD:	0.075
	allocDBC:	0.075

	//allocSSO:	0.3
	//allocUBT:	0.4
	//allocUST:	0.15
	//allocDIG:	0.075
	//allocUGL:	0.075

Data:
	Entry:	InList("ETFs")
	alloc:	item("alloc{?}", ?symbol)

Library:
	EndOfQuarter: EndOfMonth and Month % 3 == 0

Strategy: Portfolio_All_Weather
	Allocation:	S.Equity
	Side:	Long

	Quantity:	S.Alloc * alloc
	QtyType:	Value

	EntrySetup:	Entry
	ExitRule:	EndOfQuarter

	Commission:	Min(0.01 * FillValue, Max(0.005 * Shares, 1))

Benchmark: Benchmark_SPY
	EntrySetup:	Symbol=$SPY
	ExitRule:	Dividend > 0
Tom’s Tail Risk ETF Portfolio:
Another interesting portfolio I found was Tom’s Tail Risk portfolio. I’m not really sure who Tom is but his portfolio name is catchy. This portfolio is similar to the previous portfolios we have looked at, except the allocations are a bit different and commodities are replaced with a tail hedge. A tail hedge is essentially an insurance policy, you’re paying a premium to be protected when an adverse event occurs. The idea of that is nice because having insurance is generally a good thing. The issue is a tail hedge tends to bleed losses when times are good and only do well when times are bad. While that isn’t an issue from a diversification stanpoint, it is an issue from a returns standpoint because you will be giving up returns for that protection. All that said, there is nothing wrong with having a tail hedge. Its all comes down to your own personal risk tolerance, if your risk tolerance is very low then maybe you are fine with sacrificing some returns for protection, it’s all up to you. Anyway, the allocations for this strategy are as follows:
30% global equities
25% total US treasury bond market
25% intermediate TIPS
10% gold
10% hedge
The hedge allocation is 10%, which is relatively small so maybe the returns we sacrifice to have it won’t be too bad. You could always vary the allocations to meet your own goals. When these allocations are applied to ETFs, the portfolio looks like the following:
30% VT
25% GOVT → (Replaced with VGLT for backtesting since it has a longer history)
25% SCHP
10% SGOL
10% TAIL (OTM put options ETF)
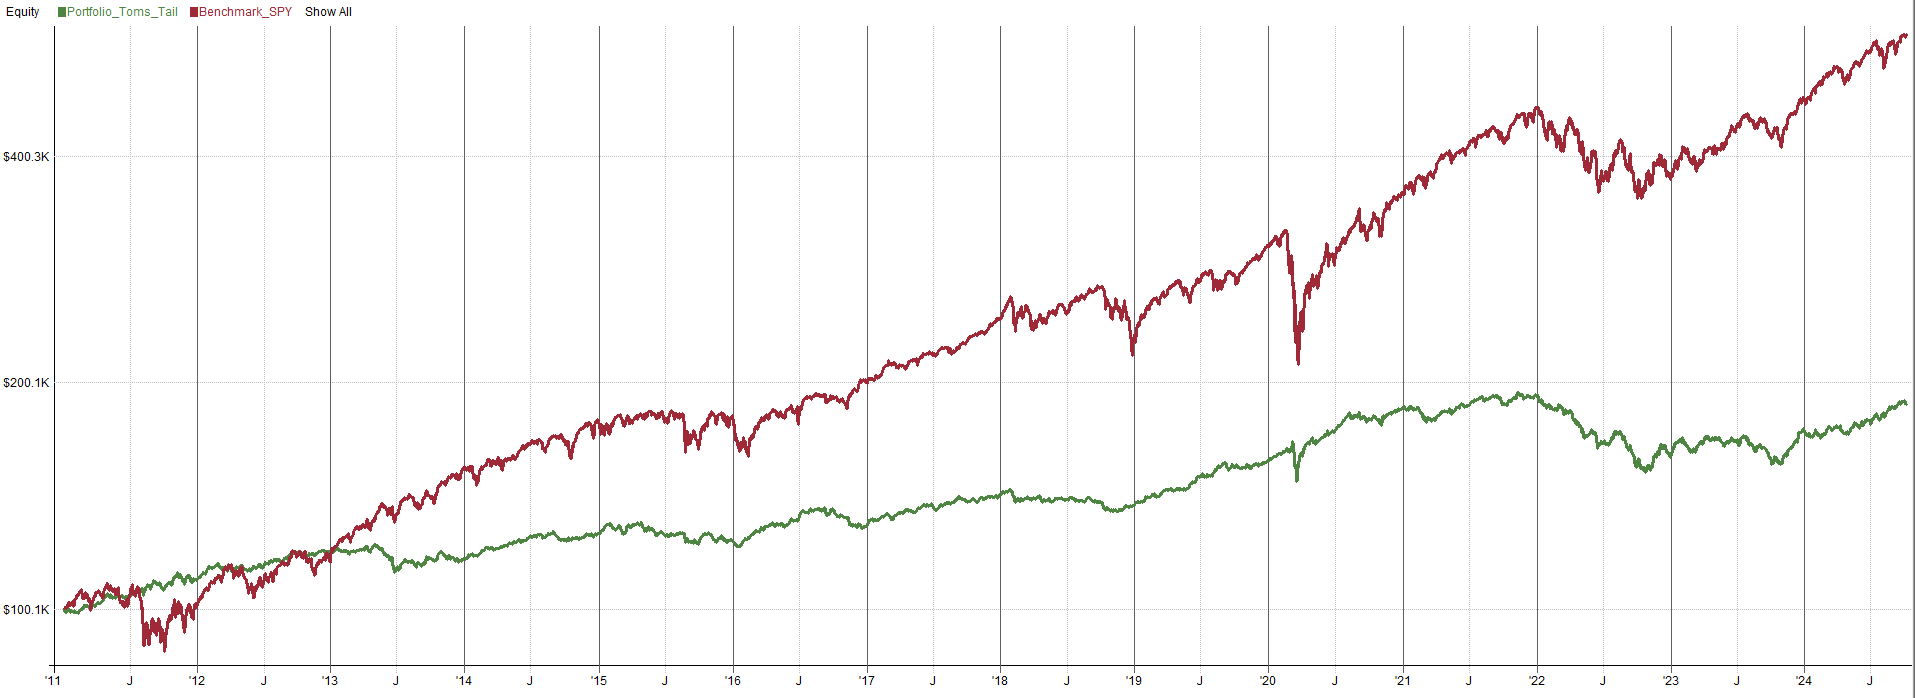

One thing to keep in mind is there is a limitation in this backtest. The TAIL ETF was not introduced until 2017. Therefore, the portfolio in this backtest is under allocated by 10% until the TAIL ETF was available in 2017. You can see that the 2020 Covid crash is only a small blip on the equity curve due to the TAIL ETF stepping in. The 2022 bear market on the other hand was hardly helped by the TAIL ETF. Likely because the TAIL ETF responds well to high volatility and the 2022 bear market was relatively low volatility (for a bear market). Personally, there isn’t quite enough data to decide if the TAIL ETF is worth the allocation. Maybe a small allocation would be interesting, but anything more than 5%-10% would be too much of a risk given the small set of historical data. To me, the TAIL ETF has not proven it’s worth the allocation yet.
Notes:
	Tom's Tail Portfolio

Import:
	DataSource:	Norgate
	StartDate:	Earliest
	EndDate:	Latest

	IncludeList:	VT, VGLT, SCHP, SGOL, TAIL{"ETFs"}

	IncludeList:	SPY

	SaveAs:	ETFs.rtd

Settings:
	DataFile:	ETFs.rtd
	StartDate:	1/1/2011
	EndDate:	Latest
	AccountSize:	100000

Parameters:
	allocVT:	0.3
	allocVGLT:	0.25
	allocSCHP:	0.25
	allocSGOL:	0.1
	allocTAIL:	0.1

Data:
	Entry:	InList("ETFs")
	alloc:	item("alloc{?}", ?symbol)

Library:
	EndOfQuarter: EndOfMonth and Month % 3 == 0

Strategy: Portfolio_Toms_Tail
	Allocation:	S.Equity
	Side:	Long

	Quantity:	S.Alloc * alloc
	QtyType:	Value

	EntrySetup:	Entry
	ExitRule:	EndOfQuarter

	Commission:	Min(0.01 * FillValue, Max(0.005 * Shares, 1))

Benchmark: Benchmark_SPY
	EntrySetup:	Symbol=$SPY
	ExitRule:	Dividend > 0
The Golden Butterfly ETF Portfolio:
Here’s another All Weather portfolio variation. Again it’s pretty similar to many of the previous ones we have looked at. This one has a specific allocation to small cap equities, which could provide some diversification as small caps and large caps stocks can trend at different times. The allocations are as follows:
20% equities
20% small cap value equities
20% long term bonds
20% short term bonds
20% gold
This portfolio seems to be looking for diversification within stocks and bonds for the most part (with gold thrown in the mix). Rather than the portfolio casting the net wide and trying to find many different asset classes, this portfolio has limited asset classes and is diversifying within them. Using those allocations and applying them to ETFs, that looks like this:
20% VTI
20% VIOV
20% VGLT
20% VGSH
20% SGOL
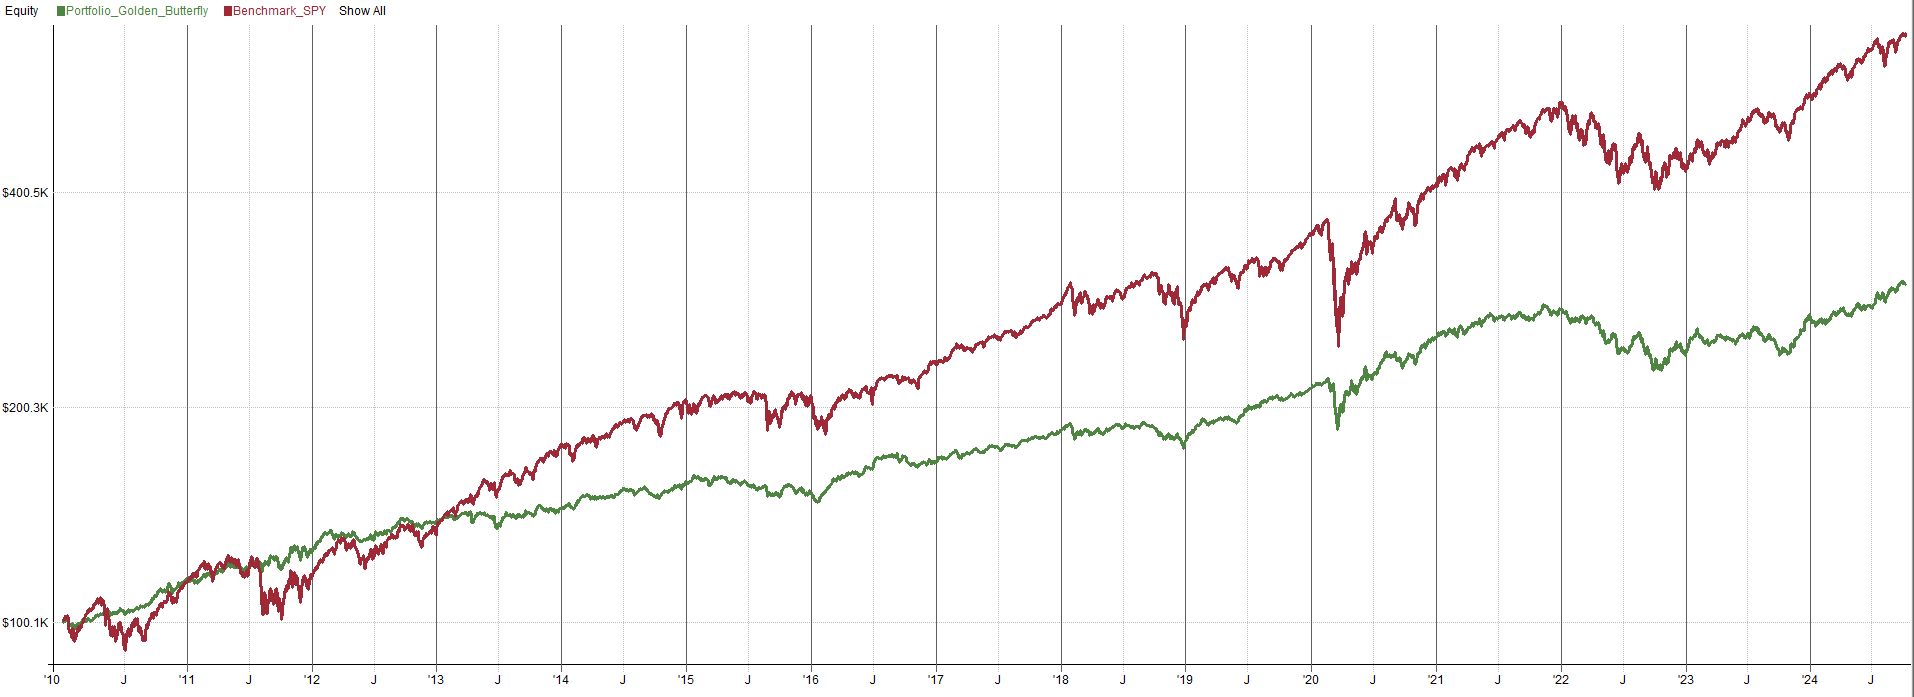

Again, this looks more or less like all the other portfolios we have looked at. One theme I am picking up on is these All Weather portfolios are all missing something, nothing seems to survive the 2022 bear market. All of these All Weather portfolios use different allocations to different ETFs, yet 2022 was still a sucky year. This is telling me that most of the ETFs used in these All Weather portfolios are correlated in 2022. This correlation is likely not something that has ever happened historically, or else these All Weather portfolios would have combated it with some other ETF that has negative correlation to everything else during a market environment like 2022.
We have to be careful here though. We are running into something called hindsight bias. Hindsight bias is when we say we would have made a decision in the past but using todays information to make that decision, but todays information was not available in the past. So if we were going to make an All Weather portfolio to combat 2022, we run into this hindsight bias. This is because the All Weather portfolio we may have made in the past would probably look different than the All Weather portfolio we will attempt to make based on this research. The All Weather portfolio we are going to try to make should hopefully survive 2022, at least better than these portfolios did. If we are not careful though, we will just curve fit something to work in 2022. In the next article in this series we will discuss how we are going to try and minimize hindsight bias and still have a robust All Weather portfolio.
Notes:
	Golden Butterfly Portfolio

Import:
	DataSource:	Norgate
	StartDate:	Earliest
	EndDate:	Latest

	IncludeList:	VTI, VIOV, VGLT, VGSH, SGOL{"ETFs"}

	IncludeList:	SPY

	SaveAs:	ETFs.rtd

Settings:
	DataFile:	ETFs.rtd
	StartDate:	1/1/2010
	EndDate:	Latest
	AccountSize:	100000

Parameters:
	allocVTI:	0.2
	allocVIOV:	0.2
	allocVGLT:	0.2
	allocVGSH:	0.2
	allocSGOL:	0.2


Data:
	Entry:	InList("ETFs")
	alloc:	item("alloc{?}", ?symbol)

Library:
	EndOfQuarter: EndOfMonth and Month % 3 == 0

Strategy: Portfolio_Golden_Butterfly
	Allocation:	S.Equity
	Side:	Long

	Quantity:	S.Alloc * alloc
	QtyType:	Value

	EntrySetup:	Entry
	ExitRule:	EndOfQuarter

	Commission:	Min(0.01 * FillValue, Max(0.005 * Shares, 1))

Benchmark: Benchmark_SPY
	EntrySetup:	Symbol=$SPY
	ExitRule:	Dividend > 0
Gyroscopic Desert ETF Portfolio:
Another portfolio I coded up was the Gyroscopic Desert Portfolio. This portfolio has a small equities and gold allocation but is mostly in bonds. The allocations are shown below:
30% equities
60% interim bonds
10% gold
Those allocations applied to ETFs looks like the following:
30% VTI
60% VGIT
10% IAUM → (replaced with GLD for backtesting purposes as it has longer history)
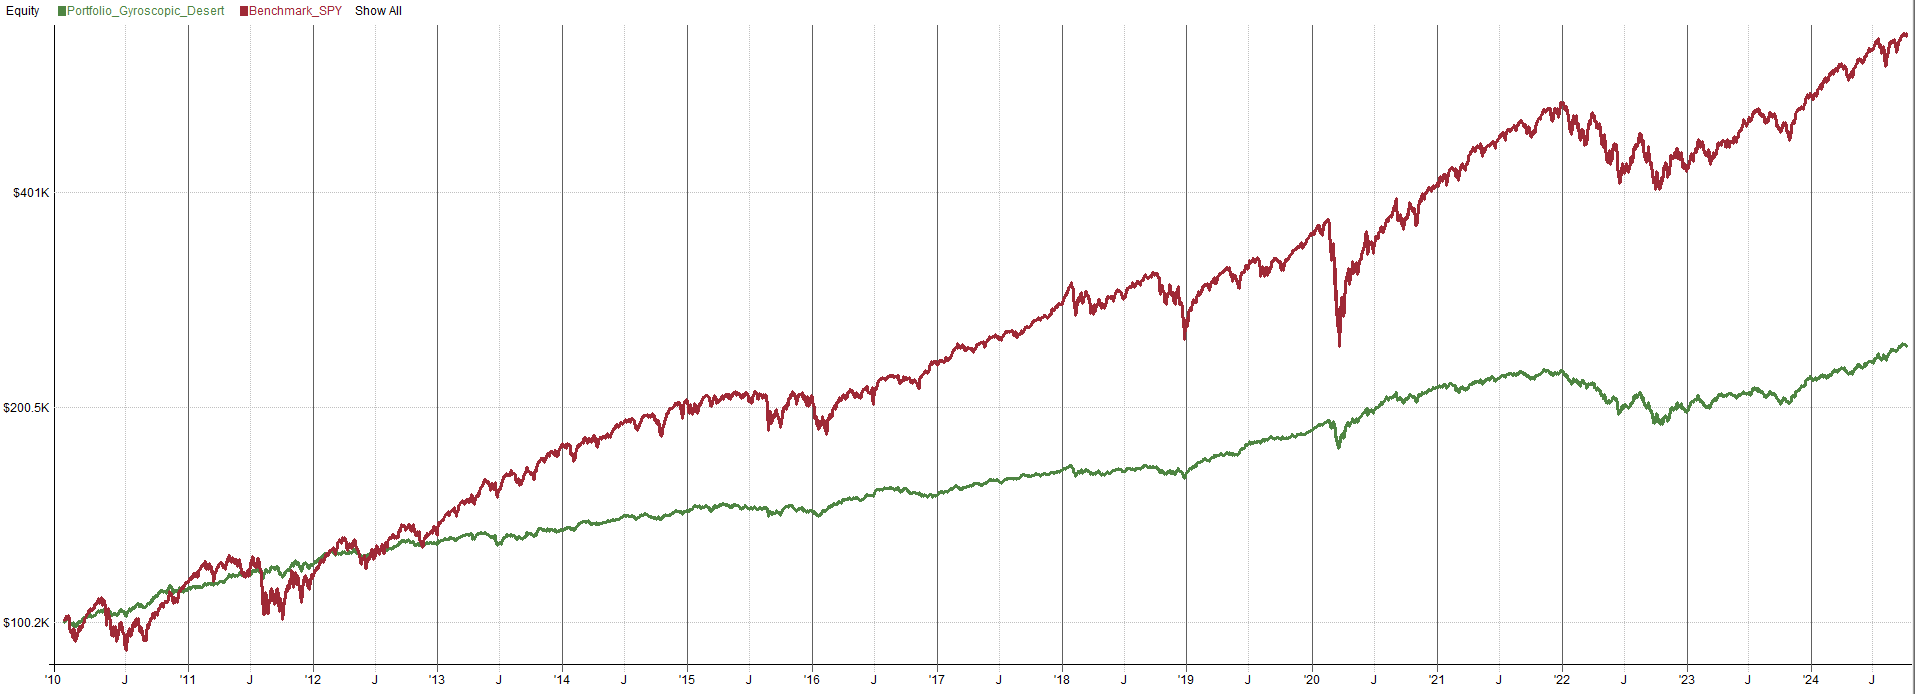

This portfolio honestly doesn’t look too bad from a volatility and drawdown standpoint. The returns are not too exciting and 2022 had a decent drawdown just like all the other All Weather portfolios, but the 2022 drawdown depth and volatility, and recovery is probably the lowest of any of the portfolios we have looked at so far. With that said, I wouldn’t invest into this portfolio as it is, it’s too boring in terms of returns. A return of 6% and a drawdown of 16% is not something to brag about, but remember this whole process is just to learn more about what works, what doesn’t, what we like, and what we don’t like about these All Weather Portfolios. If we could develop an All Weather portfolio with say 10% returns and 16% drawdown, to me that would be much more interesting.
Notes:
	Gyroscopic Desert Portfolio

Import:
	DataSource:	Norgate
	StartDate:	Earliest
	EndDate:	Latest

	IncludeList:	VTI, VGIT, GLD {"ETFs"}

	IncludeList:	SPY

	SaveAs:	ETFs.rtd

Settings:
	DataFile:	ETFs.rtd
	StartDate:	1/1/2010
	EndDate:	Latest
	AccountSize:	100000

Parameters:
	allocVTI:	0.3
	allocVGIT:	0.6
	allocGLD:	0.1


Data:
	Entry:	InList("ETFs")
	alloc:	item("alloc{?}", ?symbol)

Library:
	EndOfQuarter: EndOfMonth and Month % 3 == 0

Strategy: Portfolio_Gyroscopic_Desert
	Allocation:	S.Equity
	Side:	Long

	Quantity:	S.Alloc * alloc
	QtyType:	Value

	EntrySetup:	Entry
	ExitRule:	EndOfQuarter

	Commission:	Min(0.01 * FillValue, Max(0.005 * Shares, 1))

Benchmark: Benchmark_SPY
	EntrySetup:	Symbol=$SPY
	ExitRule:	Dividend > 0
Leveraged Gyroscopic Desert ETF Portfolio:
I mentioned the Gyroscopic Desert portfolio had boring returns. So let’s try leveraging those returns up and see what happens. We can create a leveraged version of the same portfolio with 2x or 3x leveraged ETFs. All of the allocation fractions are the same:
30% equities
60% interim bonds
10% gold
Applying those allocations to 2x and 3x leveraged ETFs:
30% UPRO (3x S&P 500)
60% TYD (3x 7-10 Year Treasury Bills)
10% UGL (2x Gold)
While this isn’t perfect because we don’t have a 3x gold ETF, it’s close enough to see if this portfolio warrants a closer look or not.
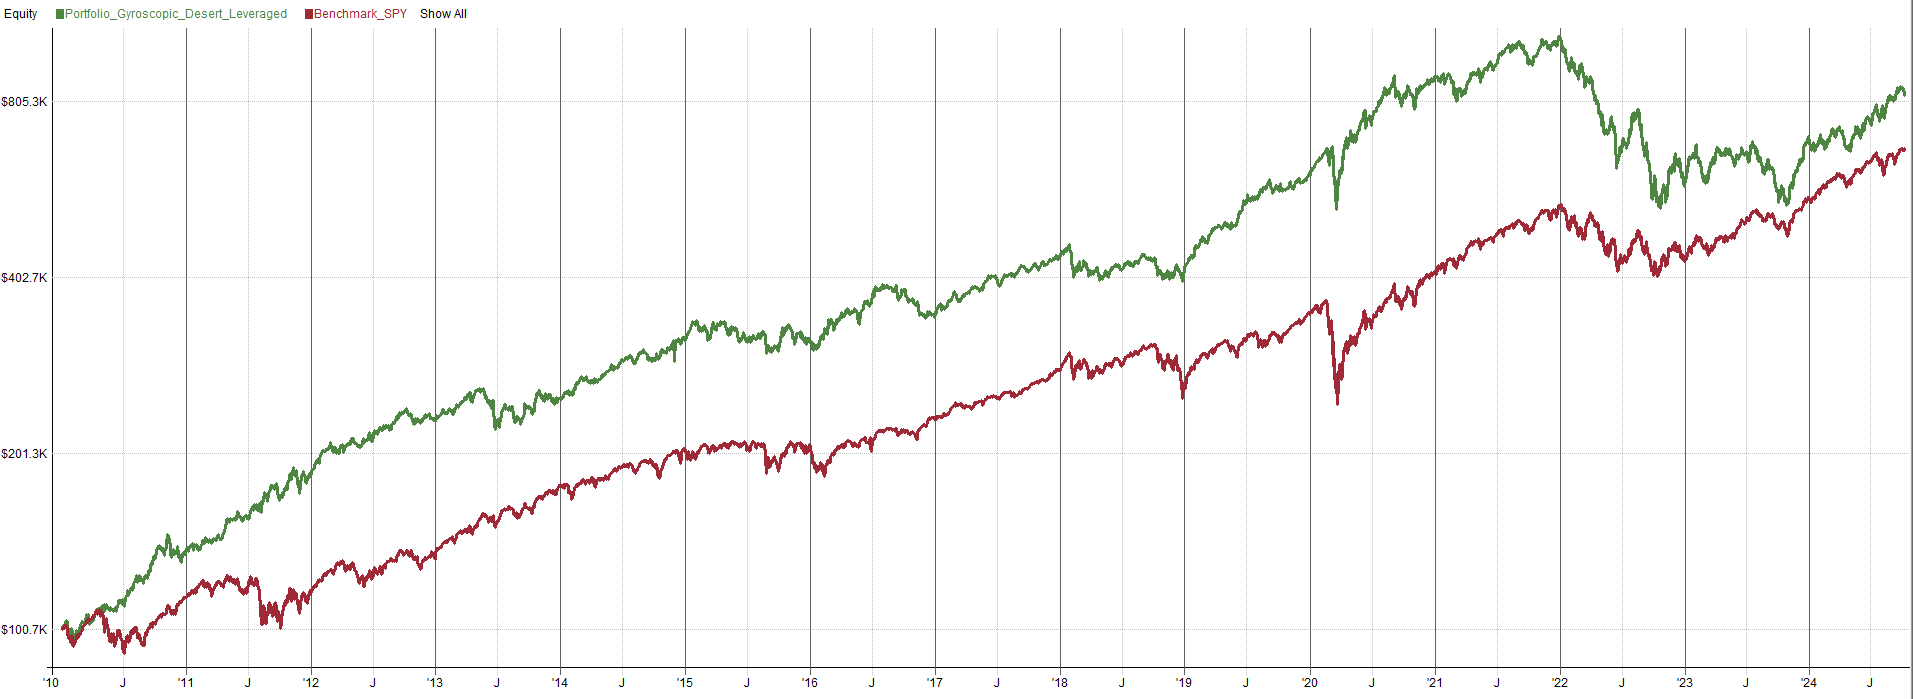

Well, the returns pre 2022 looked great, beating the S&P 500 with a pretty similar volatility level. The issue is the drawdown of 2022 created nearly a 50% drawdown, not exactly my idea of how an All Weather portfolio should behave. Again, using leveraged ETFs to get more returns just results in way higher volatility than what I would consider acceptable. That being said, I still like the idea of “return stacking” these leveraged ETFs, where we give a leveraged ETF less allocation so we can get the same or similar returns as the unleveraged ETF and then invest the rest into something else. This is definitely an idea I want to mess with when we make our own All Weather portfolio.
Notes:
	Leveraged Gyroscopic Desert Portfolio

Import:
	DataSource:	Norgate
	StartDate:	Earliest
	EndDate:	Latest

	IncludeList:	UPRO, TYD, UGL {"ETFs"}

	IncludeList:	SPY

	SaveAs:	ETFs.rtd

Settings:
	DataFile:	ETFs.rtd
	StartDate:	1/1/2010
	EndDate:	Latest
	AccountSize:	100000

Parameters:
	allocUPRO:	0.3
	allocTYD:	0.6
	allocUGL:	0.1


Data:
	Entry:	InList("ETFs")
	alloc:	item("alloc{?}", ?symbol)

Library:
	EndOfQuarter: EndOfMonth and Month % 3 == 0

Strategy: Portfolio_Gyroscopic_Desert_Leveraged
	Allocation:	S.Equity
	Side:	Long

	Quantity:	S.Alloc * alloc
	QtyType:	Value

	EntrySetup:	Entry
	ExitRule:	EndOfQuarter

	Commission:	Min(0.01 * FillValue, Max(0.005 * Shares, 1))

Benchmark: Benchmark_SPY
	EntrySetup:	Symbol=$SPY
	ExitRule:	Dividend > 0
The 2022 All Weather Portfolio
This is the last portfolio I looked at for this preliminary All Weather portfolio study. To be honest, I was pretty let down by all the other portfolios. I thought at least one or two had to be decent. In my personal opinion all the previous portfolios kind of sucked and were killed in 2022. 2022 obviously has some market characteristic we haven’t seen historically as many asset classes commonly found in an All Weather portfolio became correlated. When all assets in a portfolio become correlated, that defeats the purpose of an All Weather portfolio.
I wanted to try and find a portfolio that worked in 2022 so I could learn from it. I was trying to answer the question: “was 2022 a one time anomaly and unavoidable, or was it a correlation event that was simply overlooked and could have been avoided with proper diversification”. I went back to good ol’ google to see what I could find and stumbled across a Seeking Alpha article discussing an All Weather portfolio that worked better in 2022:
Seeking Alpha: The 2022 All Weather Portfolio
I’ll let you read up on the authors philosophy, I would summarize it but I guess my free trial period for seeking alpha expired and I can’t access the site anymore. Good thing I wrote the ETFs and allocations down before that happened! Anyway the allocations look like this:
5% REITs
10% commodities
5% energy equities
5% gold
20% short term treasury bonds
15% long term treasury bonds
20% global equities
10% consumer staples equities
10% healthcare stocks
Wow, that’s a lot more ETFs than any of the previous All Weather portfolios. There a couple new allocations we have not seen yet in an All Weather portfolio, these extra allocations should help diversify the portfolio further. Maybe with the further diversification, this portfolio will survive 2022? Let’s find out and apply those allocations to a list of ETFs and code up the portfolio:
5% RQI
10% DBC
5% IYE
5% GLD
20% SHY
15% TLT
20% VT
10% XLP
10% IYH
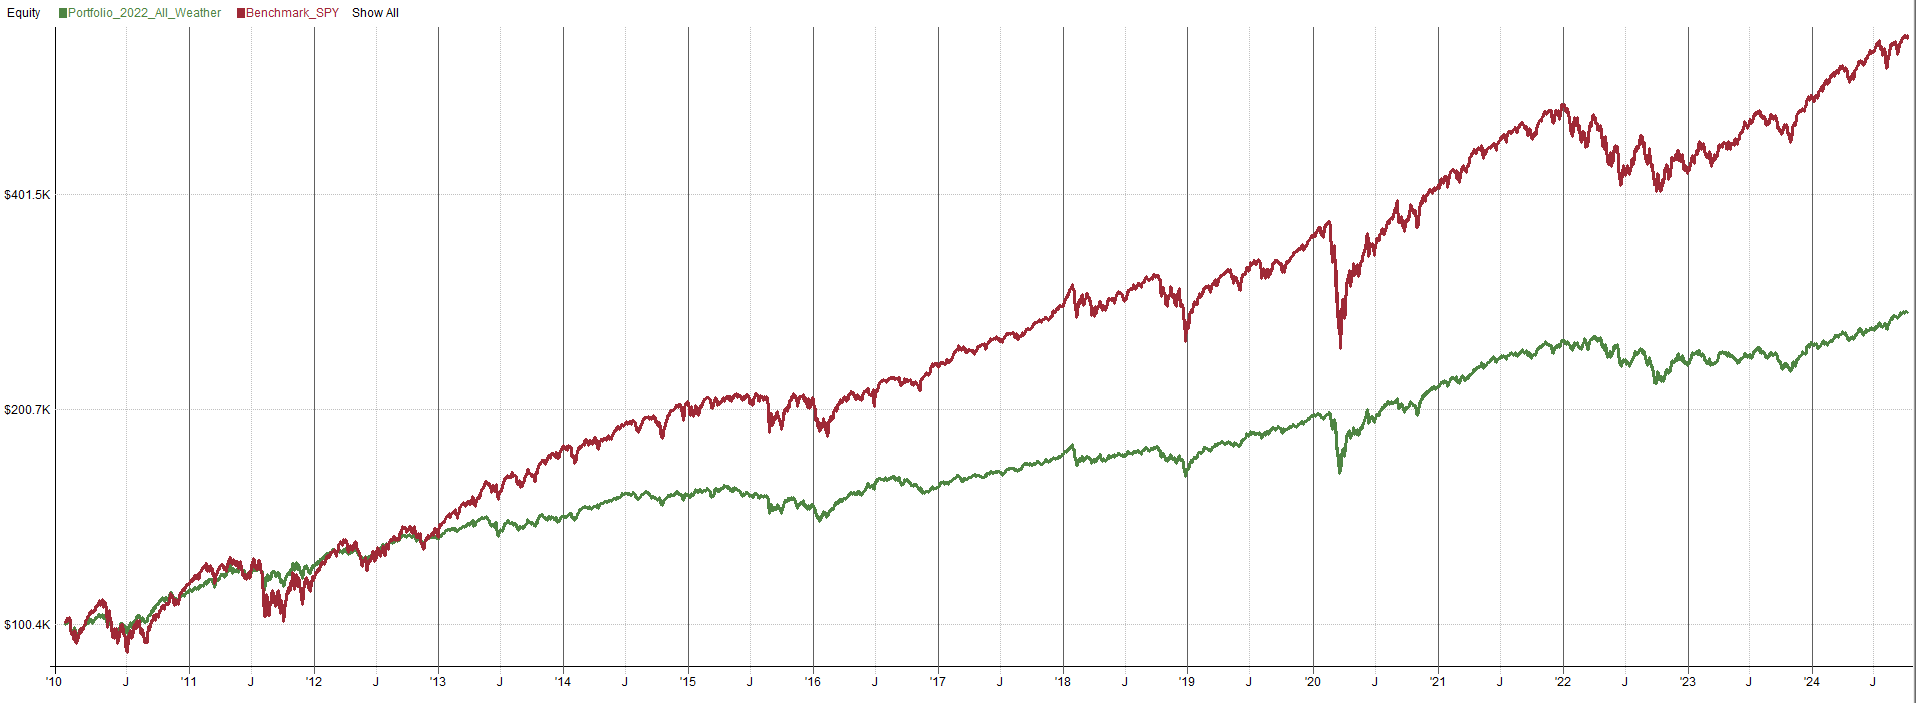

I like this portfolio the best out of every All Weather portfolio we have coded up. This one is more diversified, using more ETFs representing different asset classes. On top of the assets that are in most of the other All Weather portfolios we looked at, this one also includes REITs, energy, healthcare, and consumer staples. These have different economic drivers than say gold or bonds or treasury bills and I would expect them to perform well at slightly different times. The larger diversification within this portfolio is likely what allowed it to survive 2022 with minimal drawdown. 2022 was still a tough time, but in this portfolio had relatively flat performance, as opposed to a massive unforeseen drawdown like the other portfolios. What this tells me is when we create our own All Weather portfolio we want more ETFs covering more asset classes. This will help us survive unforeseen market conditions in the future. We should select as many uncorrelated ETFs as possible, regardless of if they performed well in the past or not. We just want a solid list of ETFs that perform well during different time periods.
One thing that’s super interesting is the article outlining this portfolio was posted in April of 2022. during that time we were only at the very beginning of the 2022 bear market. What this means is 90% of the period in 2022 where all of the other All Weather portfolios struggled, this portfolio worked well on out of sample data. This gives me more confidence the developer of this All Weather portfolio did not just data mine a list of ETFs and allocations that survived 2022. I think when we start to create our own version of an All Weather portfolio, it’s probably best to use this one as a starting point. Then from there, we can add our own twists and original ideas.
Notes:
	2022 All Weather Portfolio

Import:
	DataSource:	Norgate
	StartDate:	Earliest
	EndDate:	Latest

	IncludeList:	RQI, DBC, IYE, GLD, SHY, TLT, VT, XLP, IYH {"ETFs"}

	IncludeList:	SPY

	SaveAs:	ETFs.rtd

Settings:
	DataFile:	ETFs.rtd
	StartDate:	1/1/2010
	EndDate:	Latest
	AccountSize:	100000

Parameters:
	allocRQI:	0.05
	allocDBC:	0.1
	allocIYE:	0.05
	allocGLD:	0.05
	allocSHY:	0.2
	allocTLT:	0.15
	allocVT:	0.2
	allocXLP:	0.1
	allocIYH:	0.1


Data:
	Entry:	InList("ETFs")
	alloc:	item("alloc{?}", ?symbol)

Library:
	EndOfQuarter: EndOfMonth and Month % 3 == 0

Strategy: Portfolio_2022_All_Weather
	Allocation:	S.Equity
	Side:	Long

	Quantity:	S.Alloc * alloc
	QtyType:	Value

	EntrySetup:	Entry
	ExitRule:	EndOfQuarter

	Commission:	Min(0.01 * FillValue, Max(0.005 * Shares, 1))

Benchmark: Benchmark_SPY
	EntrySetup:	Symbol=$SPY
	ExitRule:	Dividend > 0
Conclusions:
So after coding up and testing a lot of these “off the shelf” All Weather portfolios, there was really only one that was somewhat interesting. Many of these All Weather portfolios seemed to have lost their effectiveness in the 2022 bear market. 2022 was a year with different market characteristics than in recent history. What this shows is the markets can throw curve balls that cause these portfolios to not work as well. That kind of defeats the purpose of an All Weather portfolio, they should survive most market scenarios, but obviously they are not robust enough to do so.
So, in the part 2 of this series we are going to take the traditional All Weather portfolio and turn it on its head. We are going to explore a more robust All Weather portfolio approach and will share a couple different versions of an All Weather portfolio. One version will be a classic static allocation where ETFs allocations are held constant through time. Another version will be a tactical allocation, where allocations are held constant but the portfolio picks and chooses which ETFs are the best own now. Finally, a third version of the All Weather portfolio will have allocations recalculated and adjusted over time and the portfolio picks and chooses which ETFs are the best to own now. These modifications to the traditional All Weather portfolio will improve the overall performance and make the All Weather portfolio something worth trading. So you don’t want to miss that! I’ll see you there.
Thank you for posting a phenomenal article with fascinating insights. Really appreciate the timeyou put in to your posts, they are top quality.
What a great article! It was a great read. Looking forward to part 2 and 3 since I am as well looking at the same concept currently.