

2025: A Year In Review
Portfolio Performance, New Systems, Broken Systems, Best Trades, Worst Trades, and What's Next?


Welcome to the “Systematic Trading with TradeQuantiX” newsletter, your go-to resource for all things systematic trading. This publication will equip you with a complete toolkit to support your systematic trading journey, sent straight to your inbox. Remember, it’s more than just another newsletter; it’s everything you need to be a successful systematic trader.
Introduction:
It’s hard to believe that 2025 is already coming to an end and 2026 is just around the corner. This year has been full of meaningful wins and improvements, both in my systematic trading portfolio and on a personal level.
In this post, I will cover the following:
2025 live systematic trading performance update
Live performance compared to backtested performance
New systems added to the portfolio in 2025
System-by-system performance since inception
Biggest winning and losing trades in 2025
Planned portfolio updates for 2026
Long term goals (2026 and beyond)
Non-trading related wins in 2026
Let’s get into it!
Portfolio Performance Charts:
We’ll start with what I would assume people care about the most, my systematic trading portfolio performance.
2025 was my best year thus far.
For anyone unaware, I started trying to figure out systematic trading in 2020. I spent 3-ish years performing all the most common retail mistakes of curve fitting, trying to make the holy grail system, falling for fake gurus, and ultimately losing money.
About 2.5 years ago I changed my methods and my equity curve started heading in the right direction. I’m still trying to figure this whole systematic trading thing out, but I think I’m getting closer every year.
2025 Live Recorded Performance:
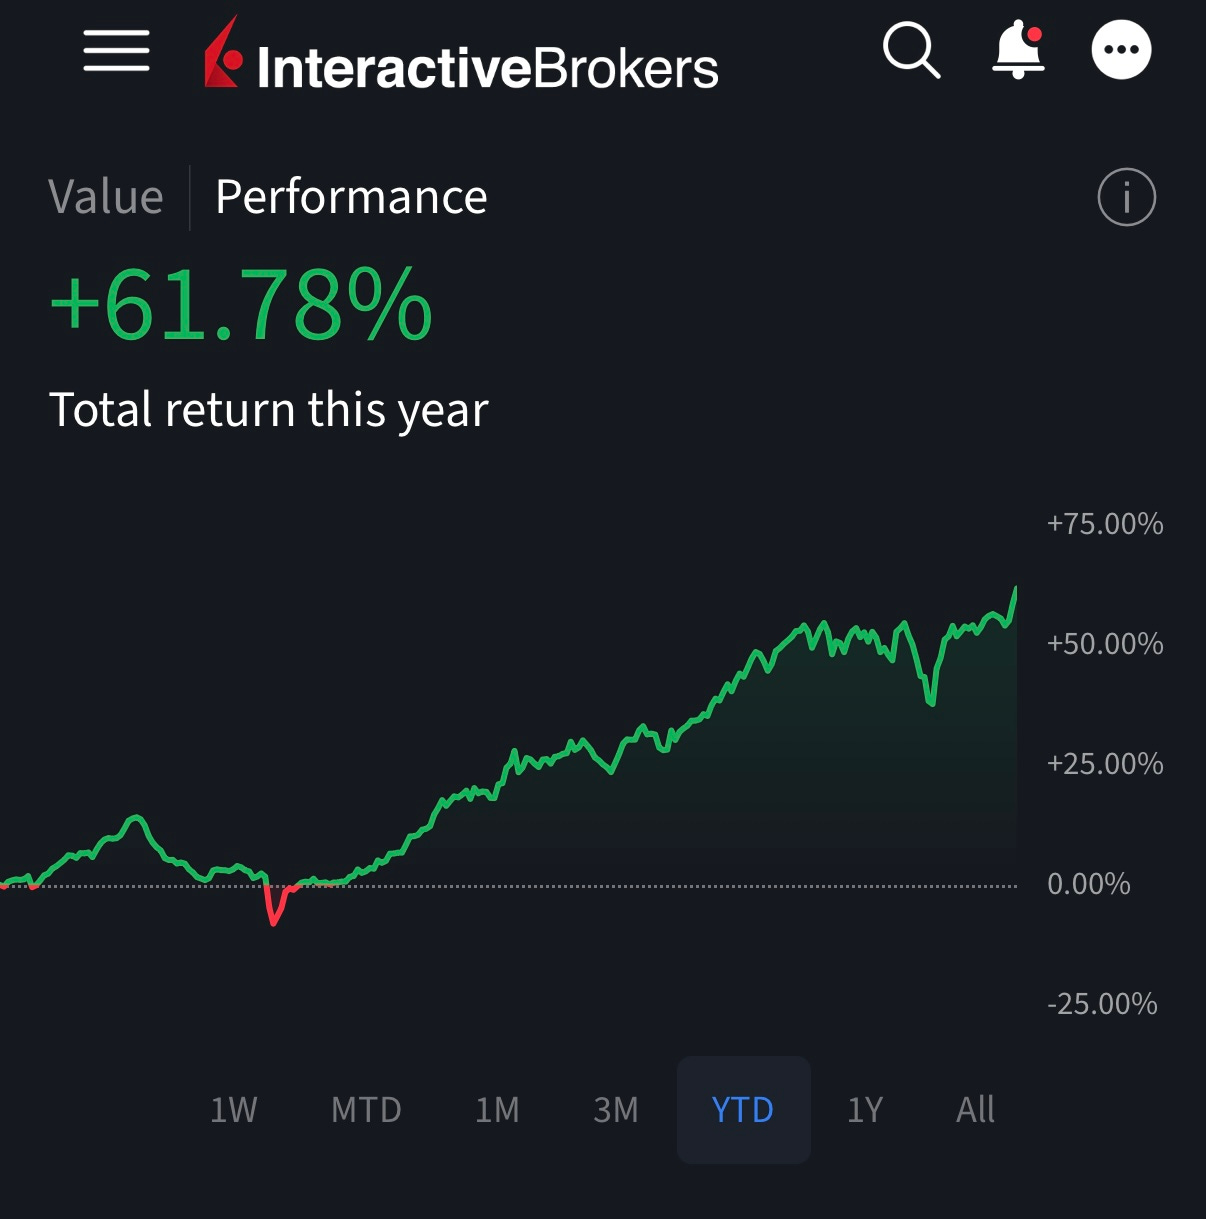
Not too shabby, I can’t complain about 61%, especially considering the S&P 500 returned ~16.6%.
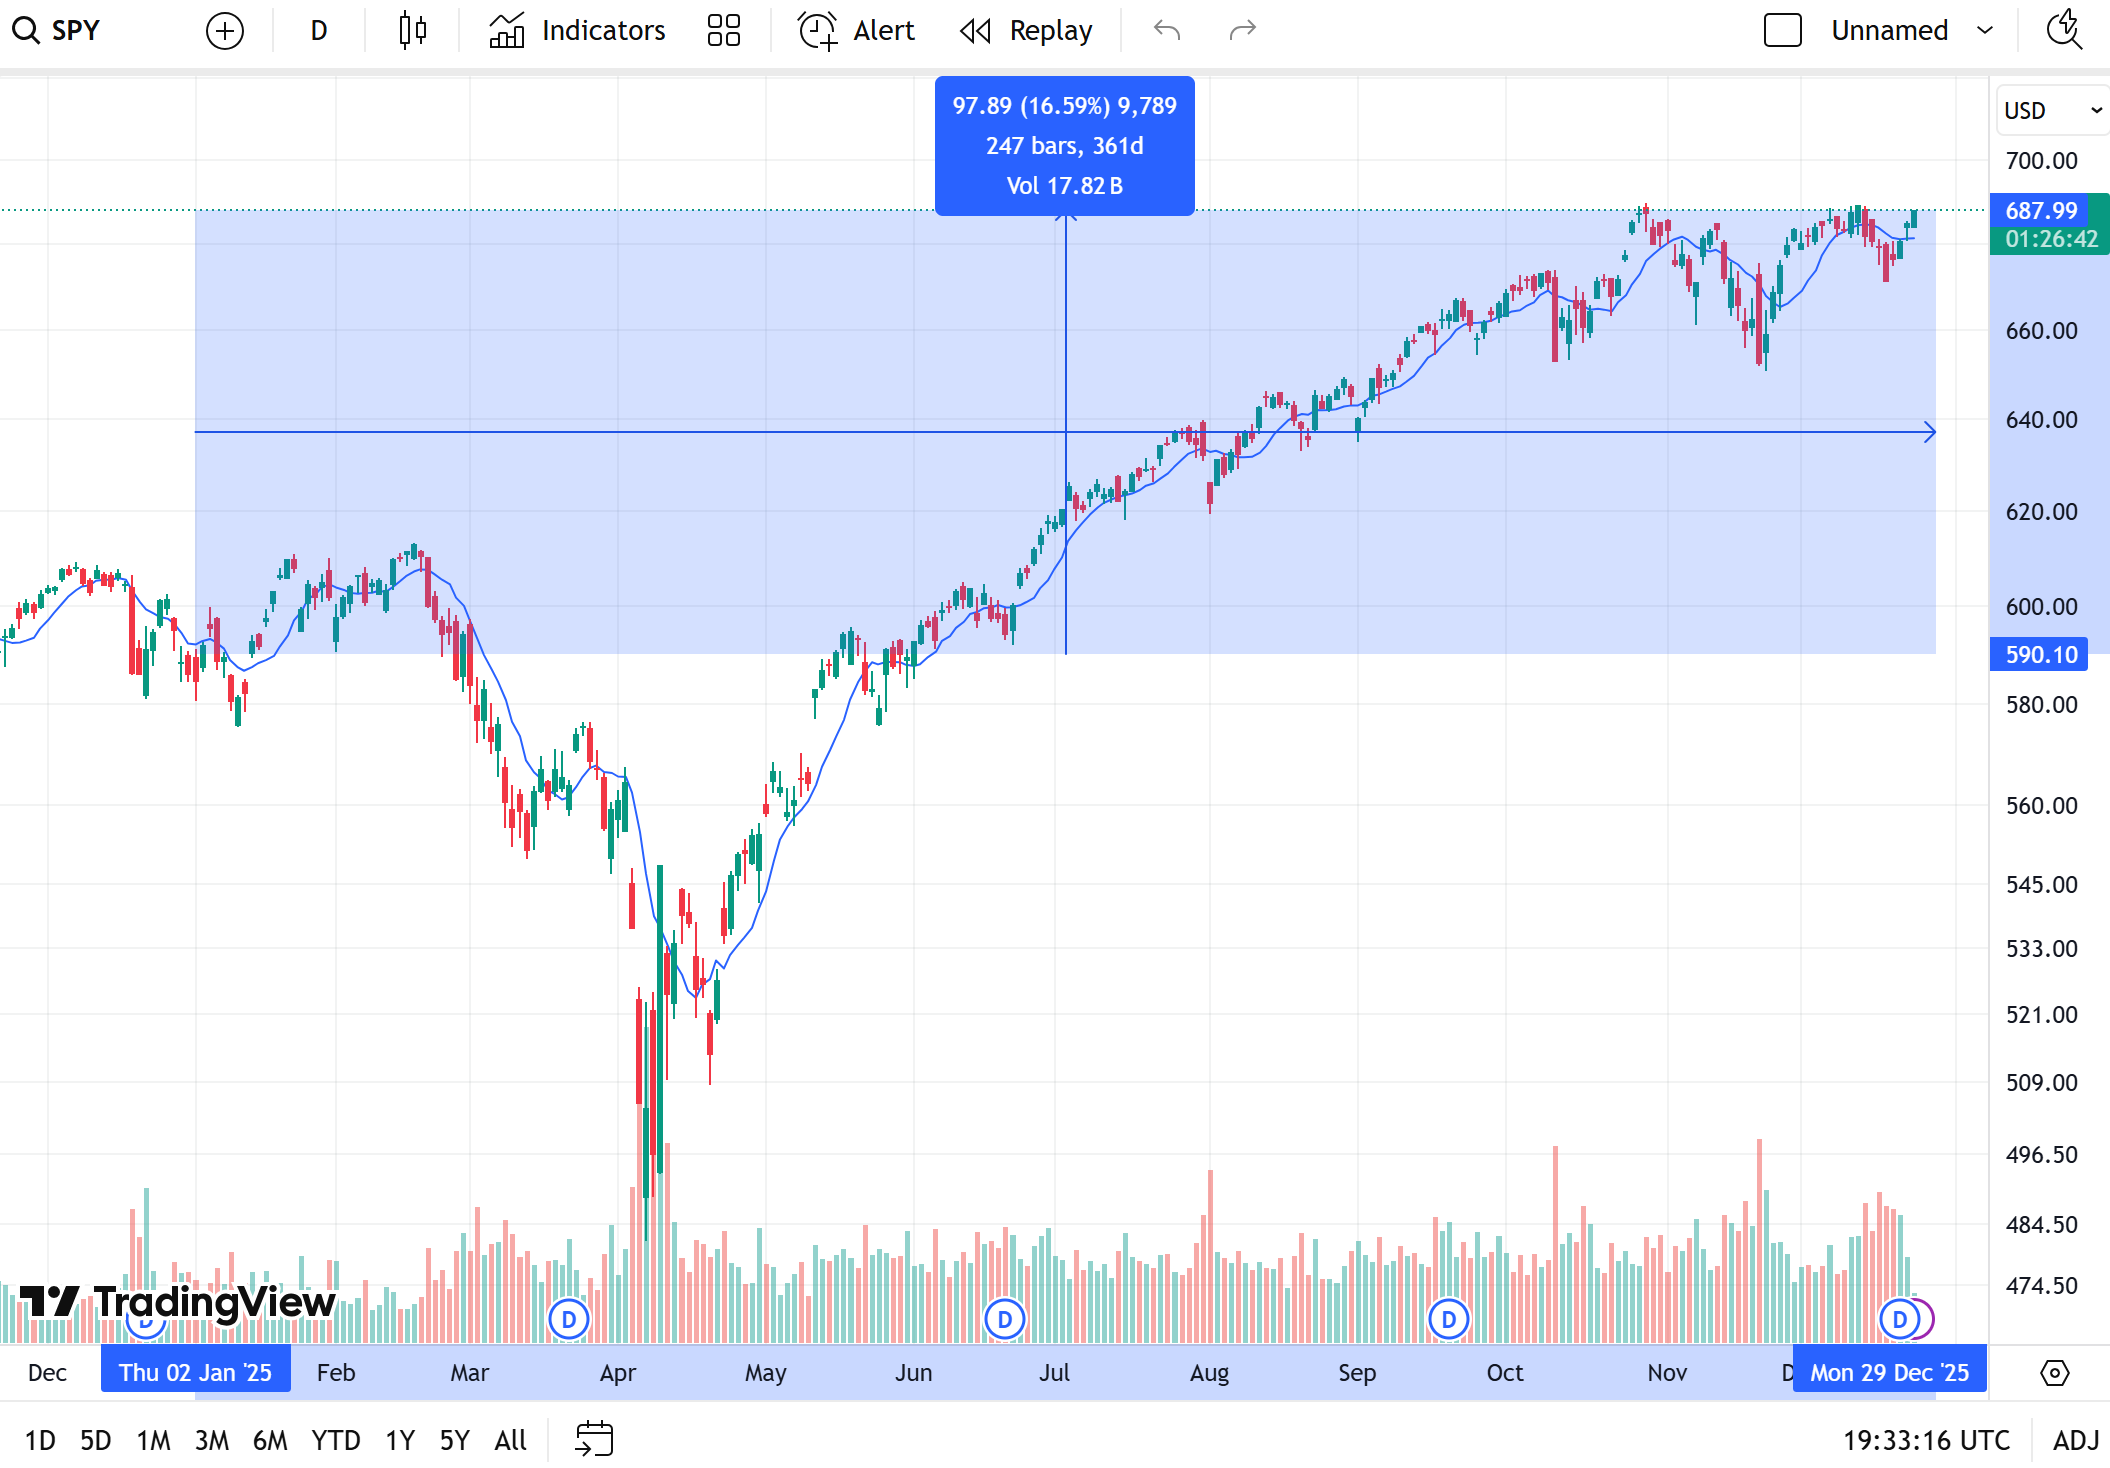
While a portfolio return of 61% is spectacular in my book, I cannot expect this every year. This is definitely on the upper end of returns when I compare back to my longer term backtested performance.
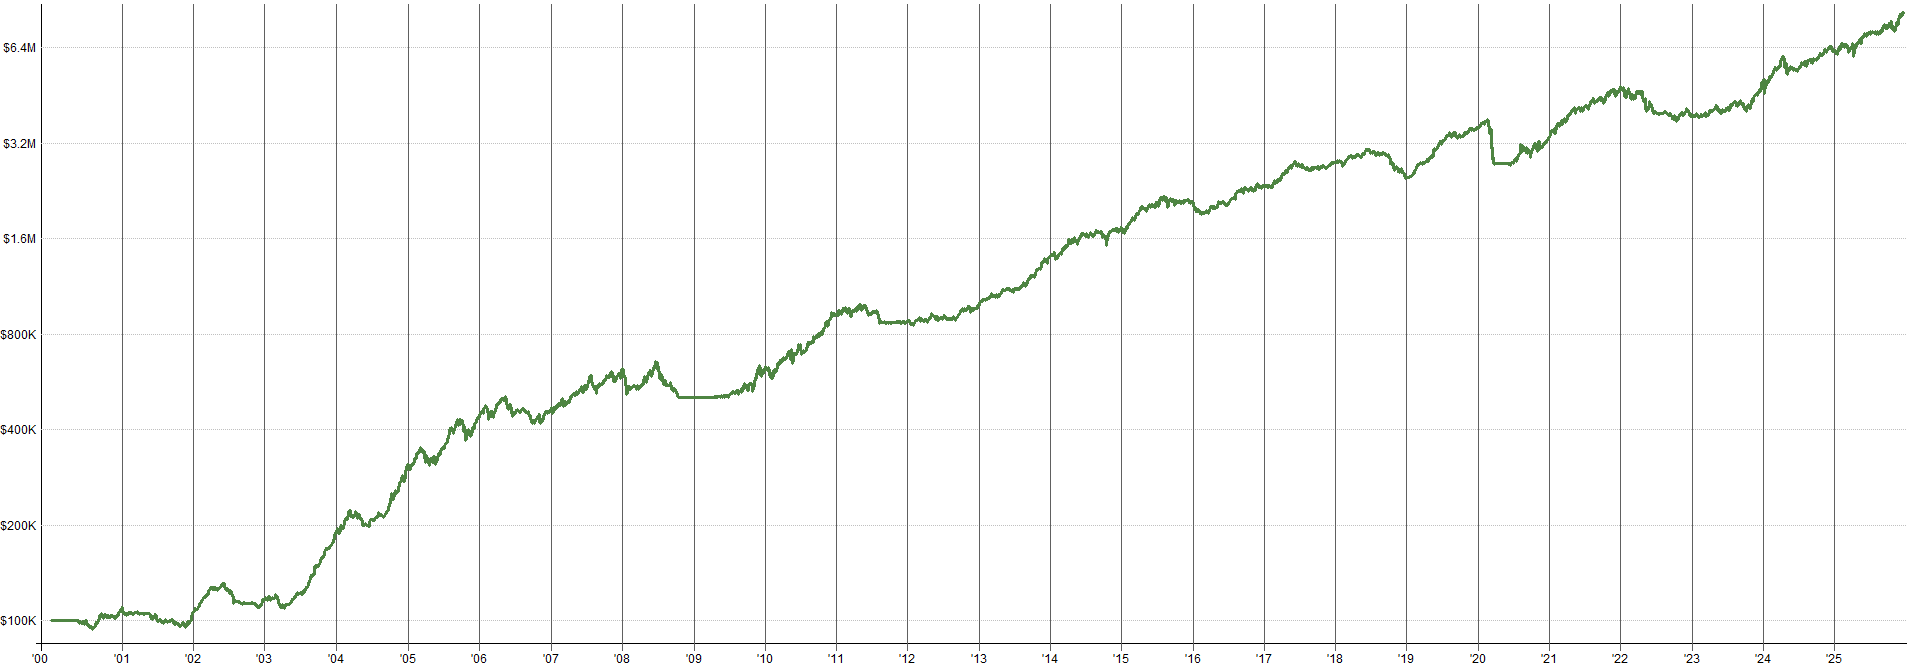
10 Year Backtested Performance (Equity Curve, Performance Stats, and Drawdown Plot):
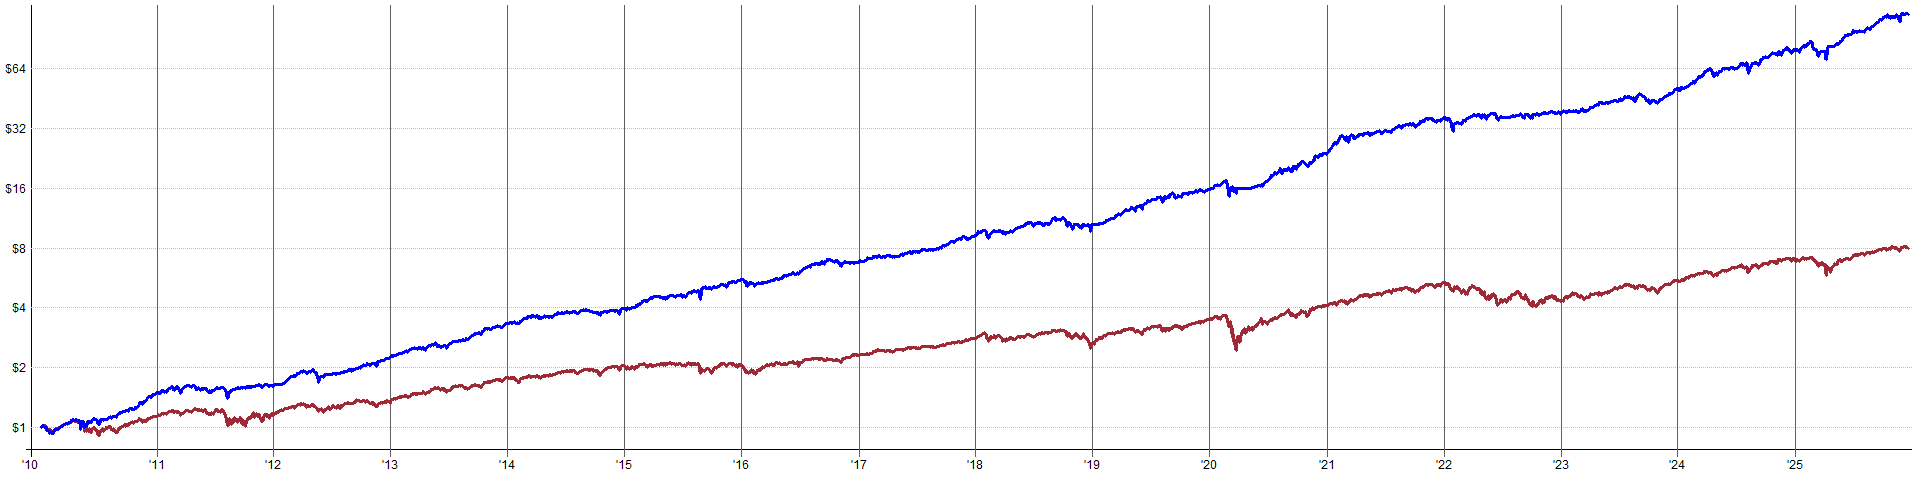

Above is my systematic trading portfolio (blue) compared to the S&P 500 since 2010. For anyone wondering, the pre-2010 timeframe actually performs even better than the post-2010 timeframe.
The reason why I am only showing post-2010 is because I literally can’t backtest that far back all at once anymore. I simply do not have the computer power, I froze my PC multiple times trying to run a backtest from the early 1990’s until today. I am debating buying a better PC next year because I do think it’s important to be able to work with as much data as possible when making portfolio level decisions.
The reason why backtesting back until the 1990’s takes so much computer power is because I’m trading many systems across three markets: USA, ASX, and TSX. That’s over 50,000 stock ticker symbols which need to be processed every day in the portfolio backtest. Just since 2010, that’s over 200 million computations per indicator. So, you could see how that could add up pretty fast…
Could I make my coding more efficient to reduce the number of computations? Maybe, but why would I do that when I can use it as an excuse to buy a new PC?
Anyway, one thing I don’t like about my portfolio is I hold a lot of leveraged beta. You can tell because the equity curve shape somewhat mirrors the S&P 500, just with higher returns (but also lower drawdowns!).
This intuitively makes sense because I trade a lot of trend and momentum systems. That said, I want to start exploring systems that hold very little beta and have lesser correlation to the underlying market. I do have some hedging systems and systems that have relatively low correlation to the general market, but I need more. Hence, 2026 will be the year of diversification in the portfolio.
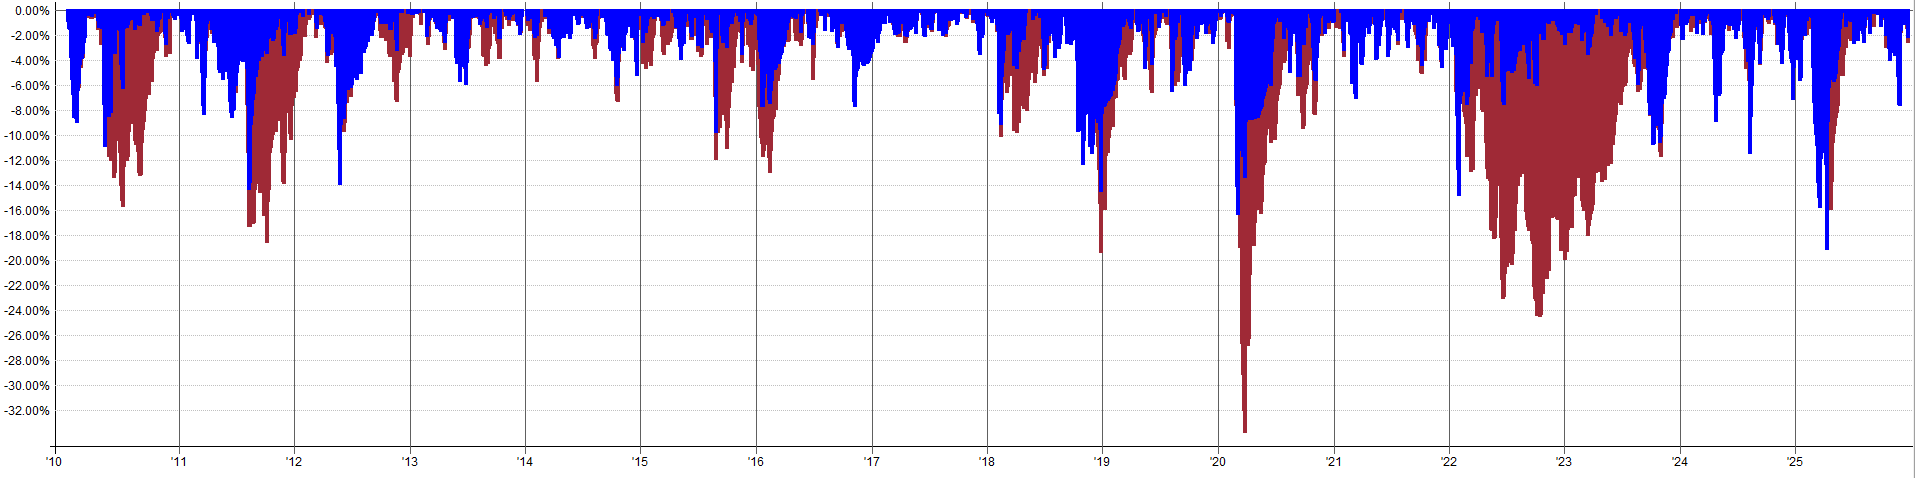
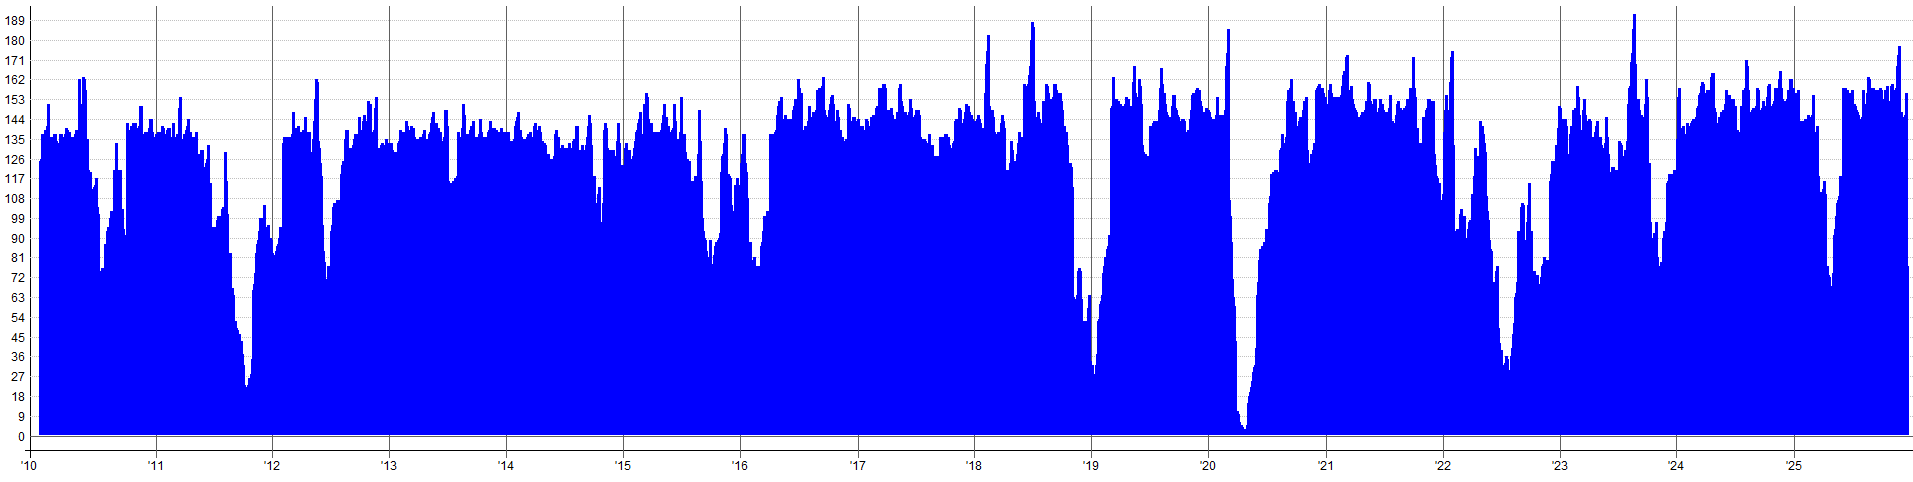
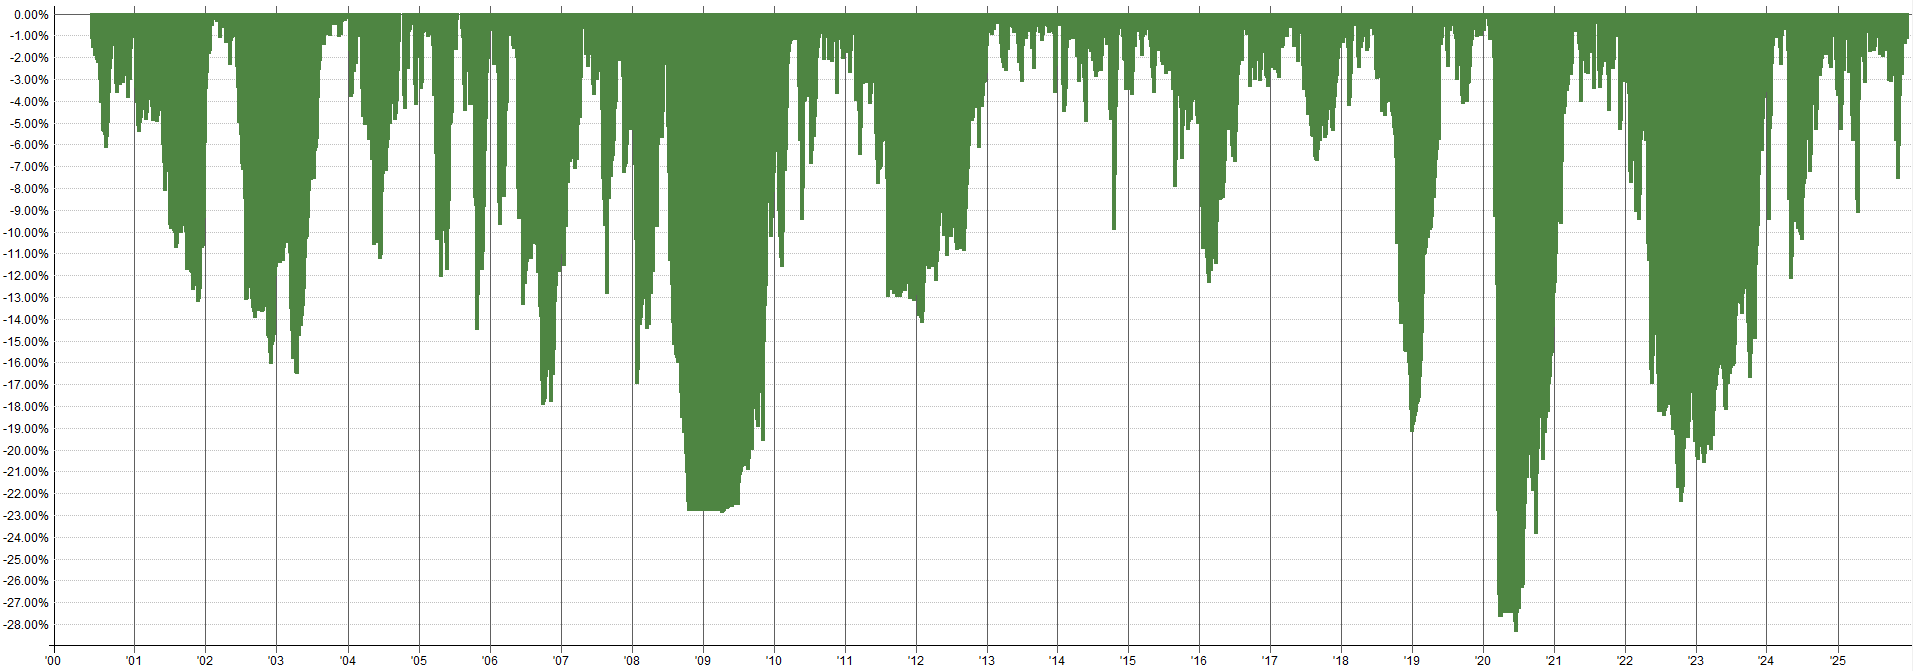
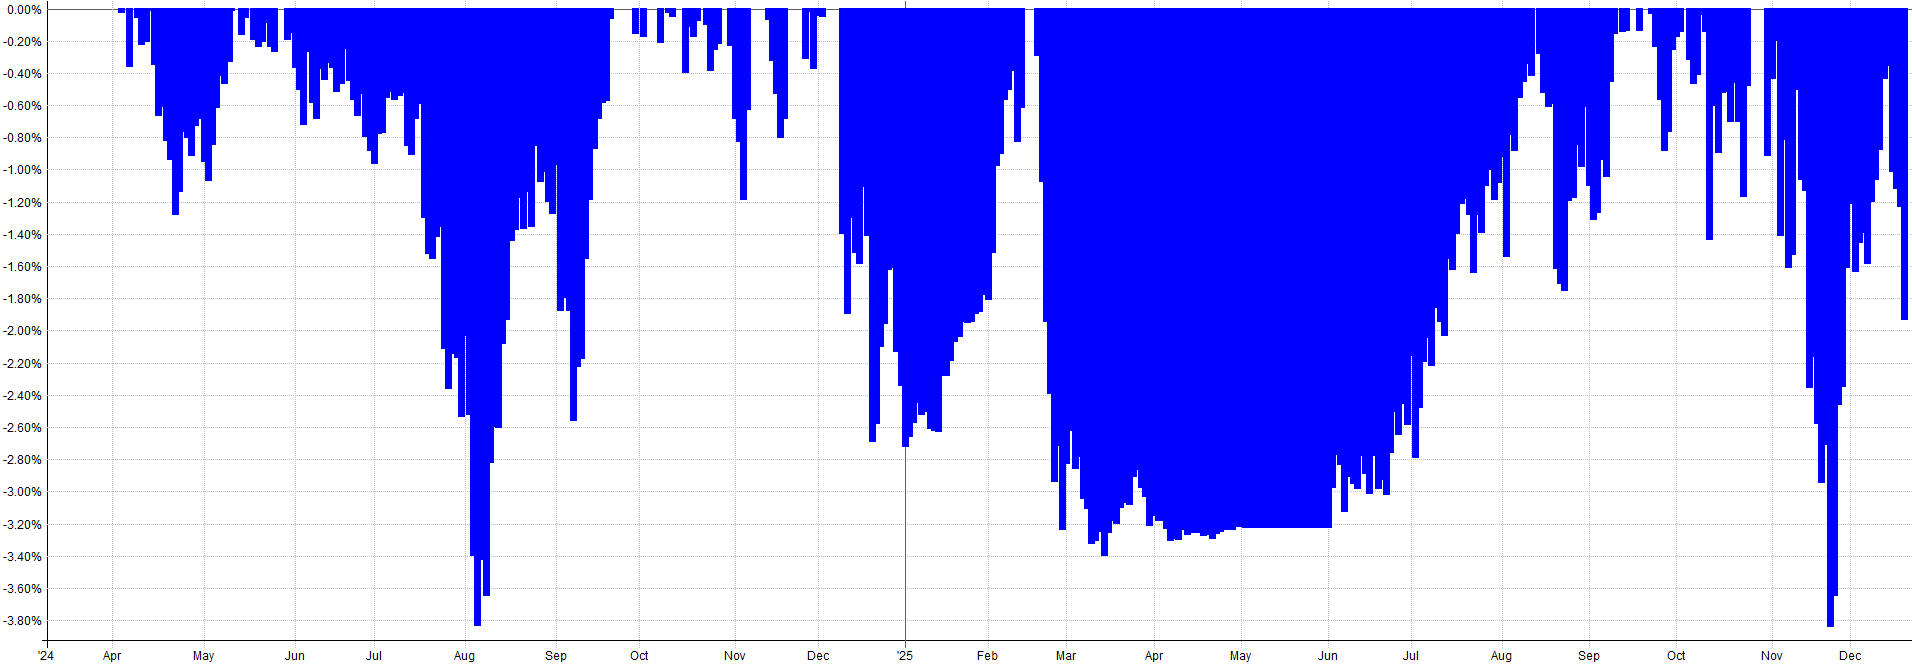
10 Year Backtested Performance (Drawdown Length Plot):
A cool plot I don’t see too often is the drawdown length plot. This shows how many days the portfolio has been in a drawdown historically.
Most of the time I am only in a drawdown for a handful of days, but occasionally I’m in a drawdown for over 6 months.
If you run a portfolio backtest pre-2010, there are periods where I would have been in a drawdown for over a year. So patience is key!
10 Year Backtested Performance (Exposure Plot):
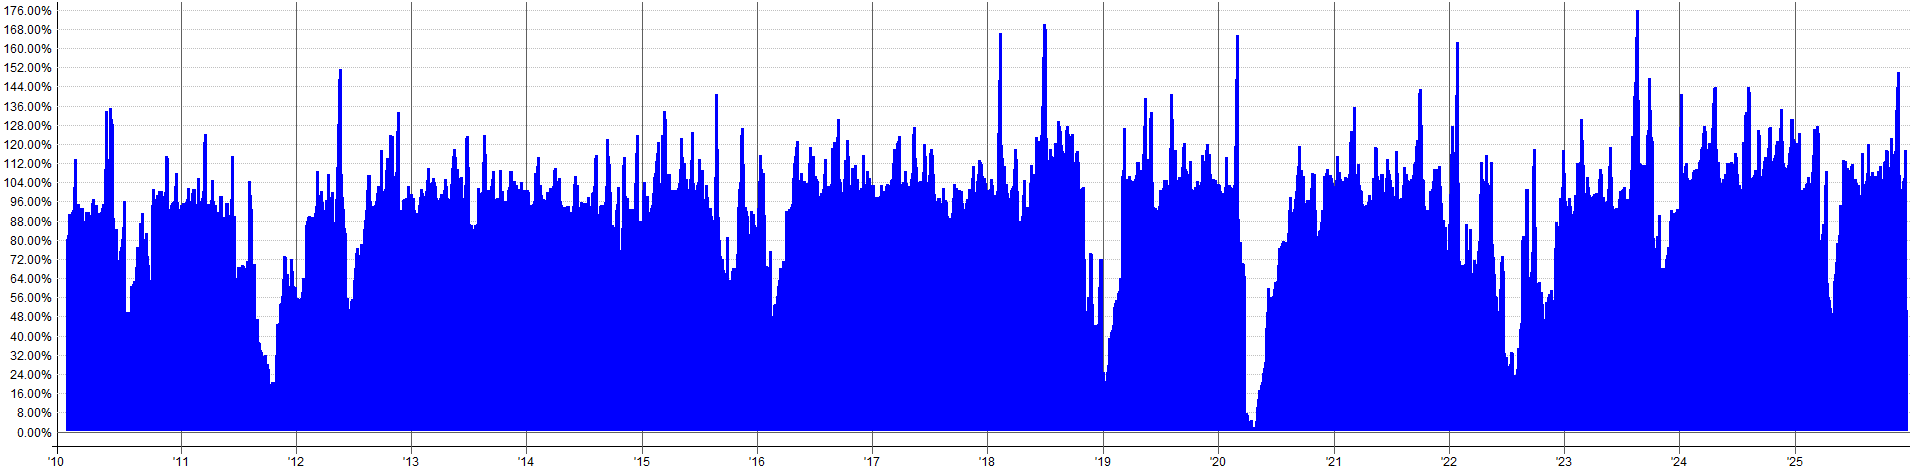
I think it’s important to point out that in my portfolio I do use leverage from time to time. I try not to hold leverage for very extended periods of time, rather just short term spikes.
Generally speaking, I use leverage when I am fully allocated or near fully allocated to my longer term trend/momentum systems and then a short term trading systems kick on (like a mean reversion system). These scenarios tend to kick me into some leverage.
While this is riskier than using only cash (no leverage), I am typically only using leverage for a short period of time (lasting just a couple of days on average). I’m comfortable holding modest leverage for brief periods of time to allow my shorter term systems to trade.
I’ll note, while I am okay with some leverage, I do think my current allocations can cause leverage can spike just a little too high. This year, my portfolio spiked to around 150% exposure at one point and I was a bit uncomfortable.
Hence, I am slowly trying to shift around some system allocations to reduce the amount of leverage the portfolio can use. I would prefer to cap short term leverage at closer to 140%.
It’s all an iterative and continuous improvement project for me. Once I learn something new or test my own psychological limits, I take those learnings and experiences and use them as a feedback loop to tune the behavior of the portfolio such that it only gets better over time.
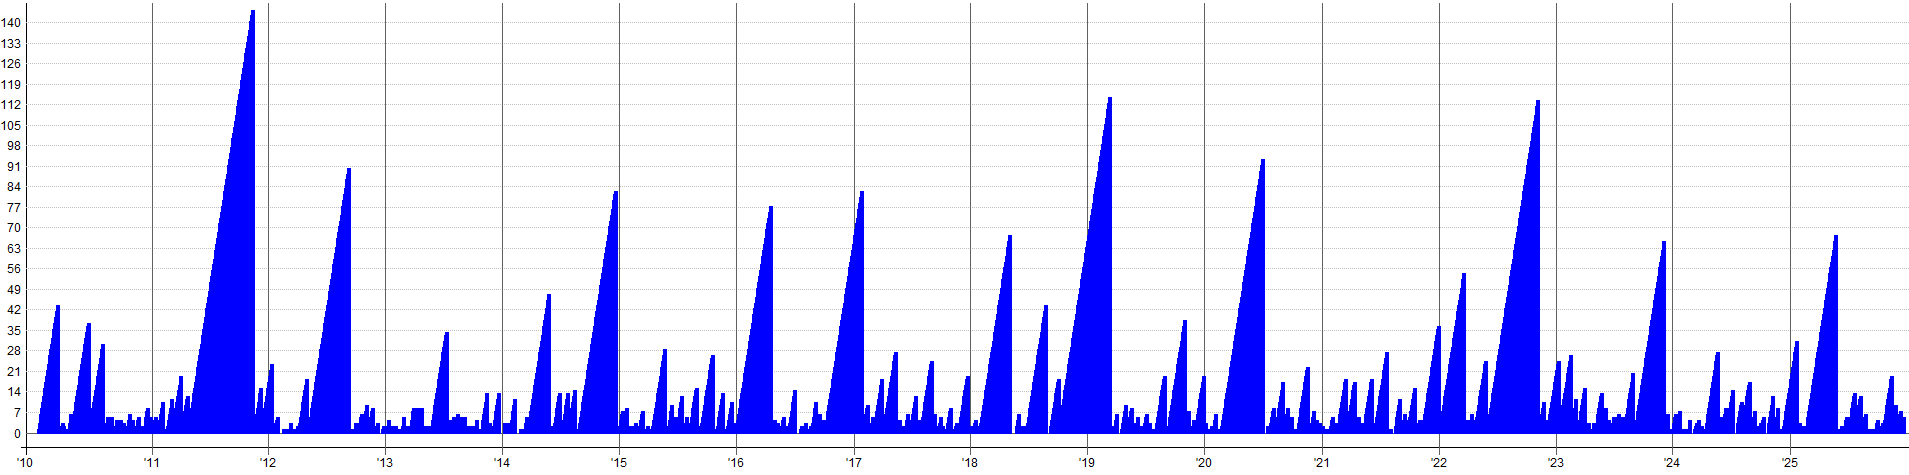
10 Year Backtested Performance (Number Of Position Held Plot):
You’ll notice my portfolio holds many positions at once. Commonly sitting at 130-140 different stocks and occasionally spiking up to 180+. Luckily I use an order management software to keep tabs on all these positions because I could never track all of this myself.
Generally, I have no idea what stocks I hold. I could maybe list off 4 or 5 just because I noticed the ticker and I am familiar with the company; but I don’t know what 97% of my positions are.
And frankly, I don’t really care. These stocks are displaying some sort of momentum, trend, or mean reverting qualities and thus my systems buy or sell them. That’s all that matters to me.
So don’t ask me what stocks to buy or what the next hot sector will be because I have no idea. I don’t even know what I currently hold in my own portfolio. Usually when I tell people that they look at me funny, which is always entertaining.
Newest System Additions In 2025:
This year I implemented two new systems into the trading portfolio. At this point, I am basically at capacity in terms of the number of systems I can trade in relation to my account size. But I am currently saving up some cash so I can add it to the portfolio and deploy more systems in 2026.
System #1:
The first system I added in 2025 was a Canadian (TSX) stock weekly trend-following system. I already traded a daily trend-following system on the TSX, but I figured moving to a higher timeframe would filter out noise and capture even longer term trends.
I’m a big believer in stacking multiple simple, but different, systems together. One system may operate on the daily timeframe, another on the weekly, one system may be looking for breakouts to new highs, another may be chasing relative momentum, one system may use short term lookbacks, another uses long term etc.
What this does is stack multiple simple features together, and when they are all traded side-by-side it creates a sort of meta-system that naturally scales into the strongest stocks and scales out of the weakest stocks.
The concept of the new TSX weekly trend following system is extremely simple: buy higher-timeframe/very long term breakouts. That’s it. Despite the simplicity, the historical performance has been powerful and should meaningfully add to my portfolio over time.
The system holds positions for very long periods of time, often many months or even years, but that’s intentional. Once the system captures a big winner, I want to hold it as long as the trend persists.
Market: TSX
Type: Trend Following
Side: Long
Timeframe: Weekly

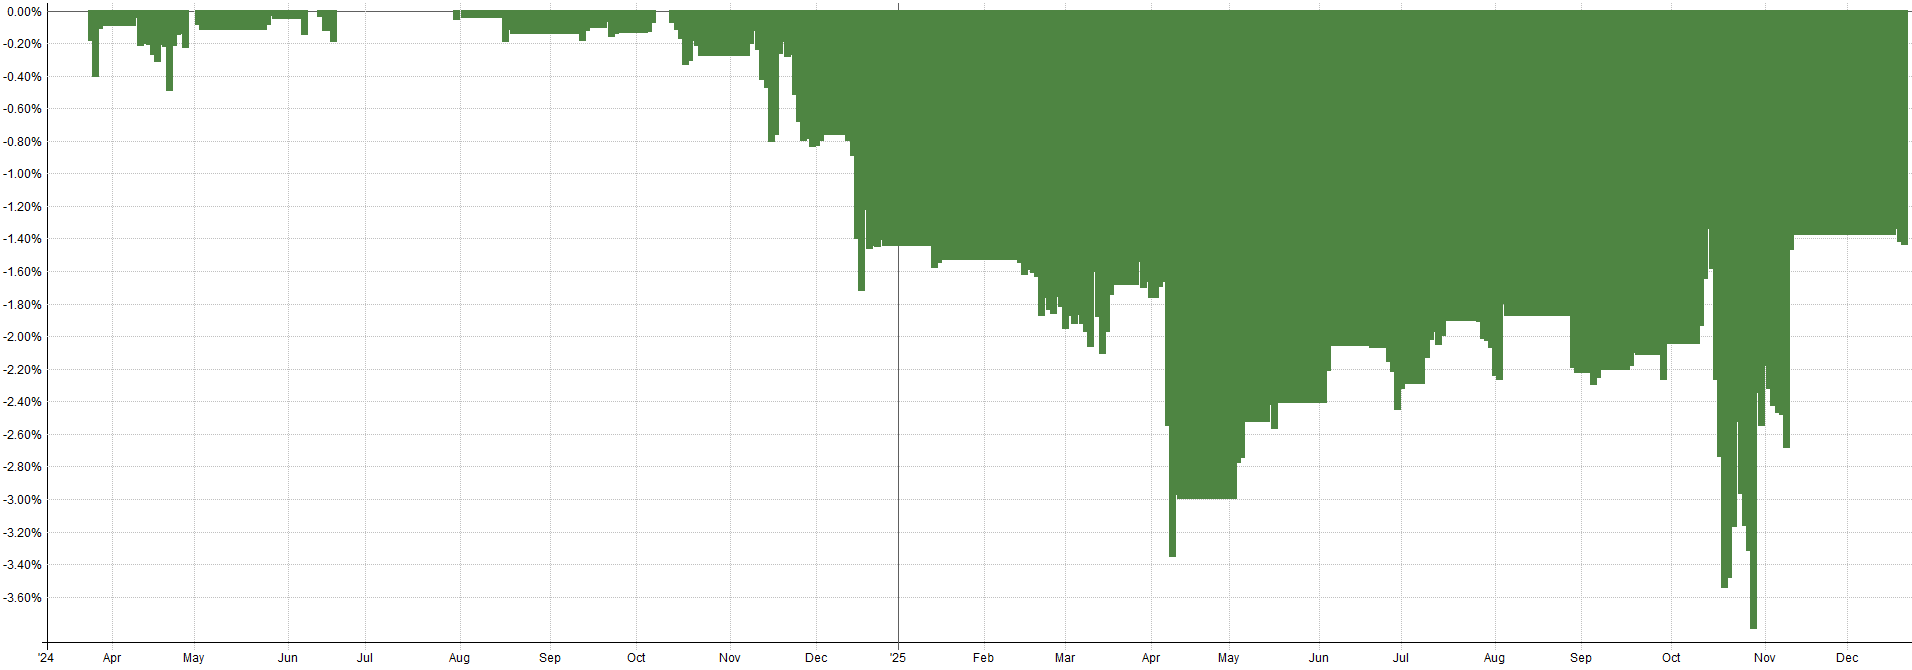
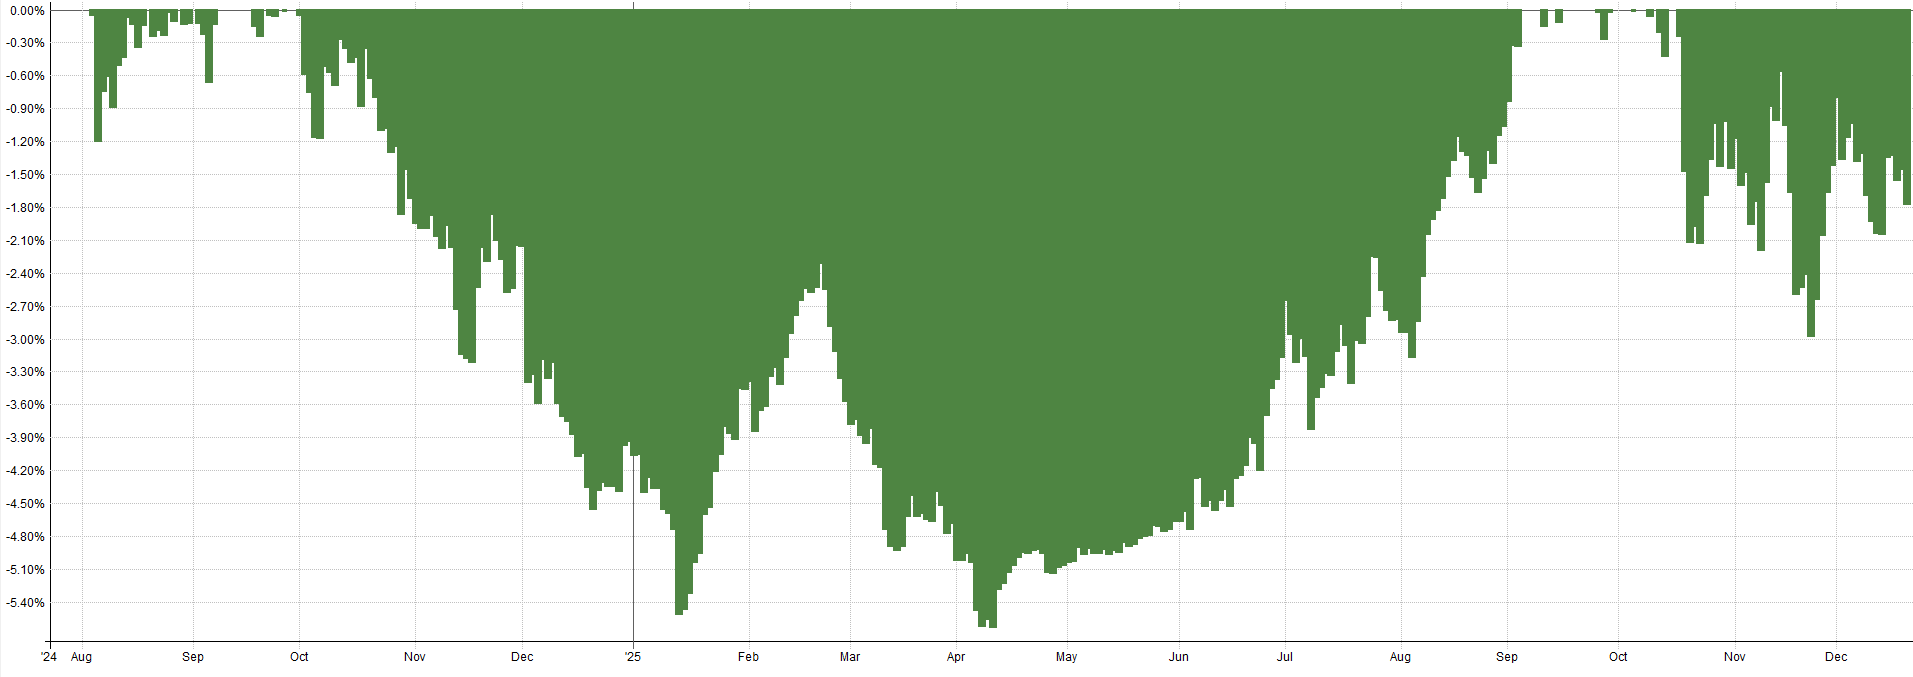
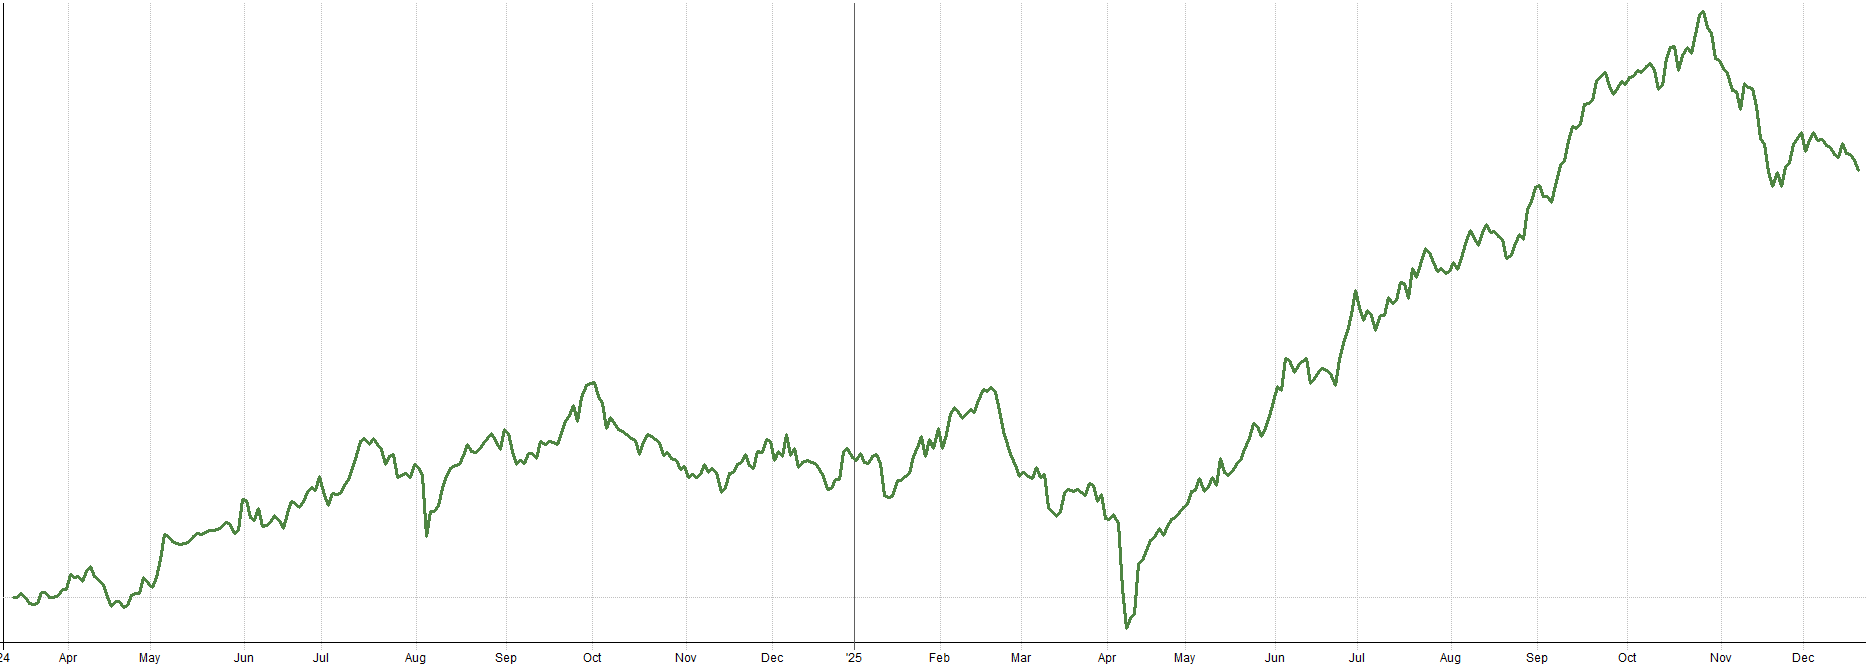
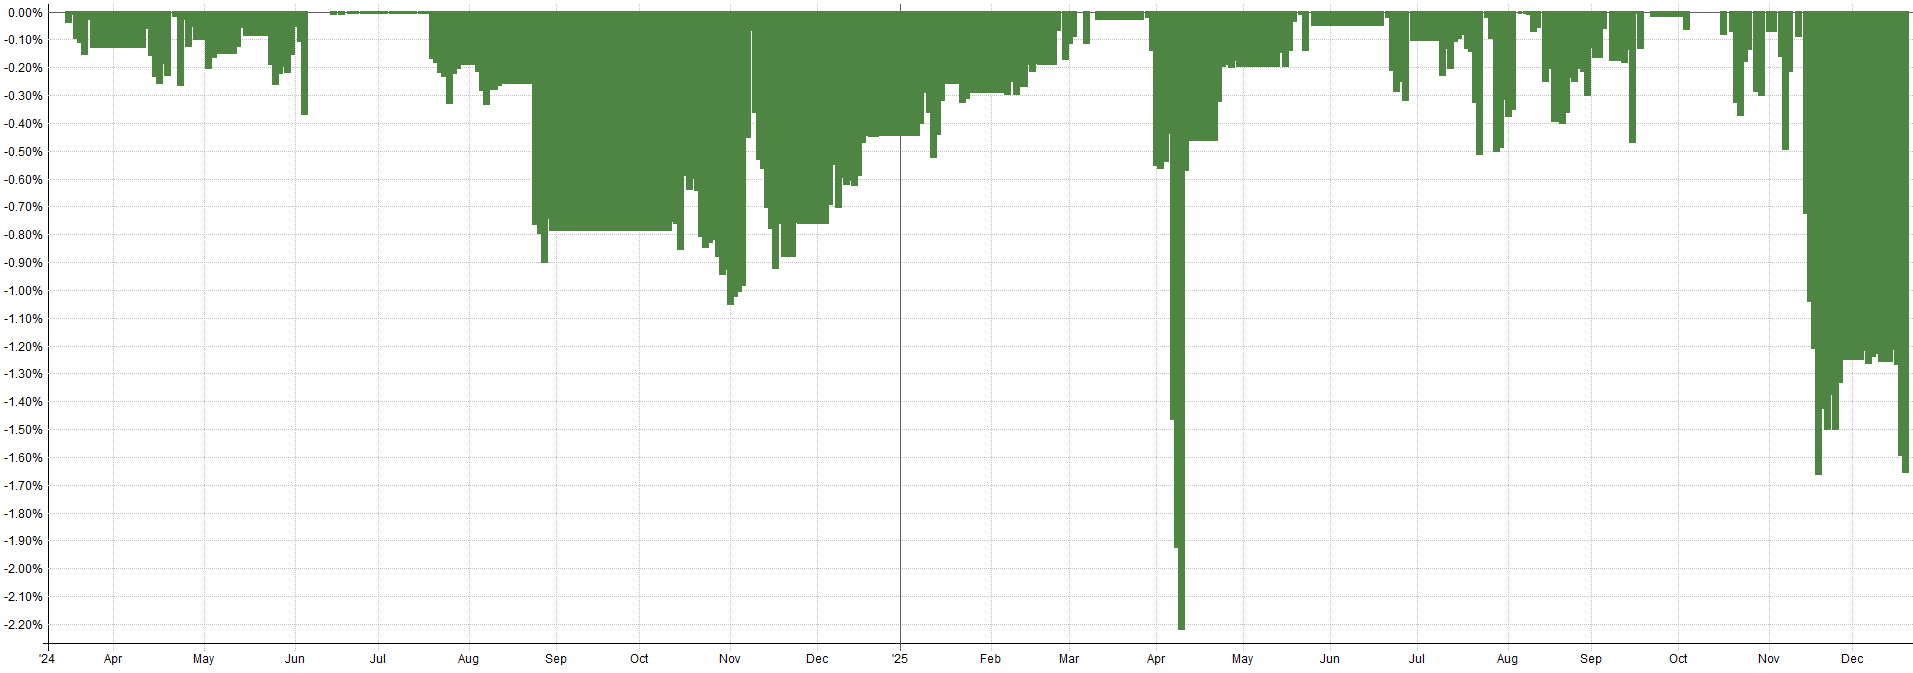
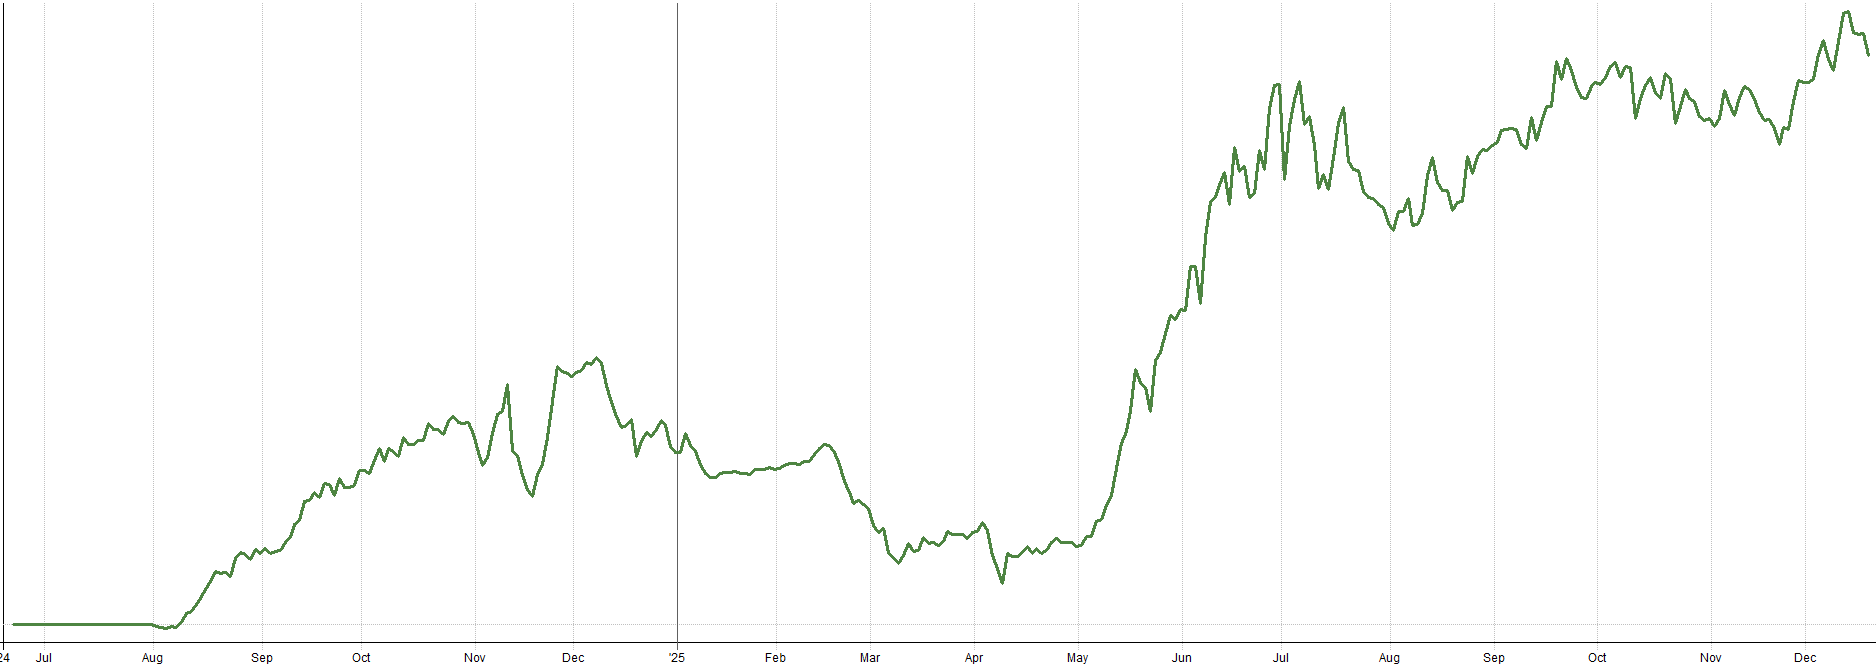
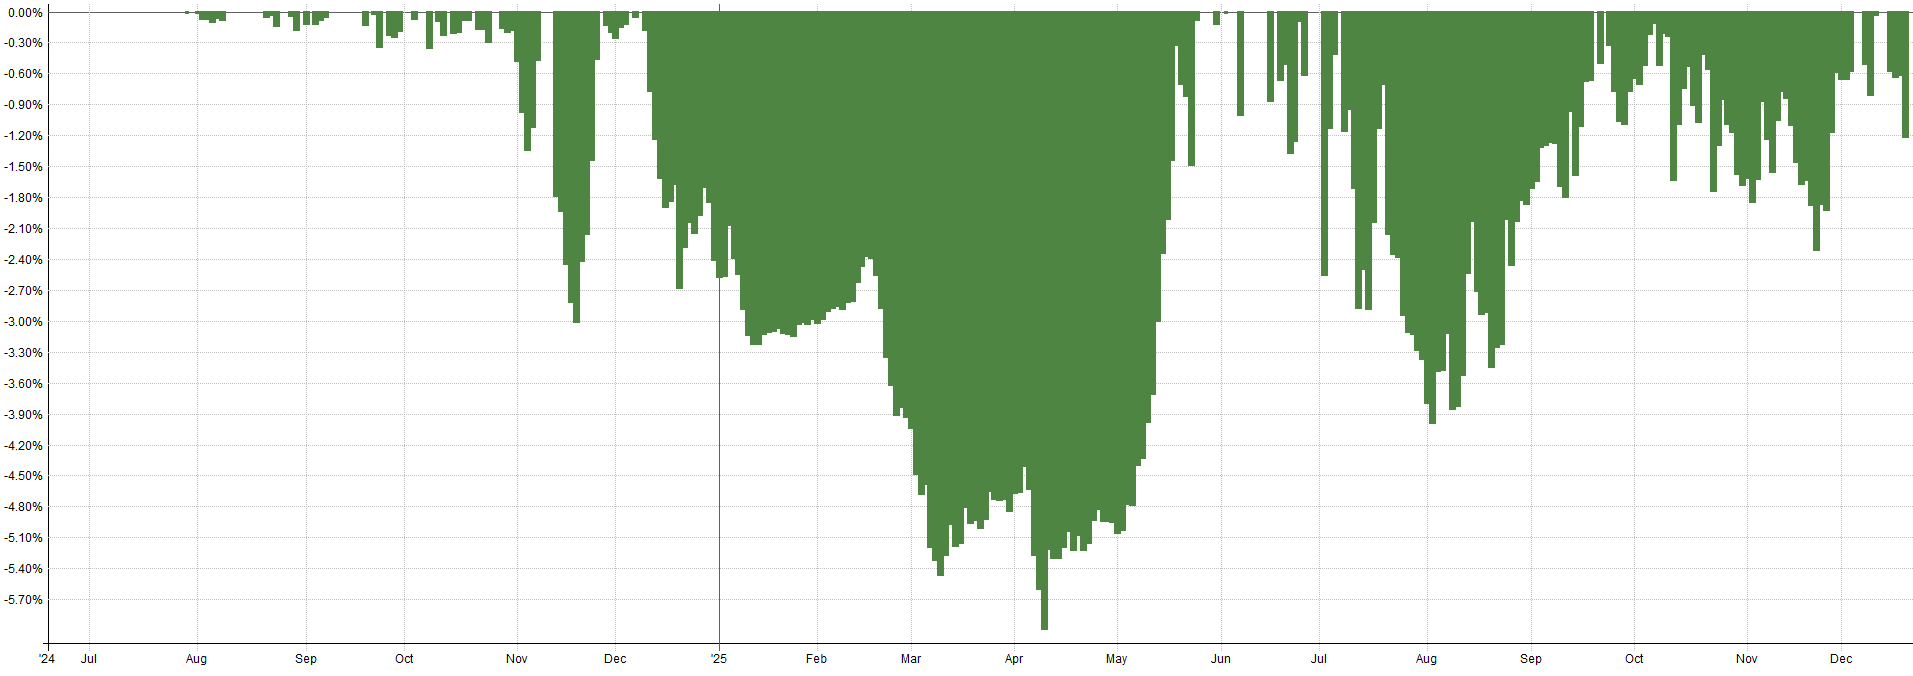
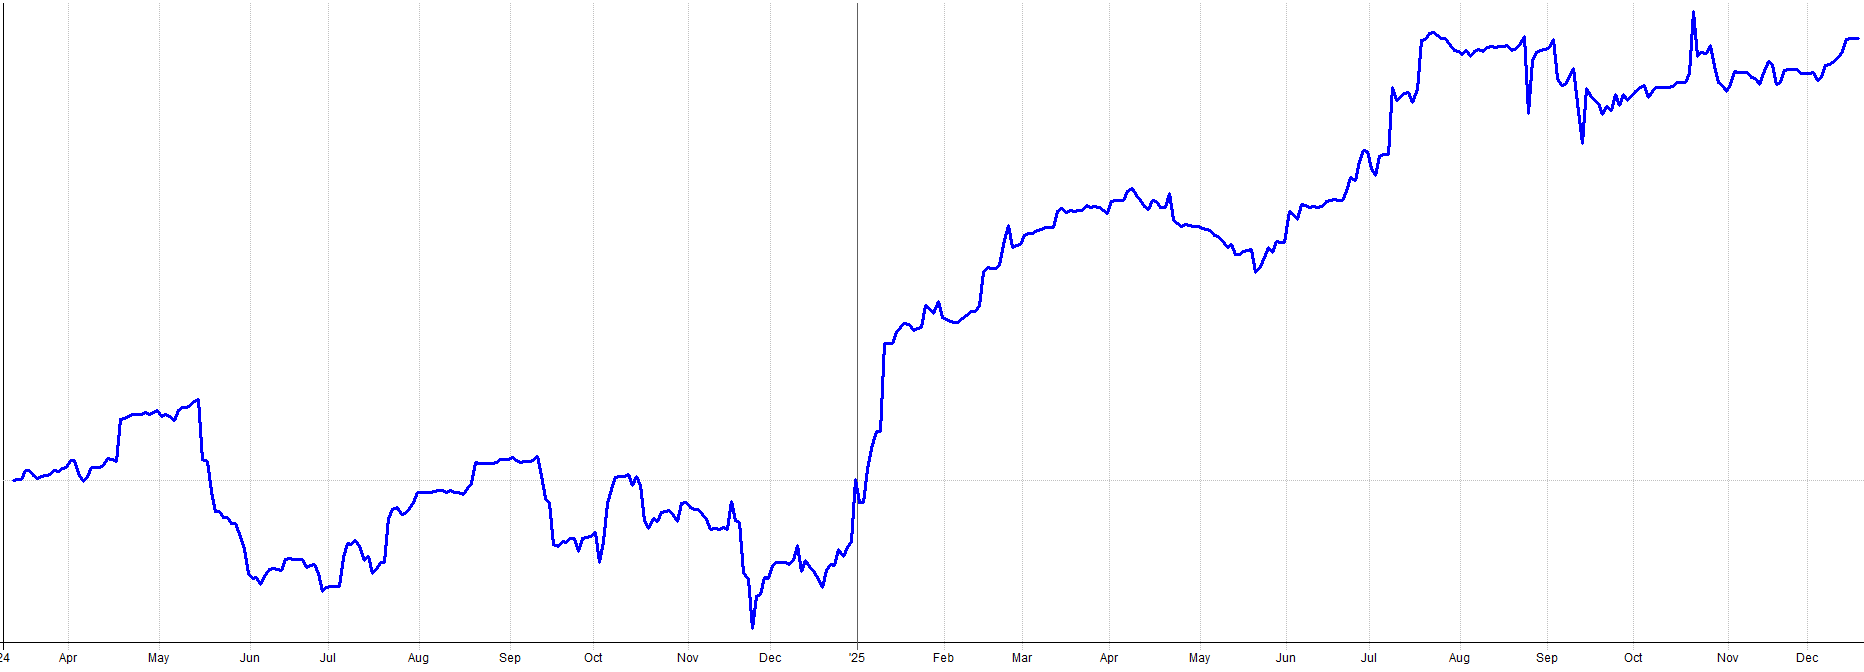
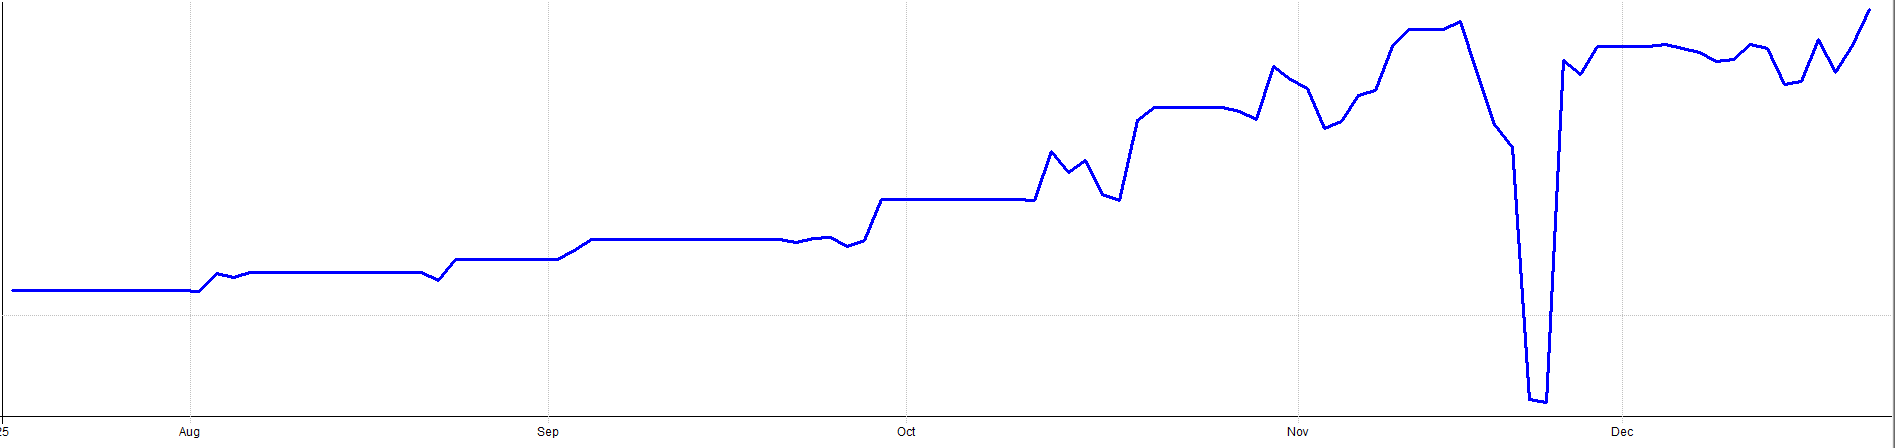
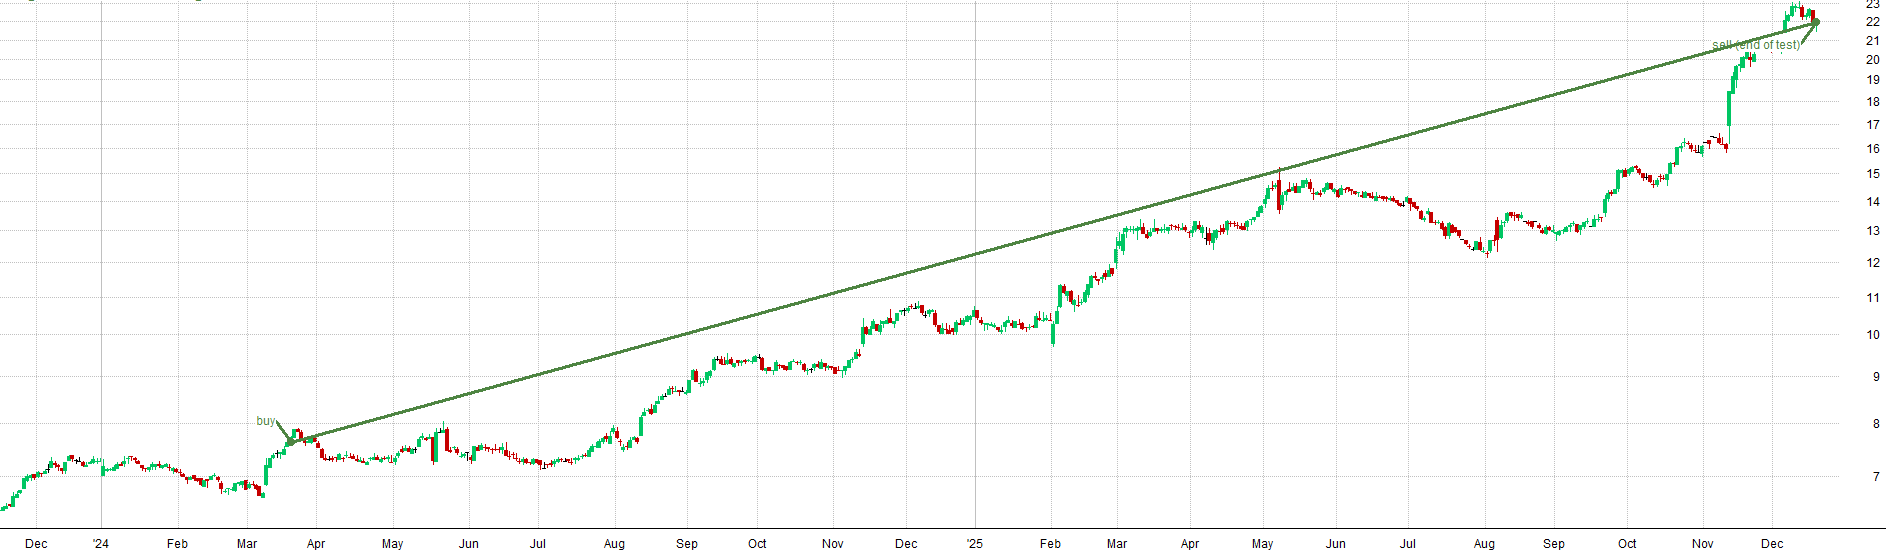
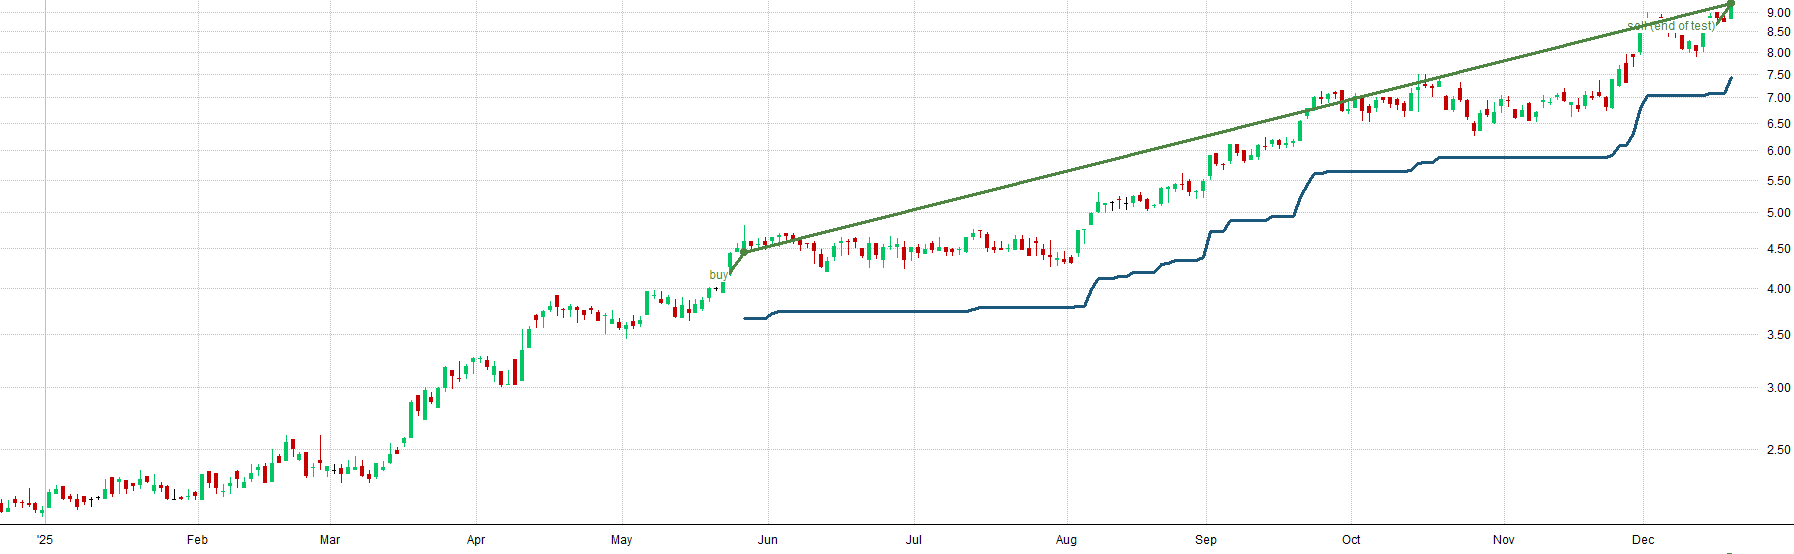
I launched this system live in May 2025, so it’s only had about seven months of out-of-sample live performance. For a system with such long holding periods, seven months isn’t much and is not meaningfully significant yet; but here’s the live equity curve so far (this curve is constructed based on the actual trades generated by this system that I took in my trading account):
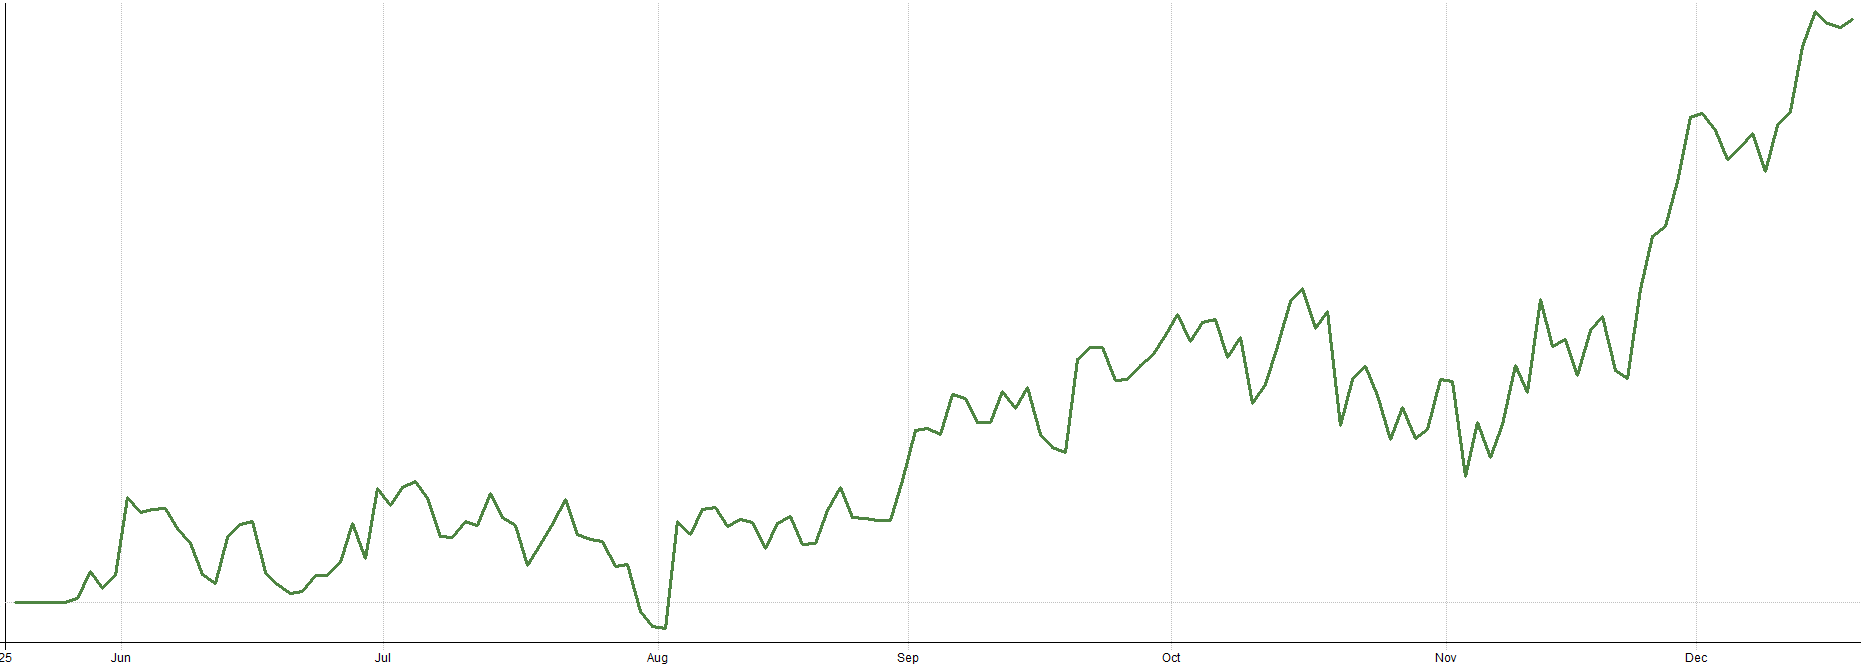
As you can see, it’s choppy but it’s headed in the right direction. As I said, seven months of live data is somewhat meaningless for this type of system; so we’ll need to check back in another year or so to get a better sense of how it’s holding up. Either way, I’m happy with the performance thus far.
System #2:
The most significant improvement to the portfolio this year was the implementation of what I call the “mean reversion mini-portfolio.” I call this “system” a “mini-portfolio” because it’s actually 6 very simple signals all stacked on top of each other.
It’s a meta system that combines 6 very simple ideas together to make one mini-portfolio. I then integrated this mean reversion mini-portfolio into my overall total portfolio allocation. The simulated impact of the mean reversion mini-portfolio on my overall portfolio performance is very promising.
Up until this point, I only had a handful of mean reversion systems. The vast majority of my portfolio allocation was towards long term trend and momentum systems. Thus, adding this mean reversion mini-portfolio provides a complementary trading style to the longer term systems which should have a massive positive impact on the overall portfolio.
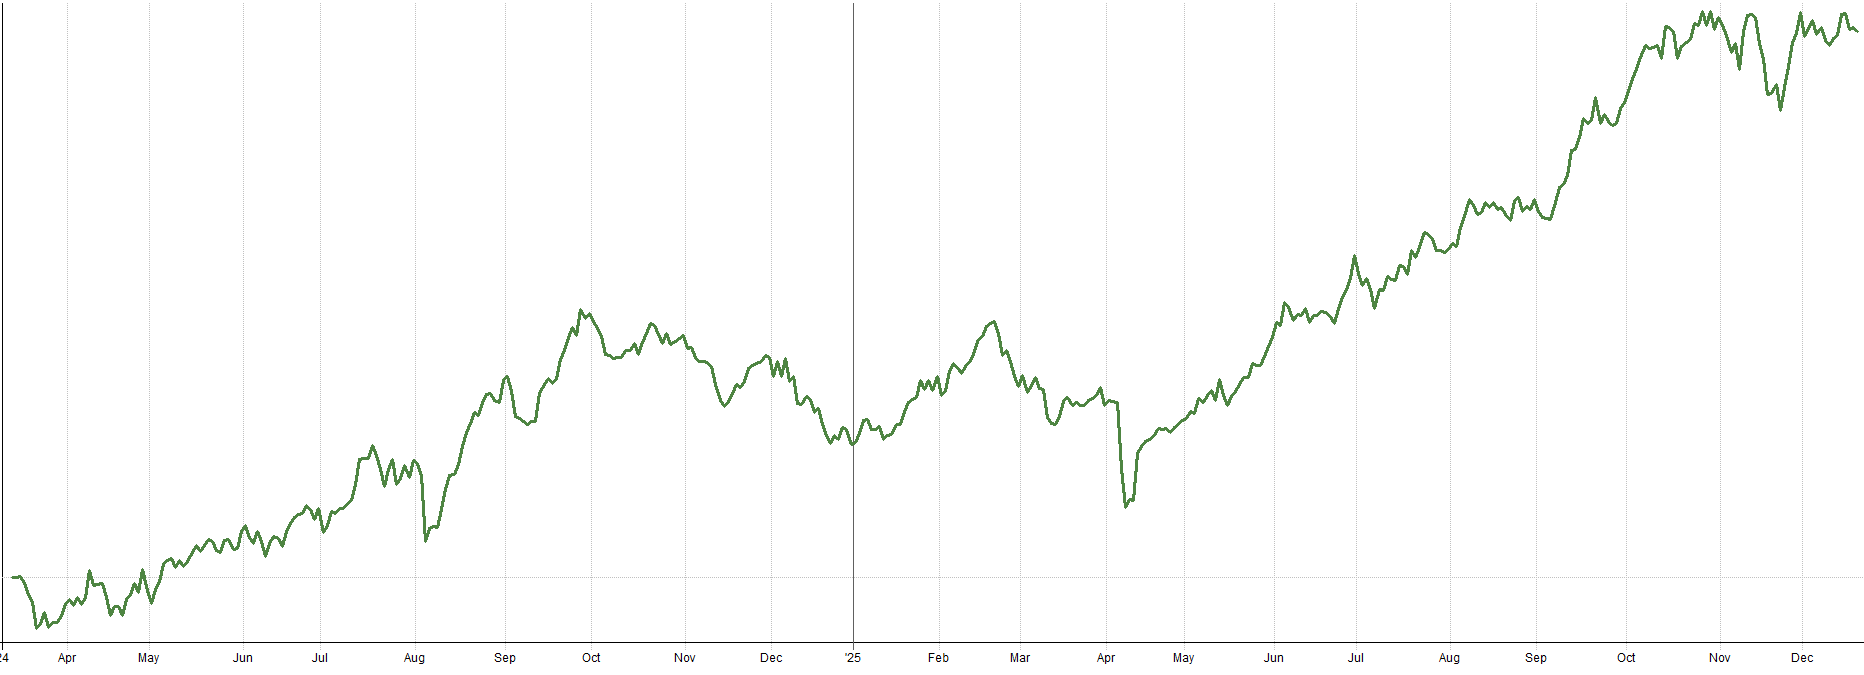
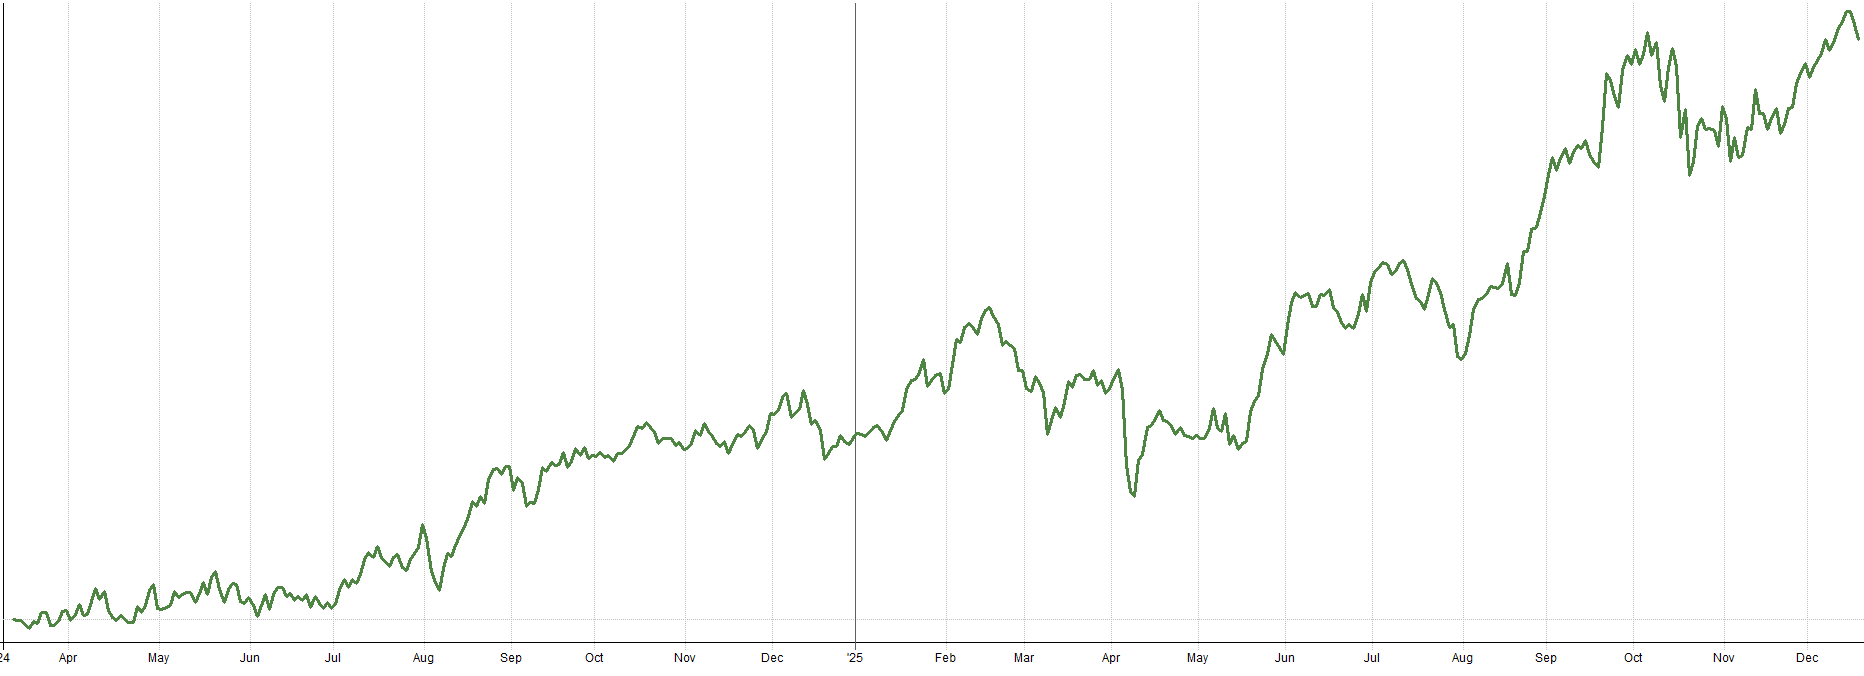
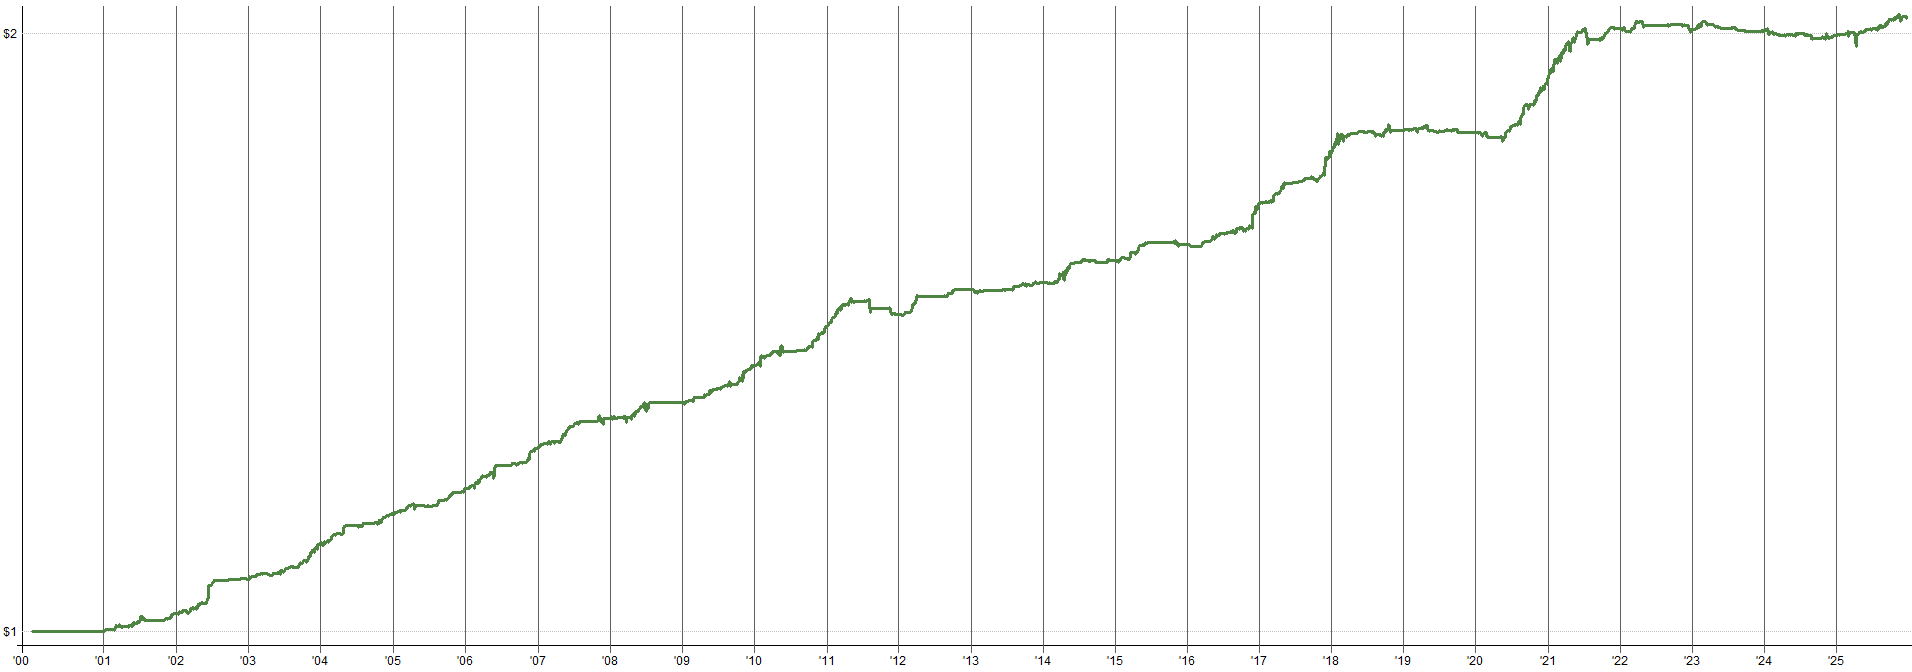
Here’s the backtested performance of the mean reversion mini-portfolio over the past 15 years (the pink line is the S&P 500 and the blue line is the mean reversion portfolio):
Market: USA
Type: Mean Reversion
Side: Long
Timeframe: Daily
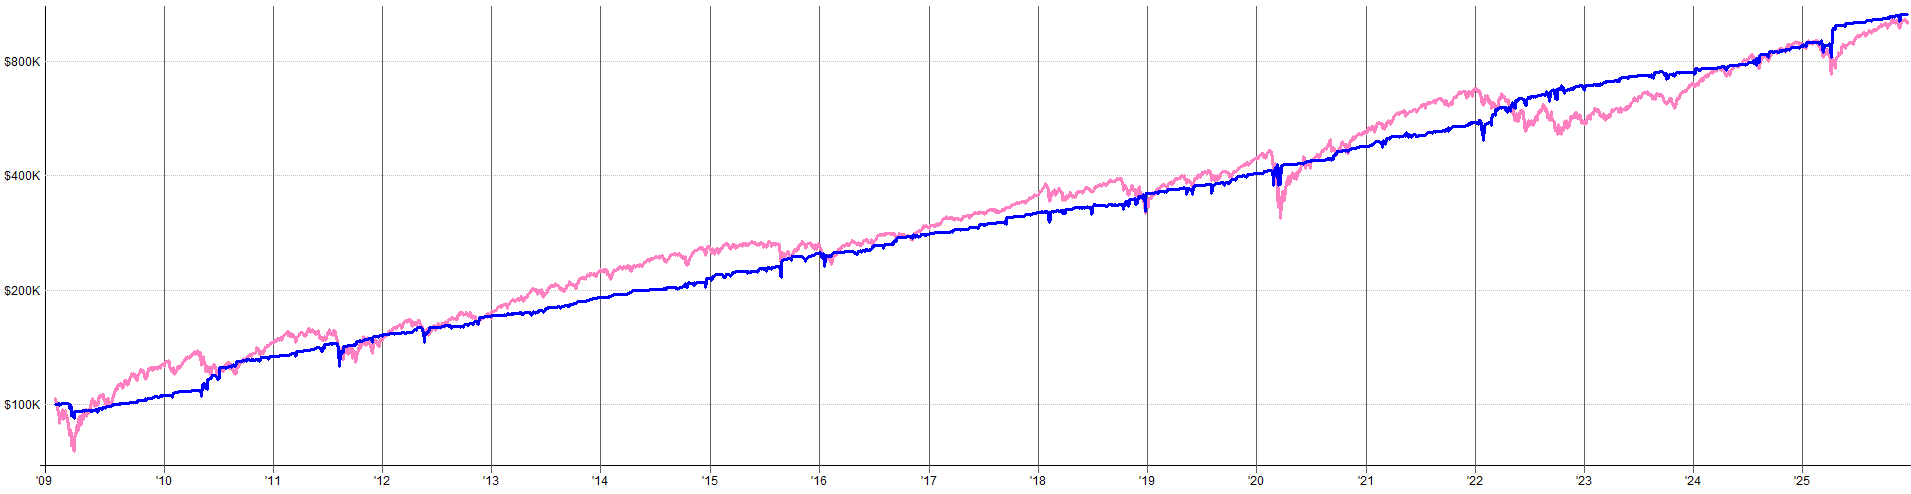

That’s a pretty nice-looking equity curve, if I do say so myself. Not too bad for simply stacking 6 simple signals together. I’m very excited about it and happy to have it running live (and so far the live performance matches very well with the simulated performance).
I’ve historically been hesitant about mean reversion systems. Many mean reversion ideas I’ve stumbled across have felt fragile. In my experience, mean reversion is extremely easy to overfit. Most mean reversion systems I’ve found online are overfit as well.
Hence, I took a step back, found 6 super simple mean reversion features/measurements that work very well, have very few parameters, are stupidly simple, and stacked them all together.
Most mean reversion systems combine rules on top of rules to curve fit a fantastic result. This system works differently. Each mildly predictive feature (rule) of the system operates independently of the others.
I’m not curve fitting to find the perfect combination of rules with the perfect parameters to get this result. I’m trading many singular rules individually (with a broad parameter space that works), and the combined result is much more robust and interesting for me to allocate capital to.
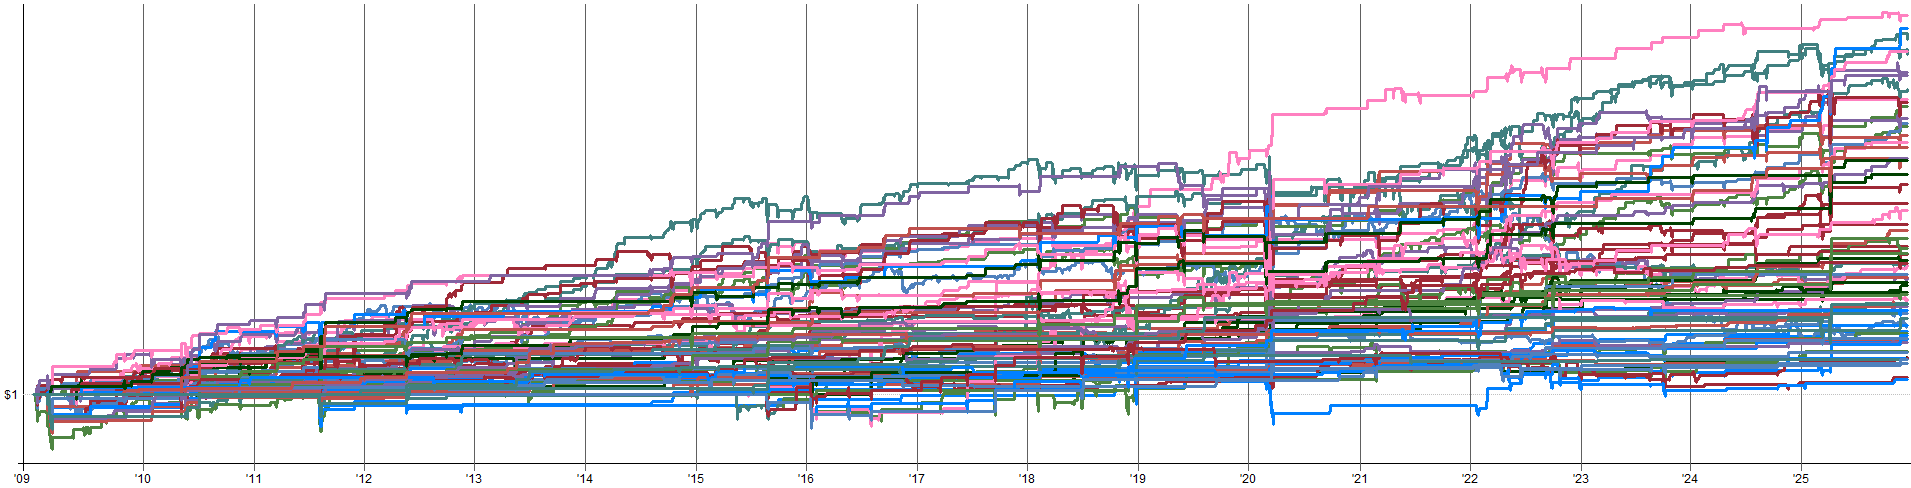
See the plot below to see a breakdown of the many equity curves that make up this mean reversion mini-portfolio. Each line represents one feature (rule) applied to one of the tradable instruments.
You’ll notice some of these equity curves look great, some look okay, and some are flat or actually lose money over the long term. I don’t care, I trade them all. When you stack all of these simple results together, the result is very interesting, at least to me.
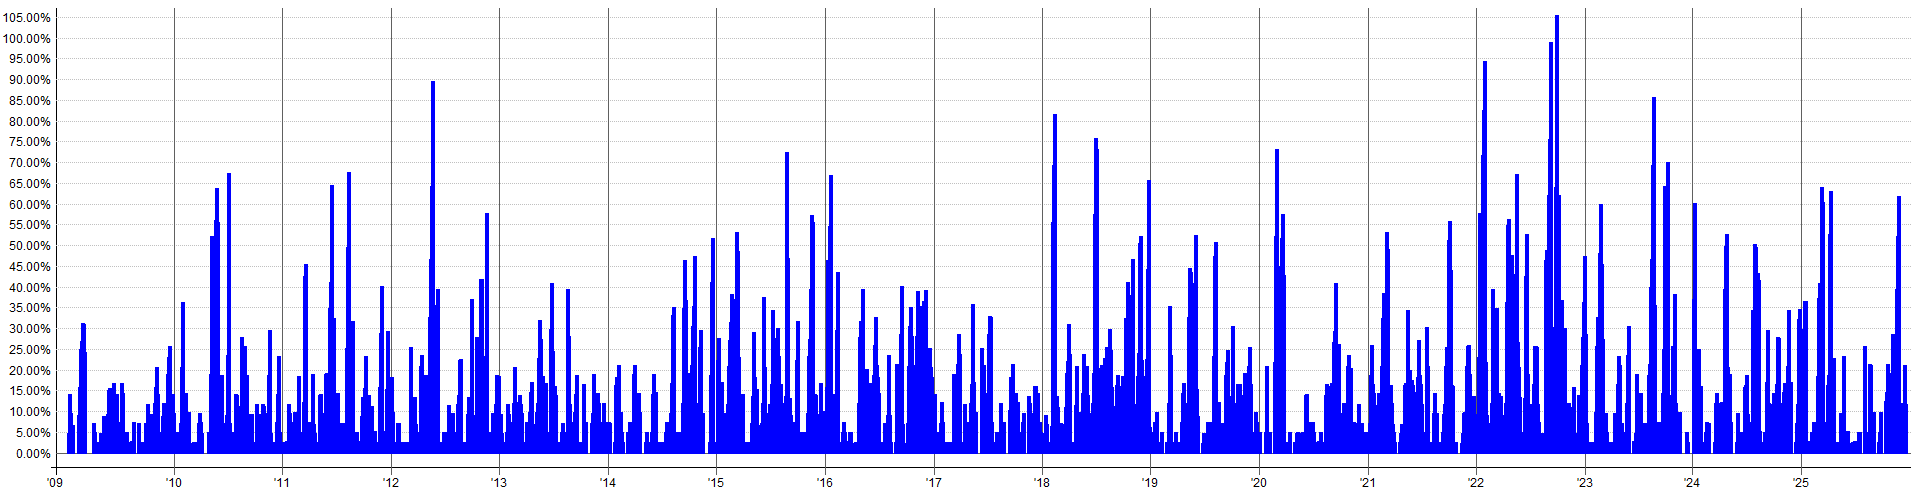
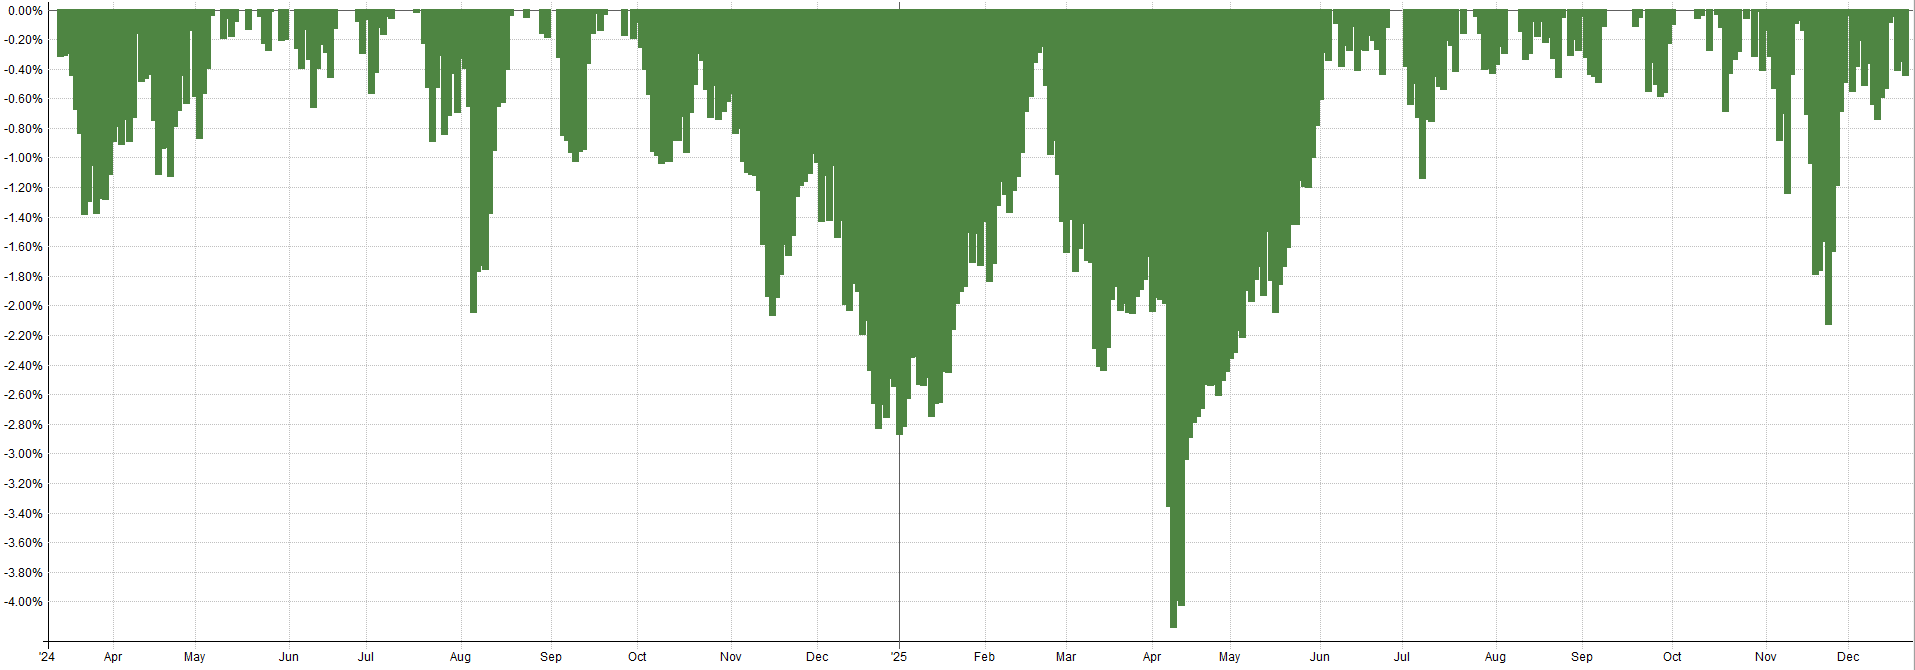
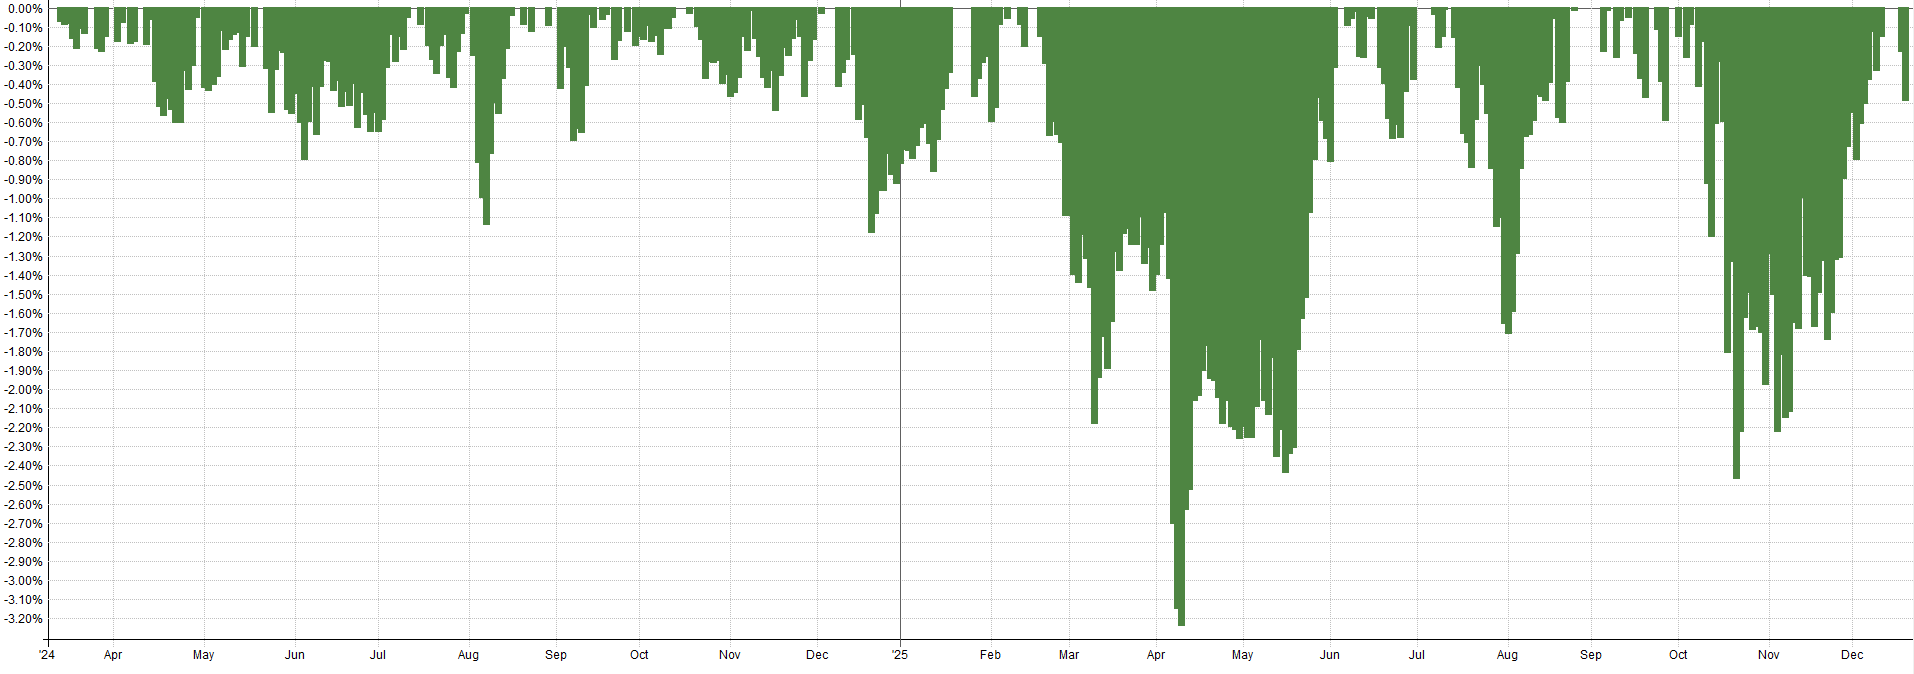
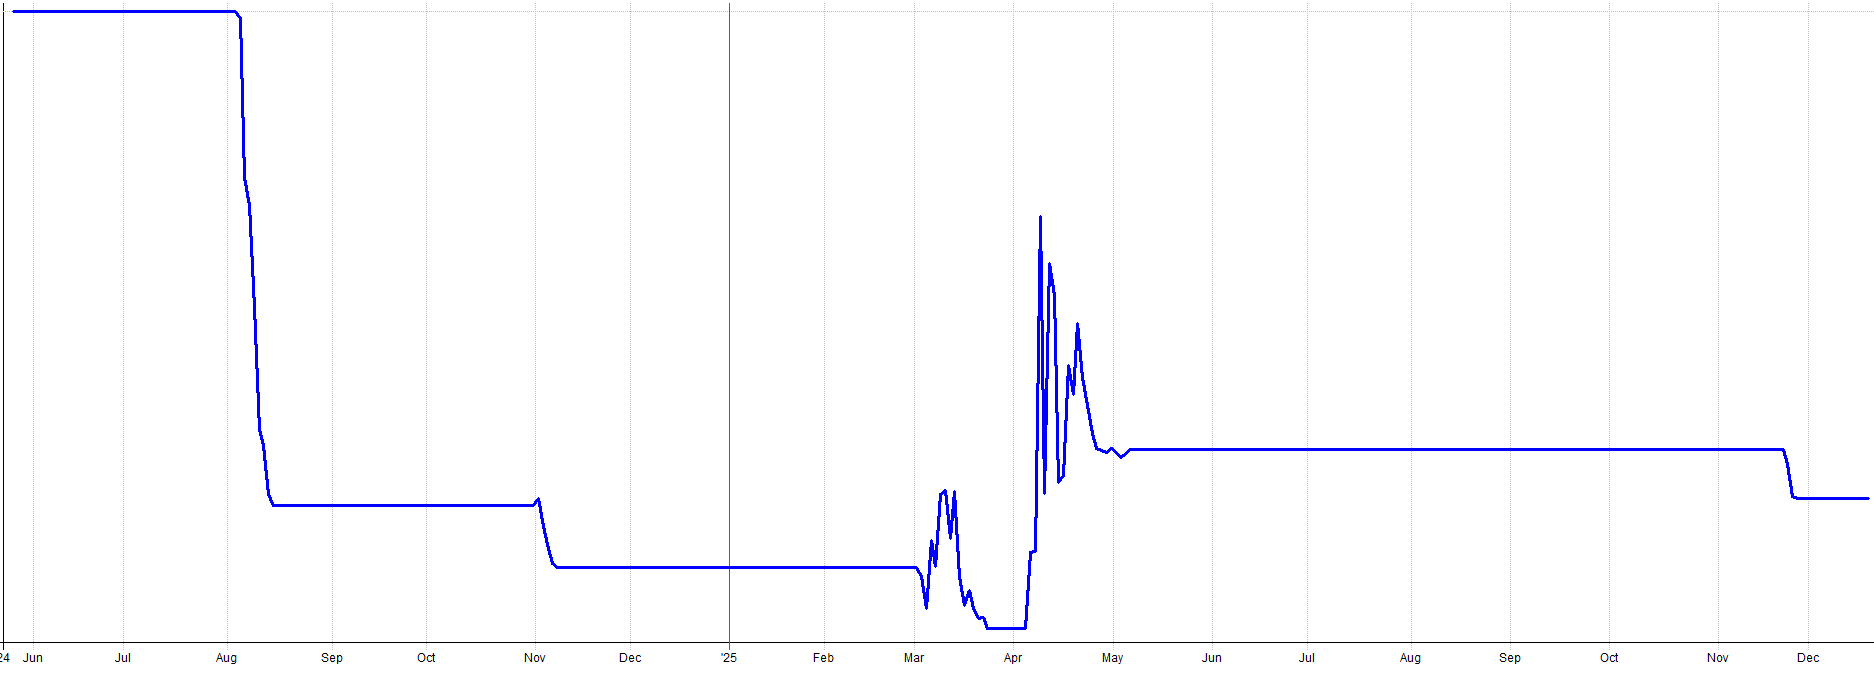
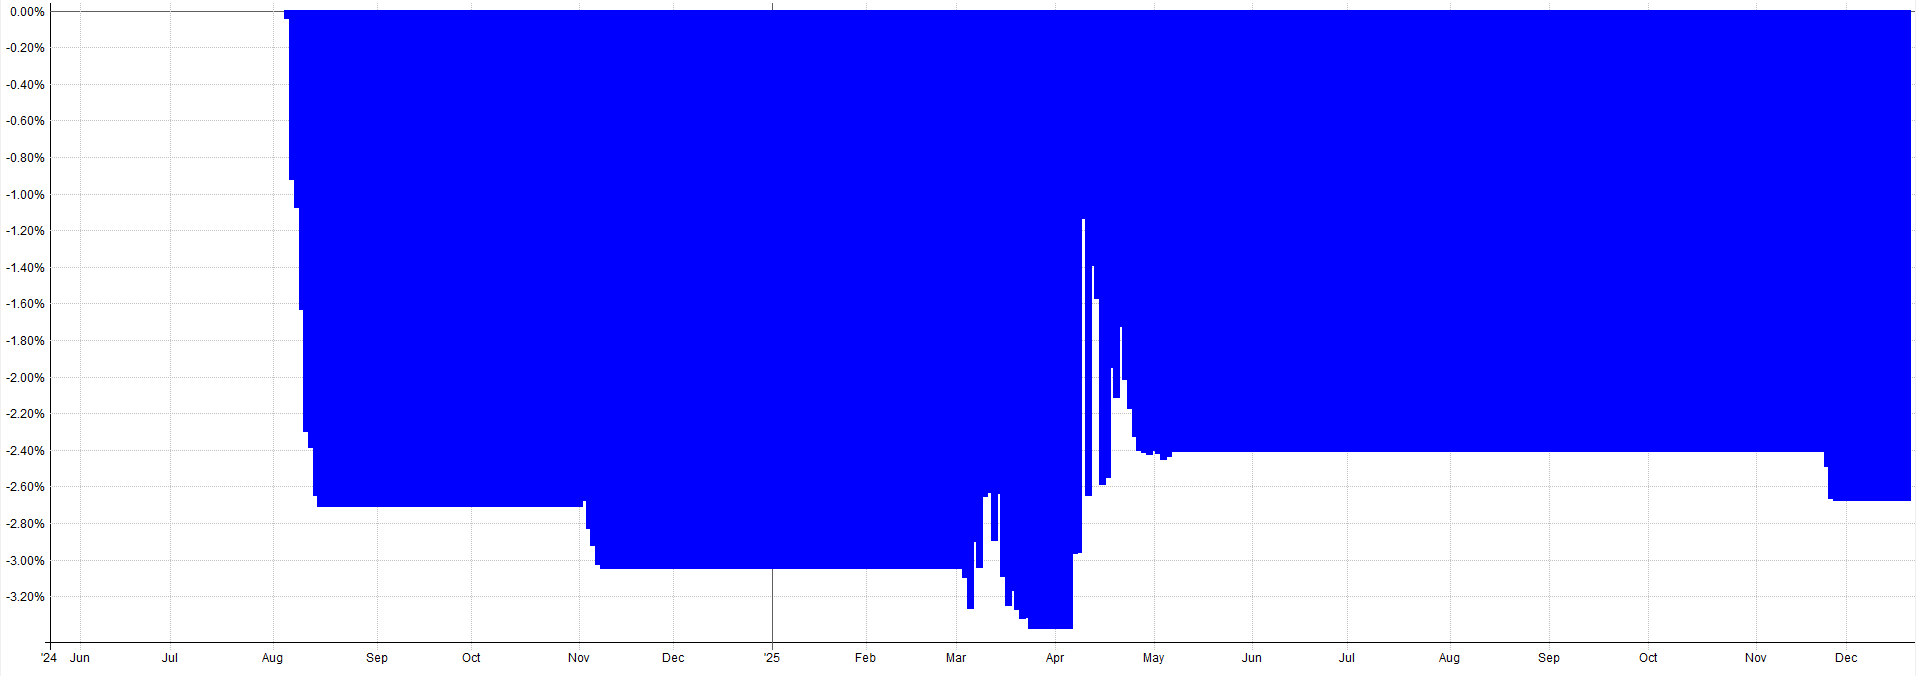
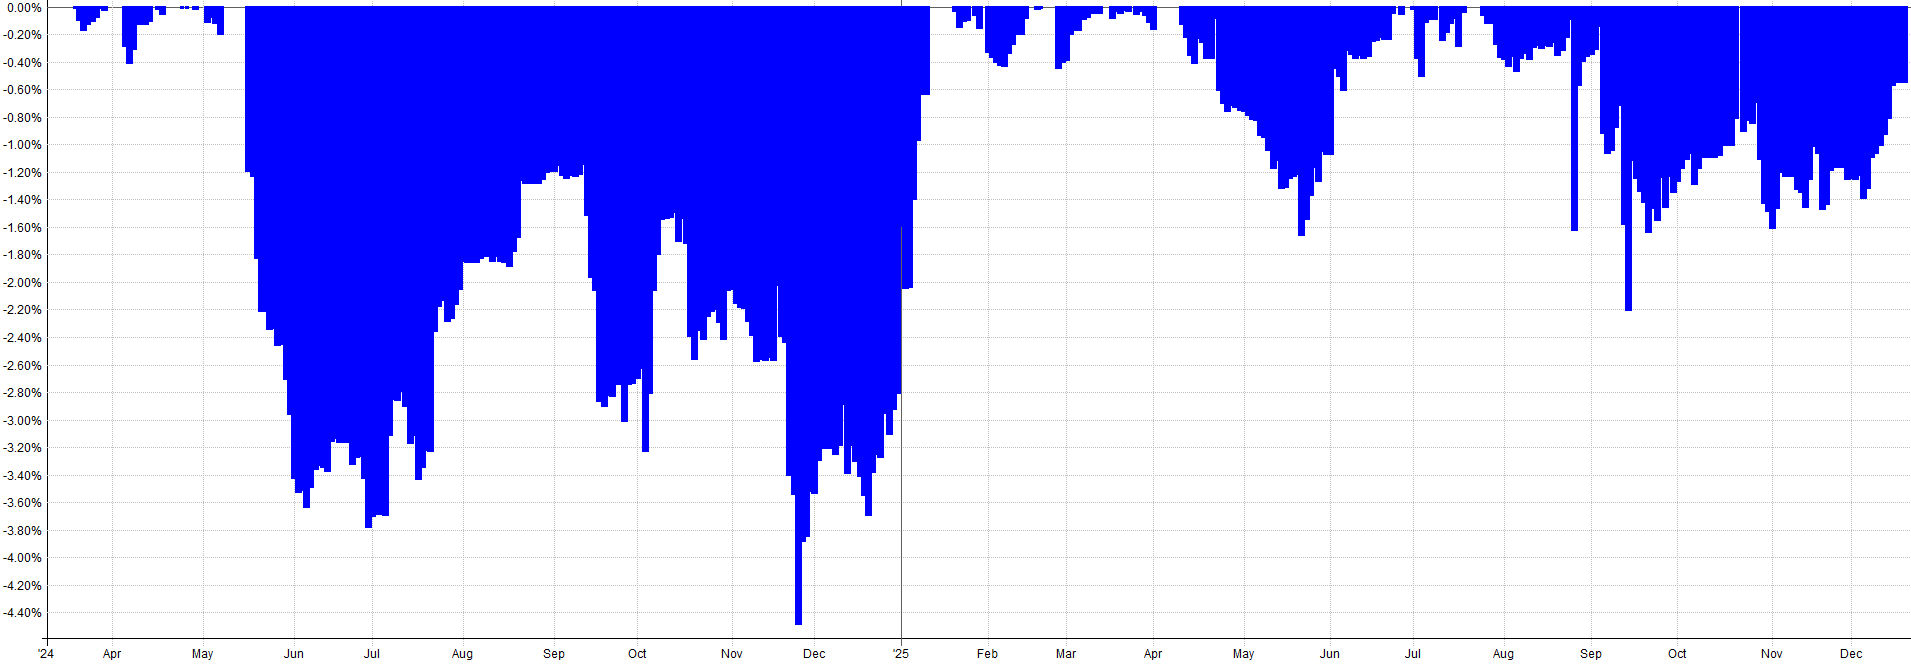
One thing that’s cool about mean reversion is it generally uses very minimal capital. Occasionally capital exposure spikes to 100%, which you have to be careful about in terms of total portfolio level allocation, but the vast majority of the time the mean reversion portfolio is sitting around 15% to 40% exposure. Thus, the returns are pretty interesting given the efficiency of the capital usage. See the exposure plot over time below:
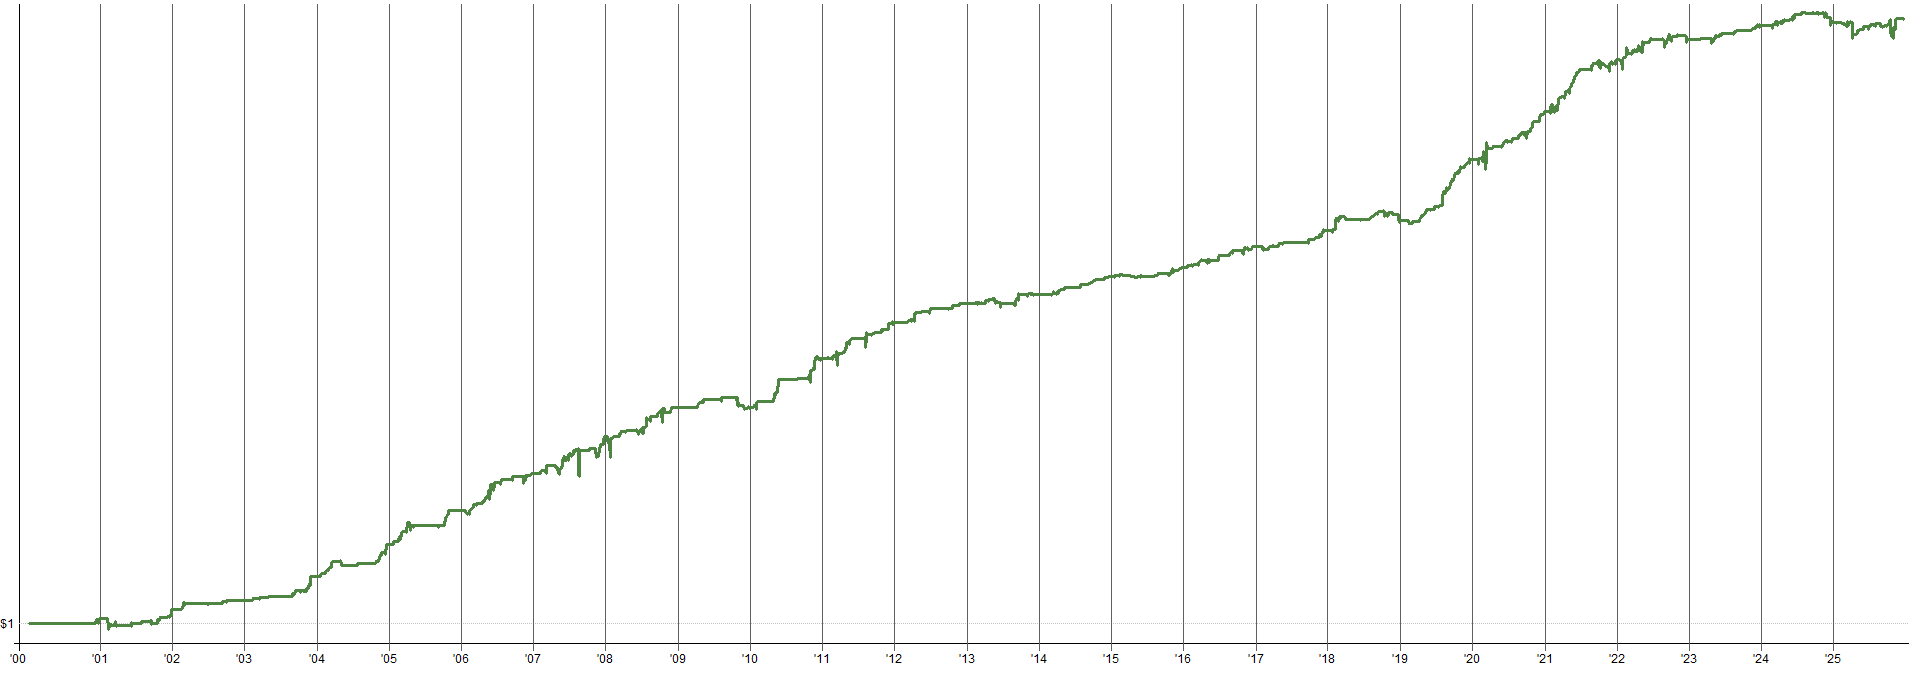
Oh, and for anyone concerned about the backtest only going back to 2009 (that’s generally when the traded instruments became available, which are leveraged ETFs), I ran the mean reversion portfolio on non-leveraged ETFs back to 2000. Obviously the returns would be less, but the stability of the equity curve is what’s more important here.
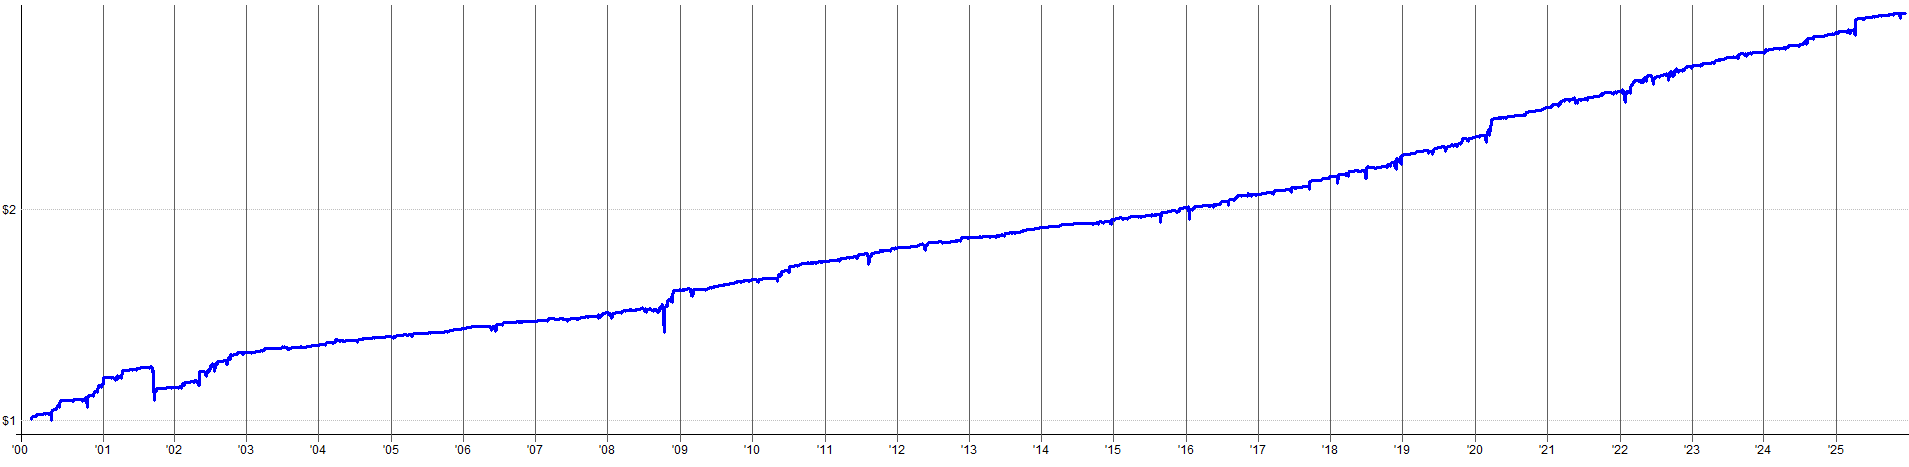
The mean reversion mini-portfolio still holds up great. There’s a few bumps and bruises like in 2001 and some volatility in 2008, but overall not too bad.
It’s also worth noting, no data pre-2009 was used in the development of this system, so that’s pure out-of-sample.
Also, 2018 onwards was used for out-of-sample testing as well. So, 2009 to 2018 was the development/fitting period and everything else was completely unseen. Not too shabby if I do say so myself.
System By System Live Performance (Since Inception):
Thus far, I’ve shown the backtested performance of the entire portfolio, the live performance in my Interactive Brokers account, and the two new systems I added to the portfolio in 2025. This section will show my system-by-system live performance. These plots will show how each system has performed individually.
The ROR (rate of return, same as CAGR) and Max Drawdown metrics shown below won’t really make sense because they are being calculated based on the entire account size; when in reality each of these systems is only allocated a small fraction of the full account size.
So, for example, if the full trading account was $100,000 and a system stated a live ROR of 5%, but the system was only allocated 20% of the account, then the true live ROR of the system would be closer to 25% (assuming the system traded the whole account). Basically, the ROR and Max Drawdown stats are scaled down by the system allocation percentage.
I figured it was worth pointing that out so you weren't completely confused by what some of these numbers mean. I don’t explicitly label it, but most systems are somewhere in the mid-teens in terms of percentage portfolio allocation.
It’s also worth noting, some of these systems I have been trading for a little over a year before the plots shown below display. I was using a different backtesting and order management system back then which did not allow me to display the plots I will be showing in this article. Since I switched over to my current infrastructure in early 2024, I have much better records and more ways to process and display data.
It’s also worth pointing out some of the systems listed below are “meta-systems”. Meaning, the system is made up of multiple mini-systems that all work together to make the final system (similar to how the mean reversion mini-portfolio works). So if you were to count all of the systems I have including every mini system within a meta-system, I would have over 30 systems in total. But, if you count the meta-systems as just one system, then I have only 13 systems total.
The meta-systems are shown below in blue (only the aggregated result of the meta-systems are shown, rather than the result of each small component of the meta-system), and the singular systems are shown in green (these systems are not made of many smaller simpler systems).
Below I will show tracked system-by-system live performance as seen by my trading account since March 2024 (except for the couple new systems, which started at a later date).
Alright, that’s enough of me being confusing and stating caveats, here is the system-by-system live performance.
Market: ASX
Type: Mean Reversion
Side: Long
Timeframe: Daily

Market: ASX
Type: Trend Following
Side: Long
Timeframe: Daily

Market: ASX
Type: Momentum
Side: Long
Timeframe: Monthly

Market: ASX
Type: Trend Following
Side: Long
Timeframe: Weekly

Market: TSX
Type: Mean Reversion
Side: Long
Timeframe: Daily

Market: TSX
Type: Trend Following
Side: Long
Timeframe: Daily

Market: TSX
Type: Trend Following
Side: Long
Timeframe: Weekly

Market: USA
Type: Trend Following
Side: Long
Timeframe: Daily

Market: USA
Type: Trend Following / Hedging
Side: Long (Long Volatility)
Timeframe: Daily

Market: USA
Type: Trend Following
Side: Short
Timeframe: Daily
System has never turned on… maybe one day.

Market: USA
Type: Mean Reversion
Side: Short
Timeframe: Daily

Market: USA
Type: Momentum
Side: Long
Timeframe: Monthly

Market: USA
Type: Mean Reversion
Side: Long
Timeframe: Daily

2025 Biggest Winners and Losers (on a percent basis):
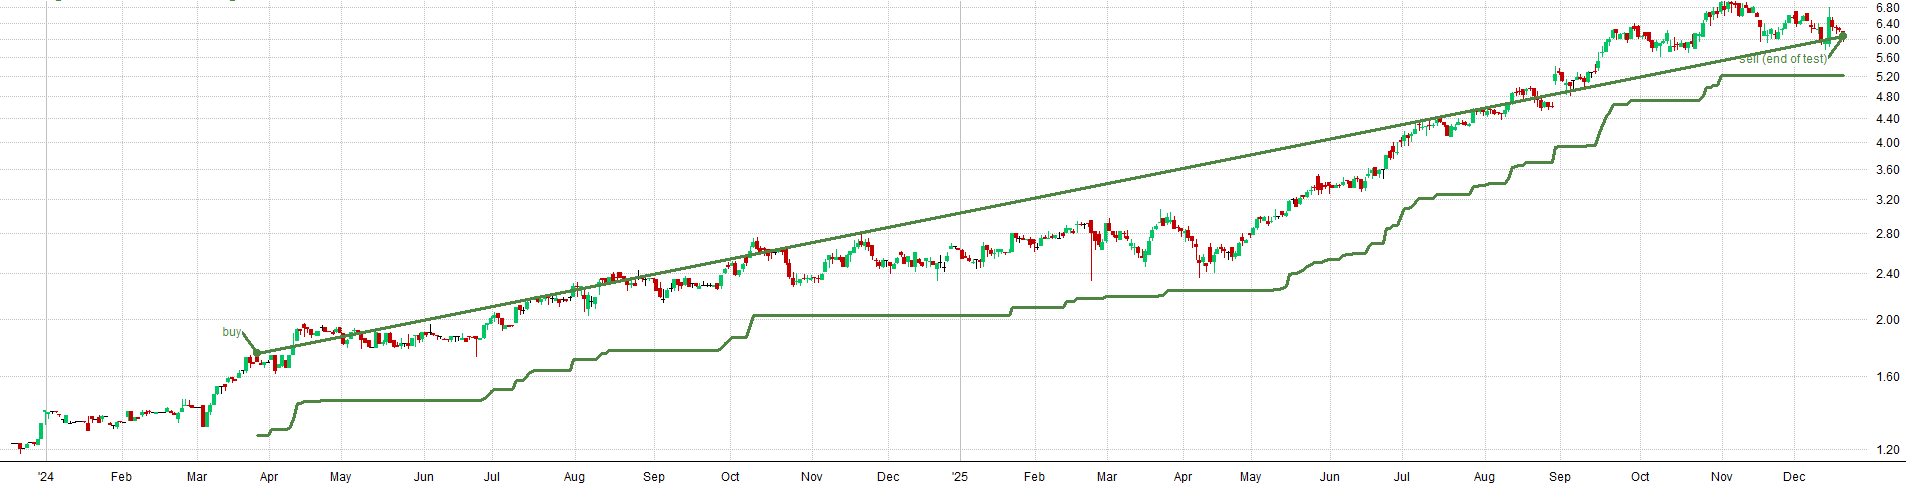
For fun, here are some of my biggest winning and losing trades of the year. I’ve had several big winners that I held for most of the year (and even for part of 2024) as they slowly climbed higher.
I’ve also had some big losers, especially on the short side, but generally speaking big losers have been infrequent. Most of my losers are relatively small. Even the larger losers (on a percent basis) are relatively small compared to the entire portfolio in terms of dollar value. So, I am controlling losers via a relatively tight exit and/or with relatively small position sizes.
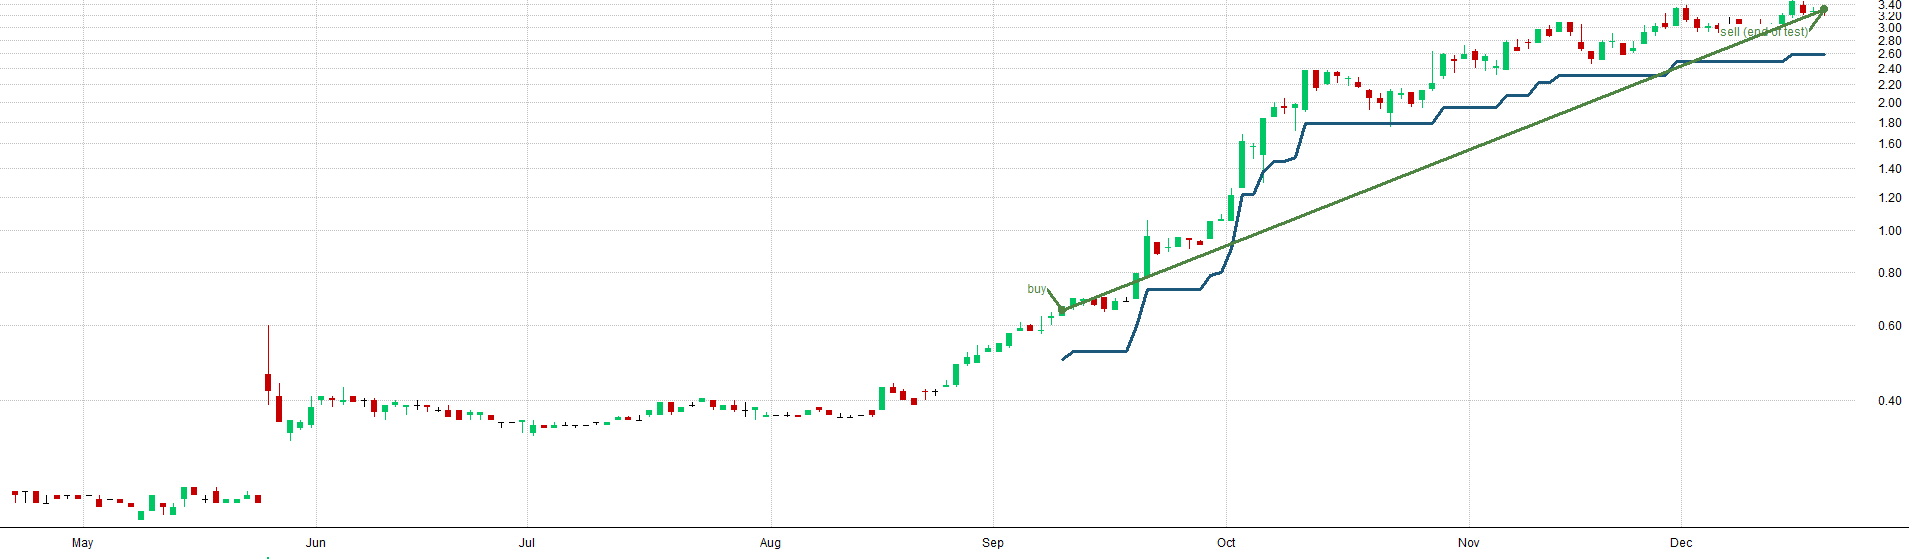
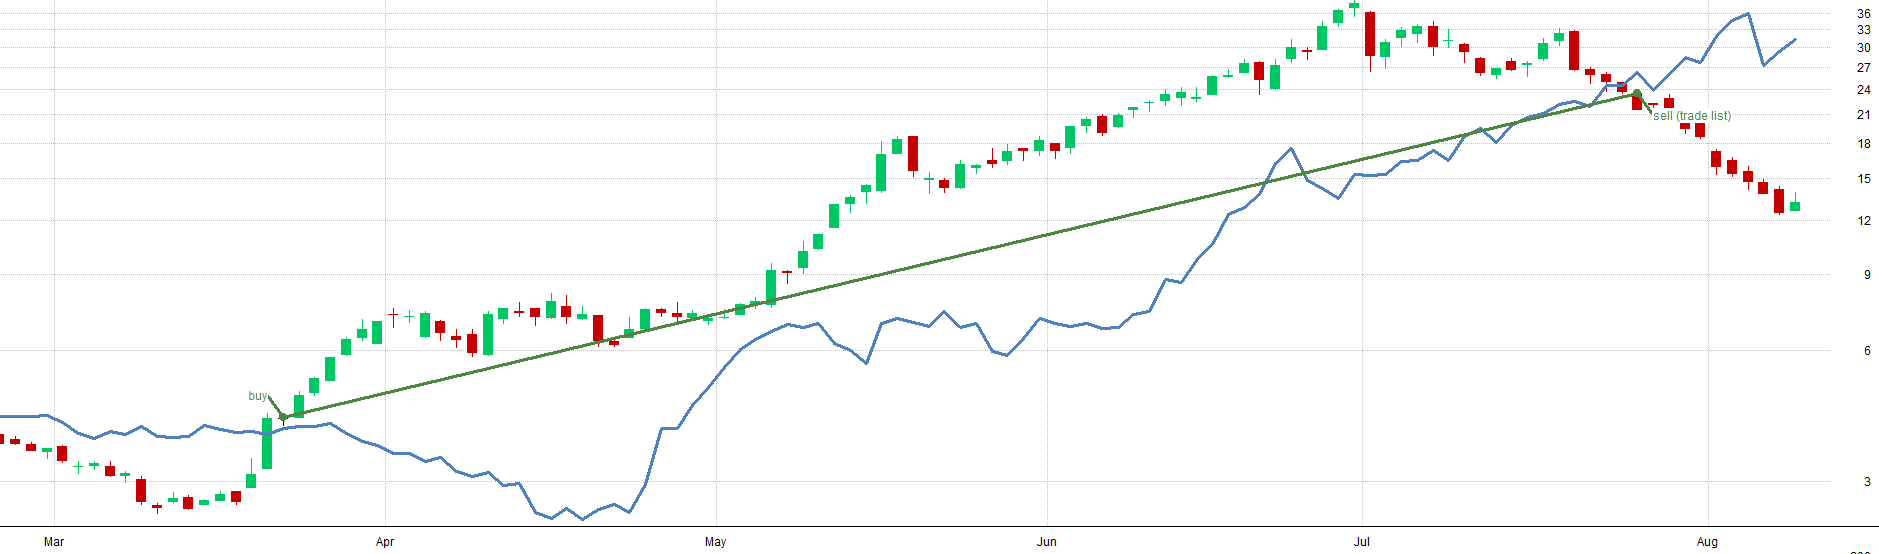
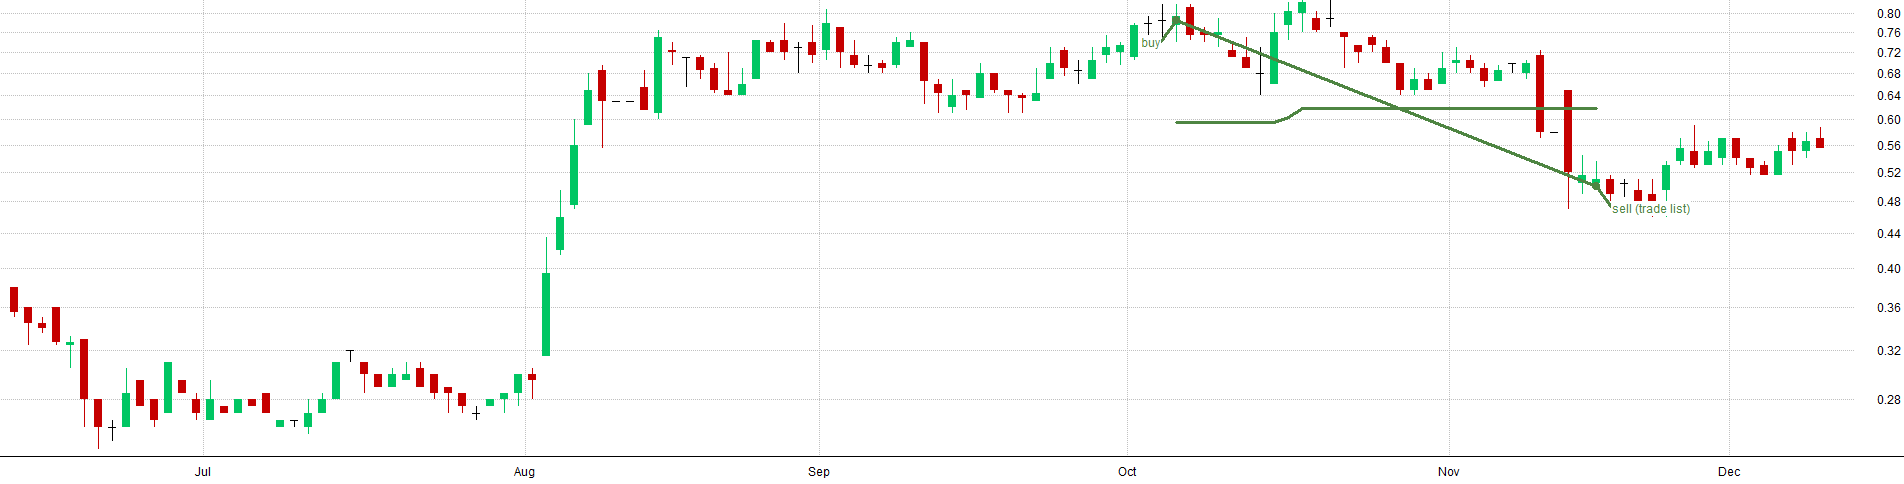
Below I show a series of screenshots of trade stats tables corresponding with a big winning or losing trade. Then right below the table I show a plot of the stock price action and the trade taken (and for some trades I have the stop loss plotted as well).
Note: These trades are both long and short, so keep that in mind in terms of direction. The plots note if the trade is a long or short trade. Also, some of these trades are mean reversion trades while others are long term momentum/trend trades, so the the definition of “big” winner or loser is relative to the system type the trade was taken from.
Biggest Winners:


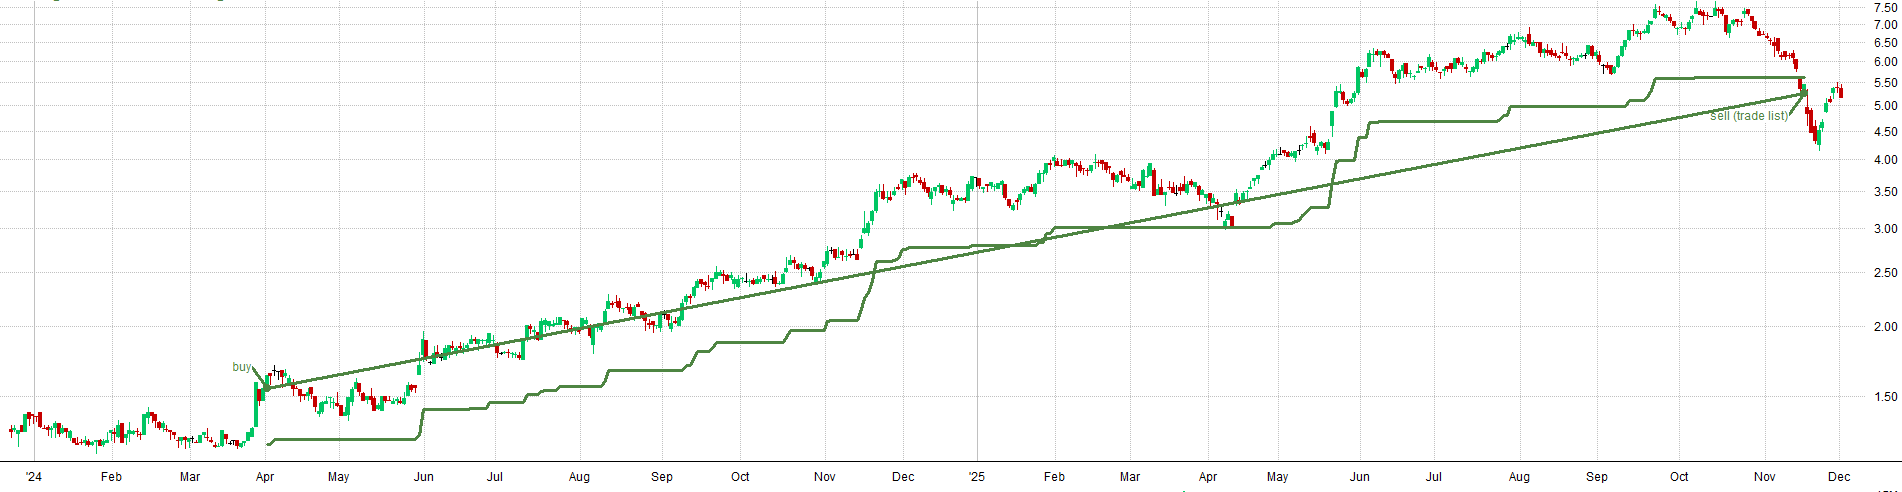

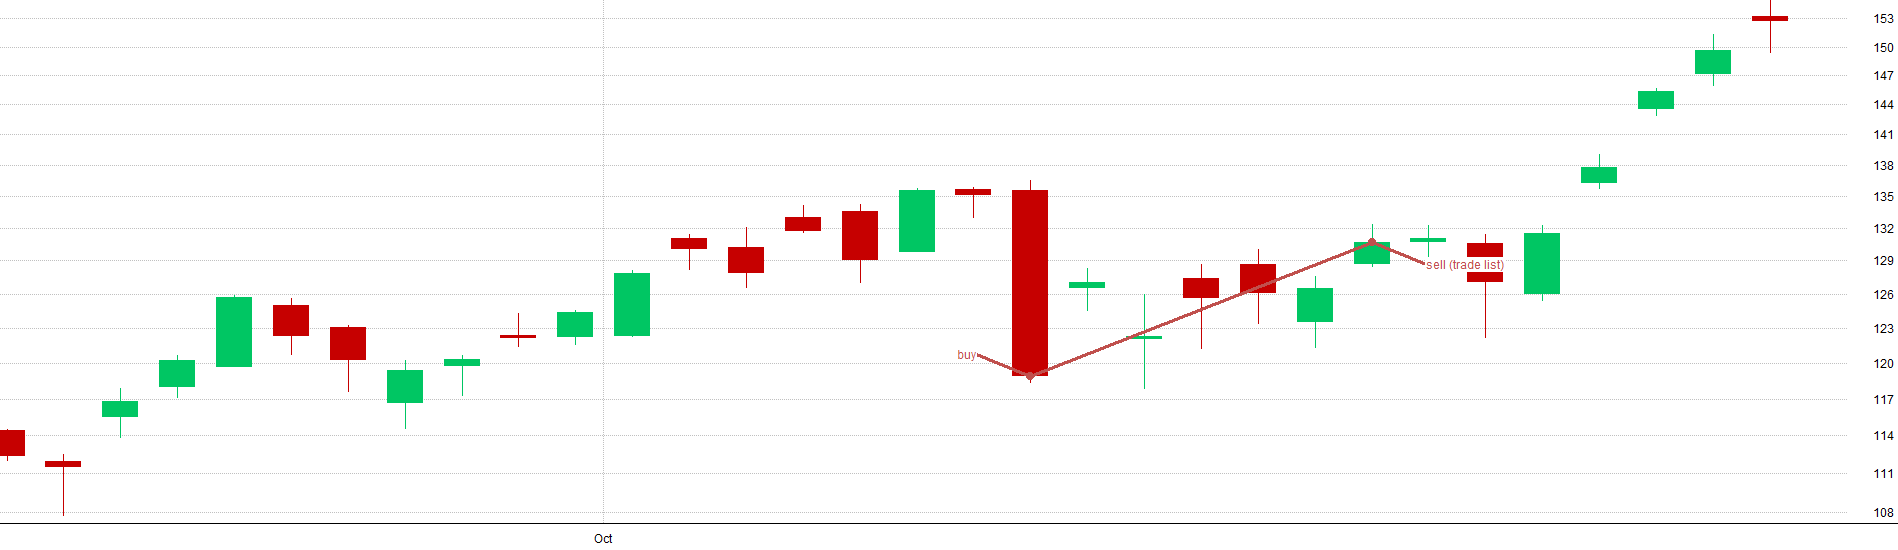

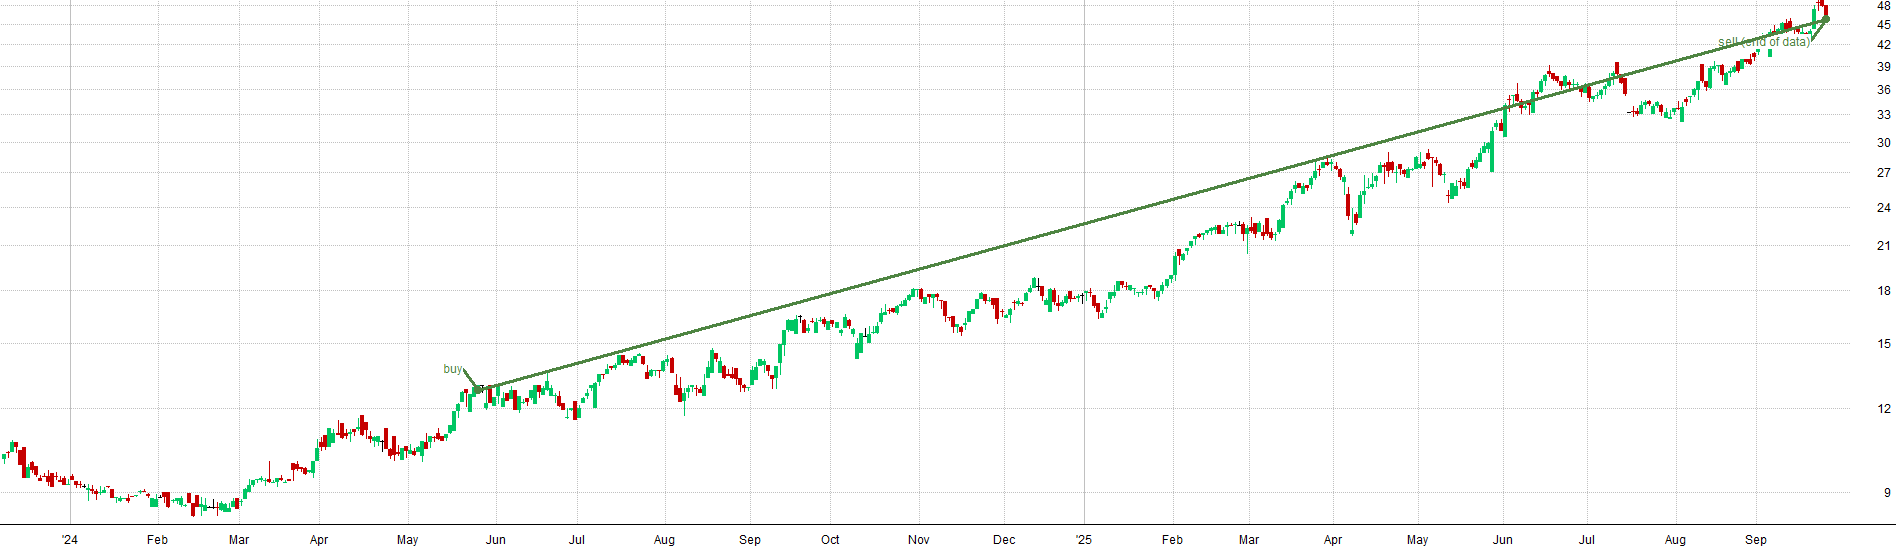


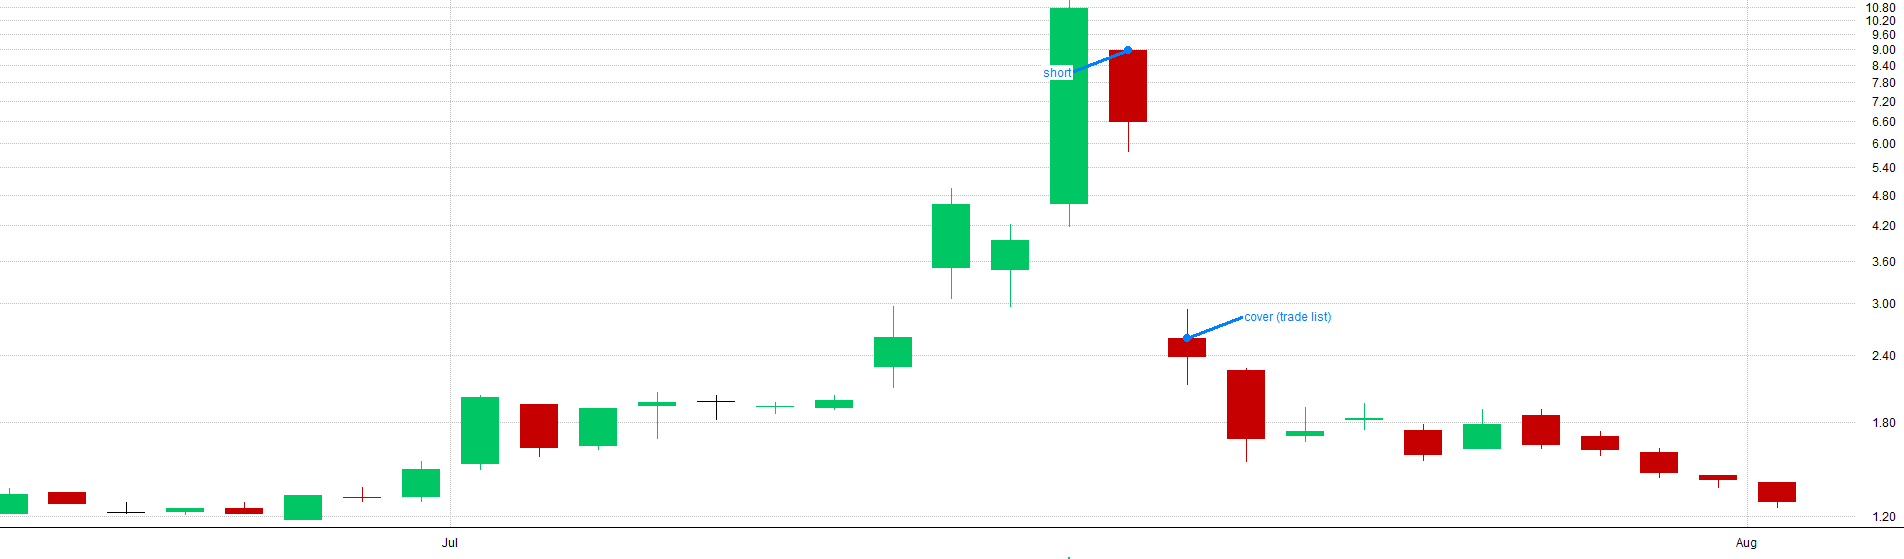

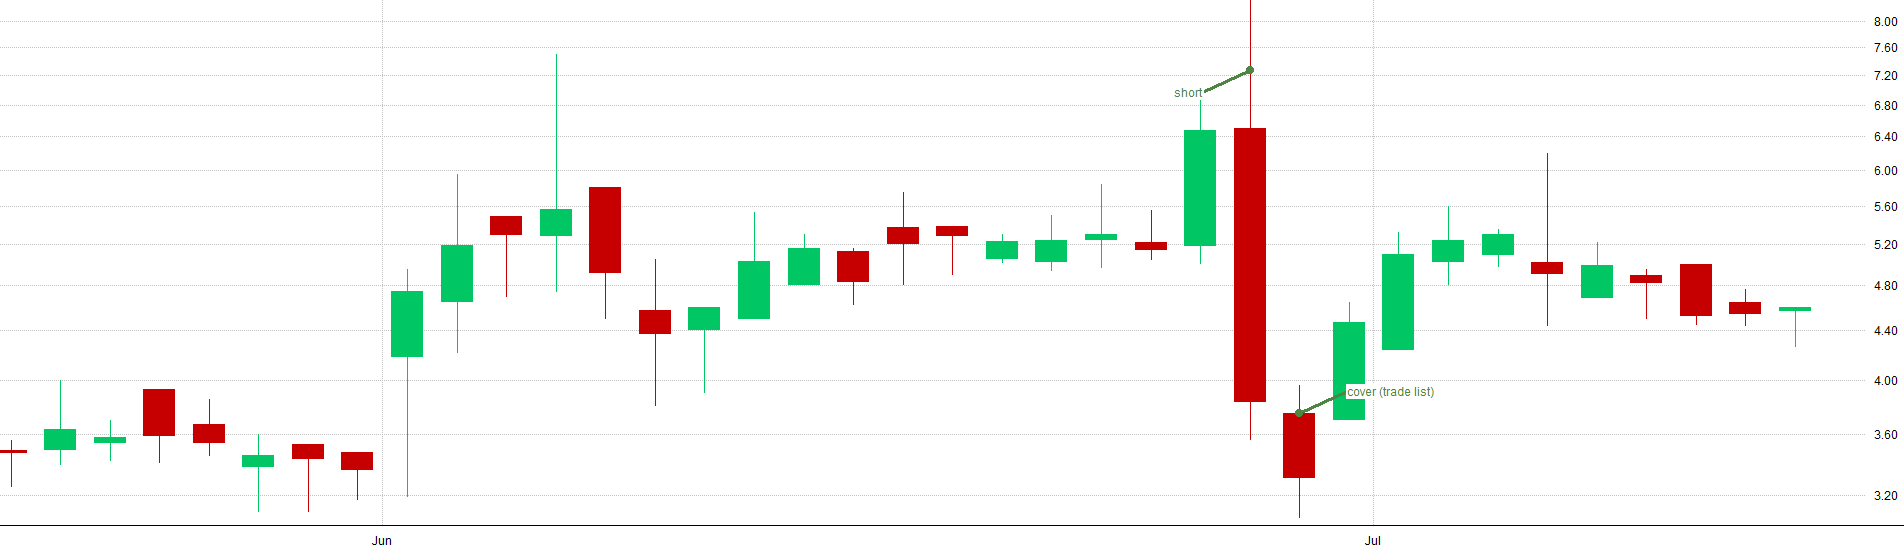
2025 Biggest Losers:


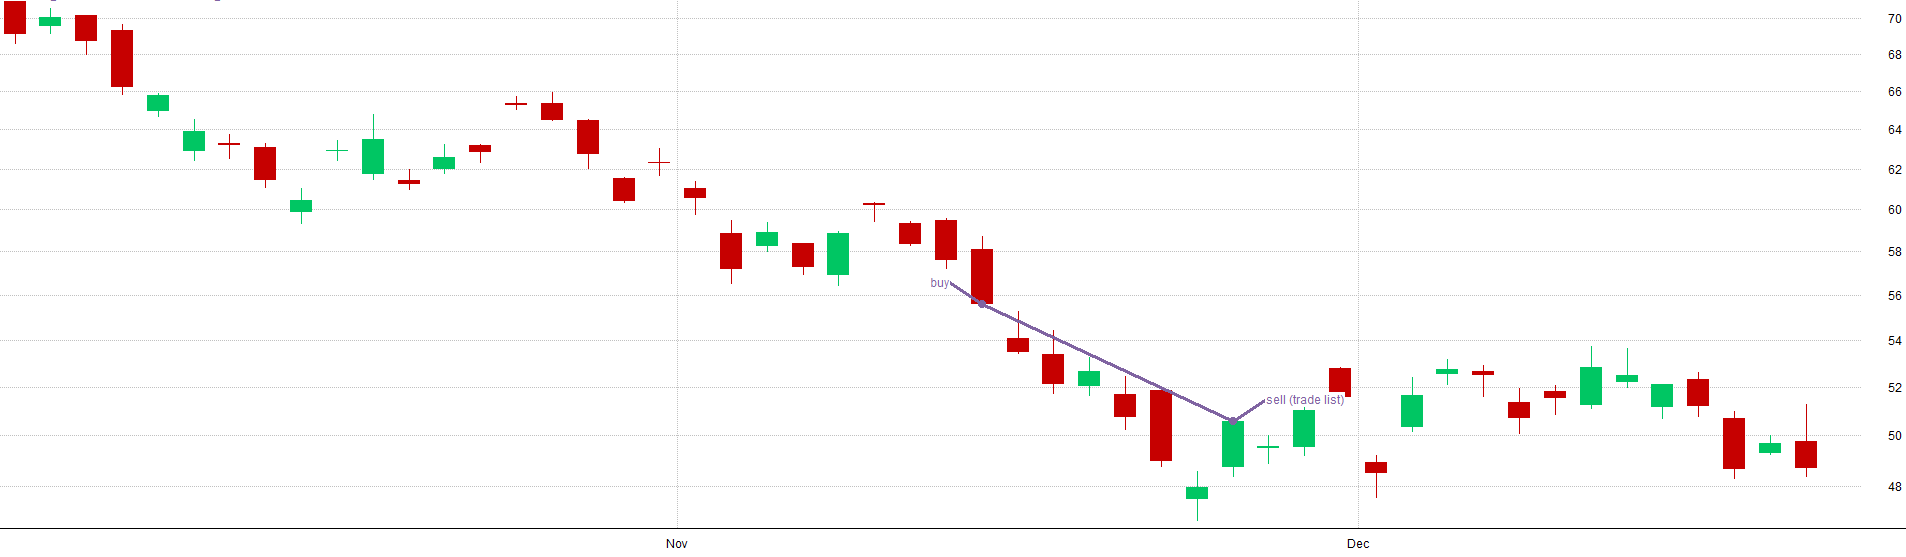

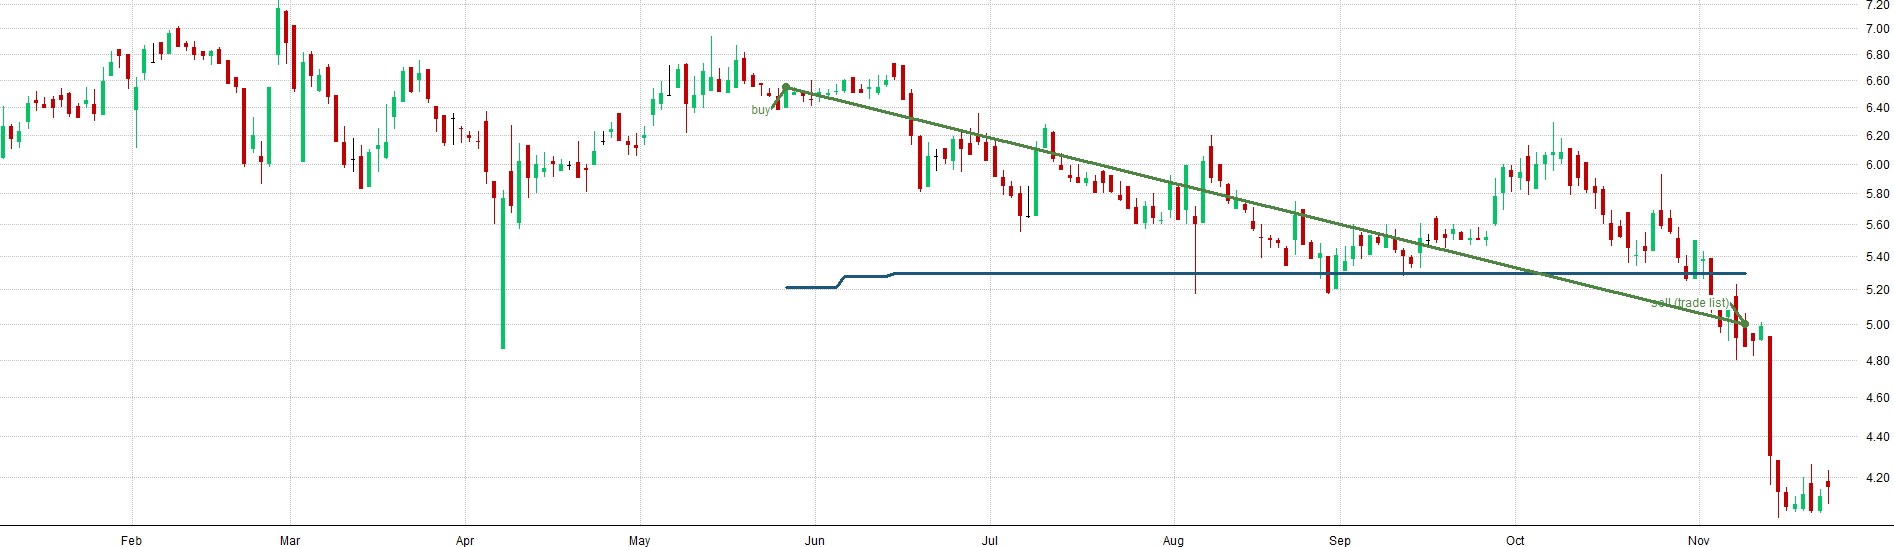

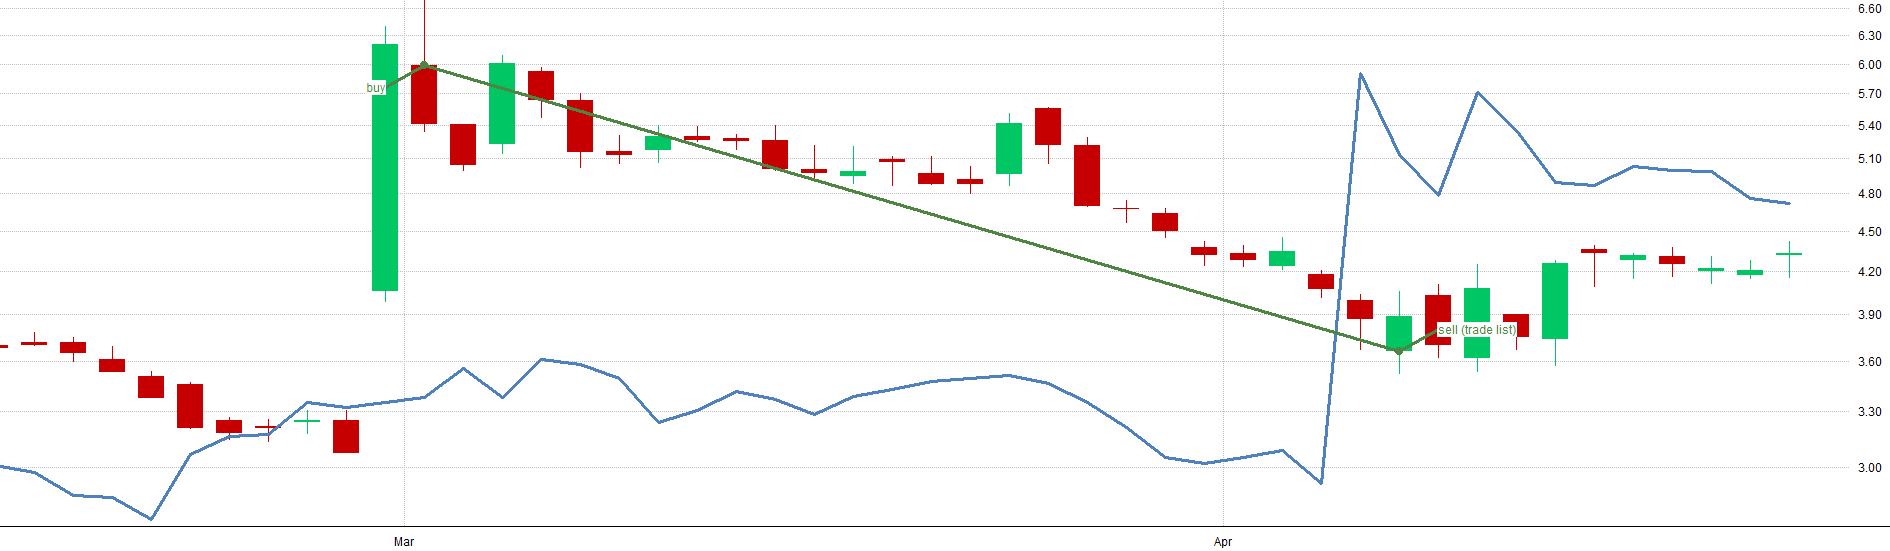

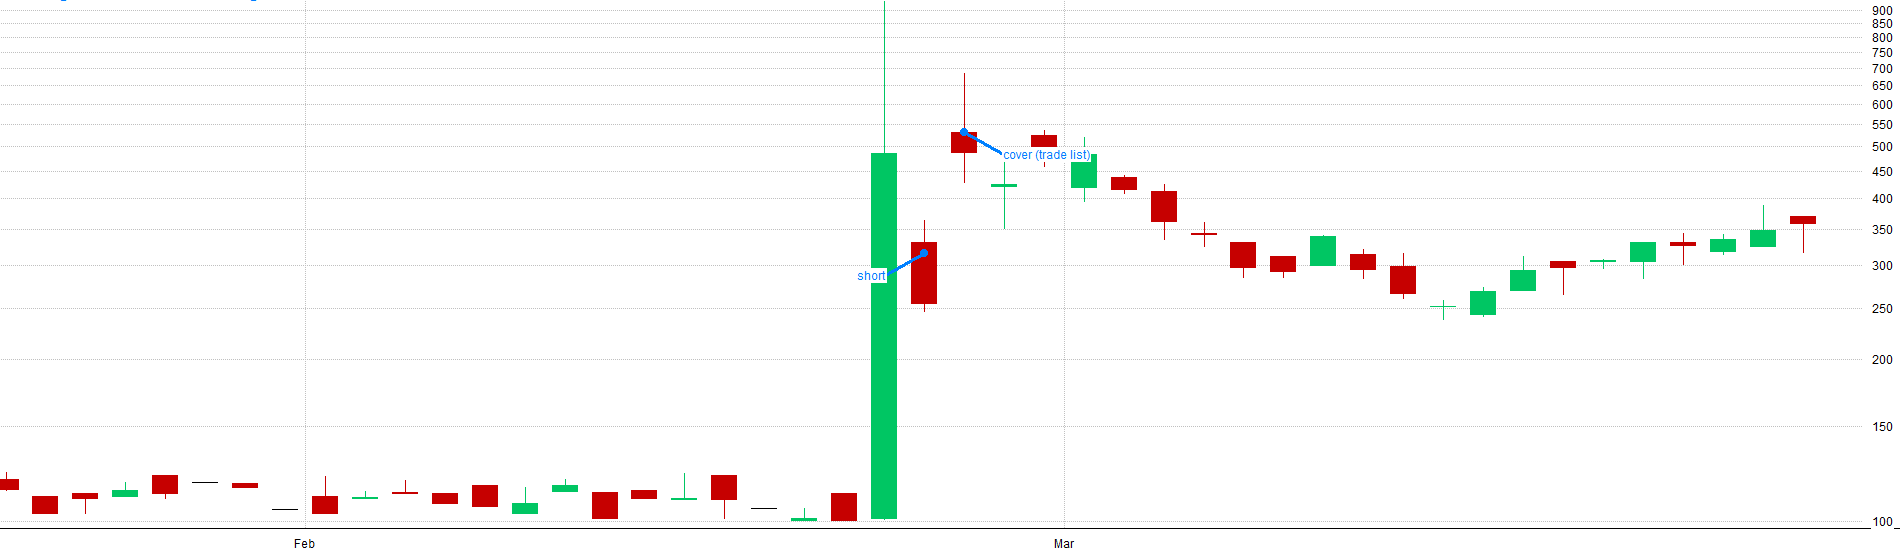

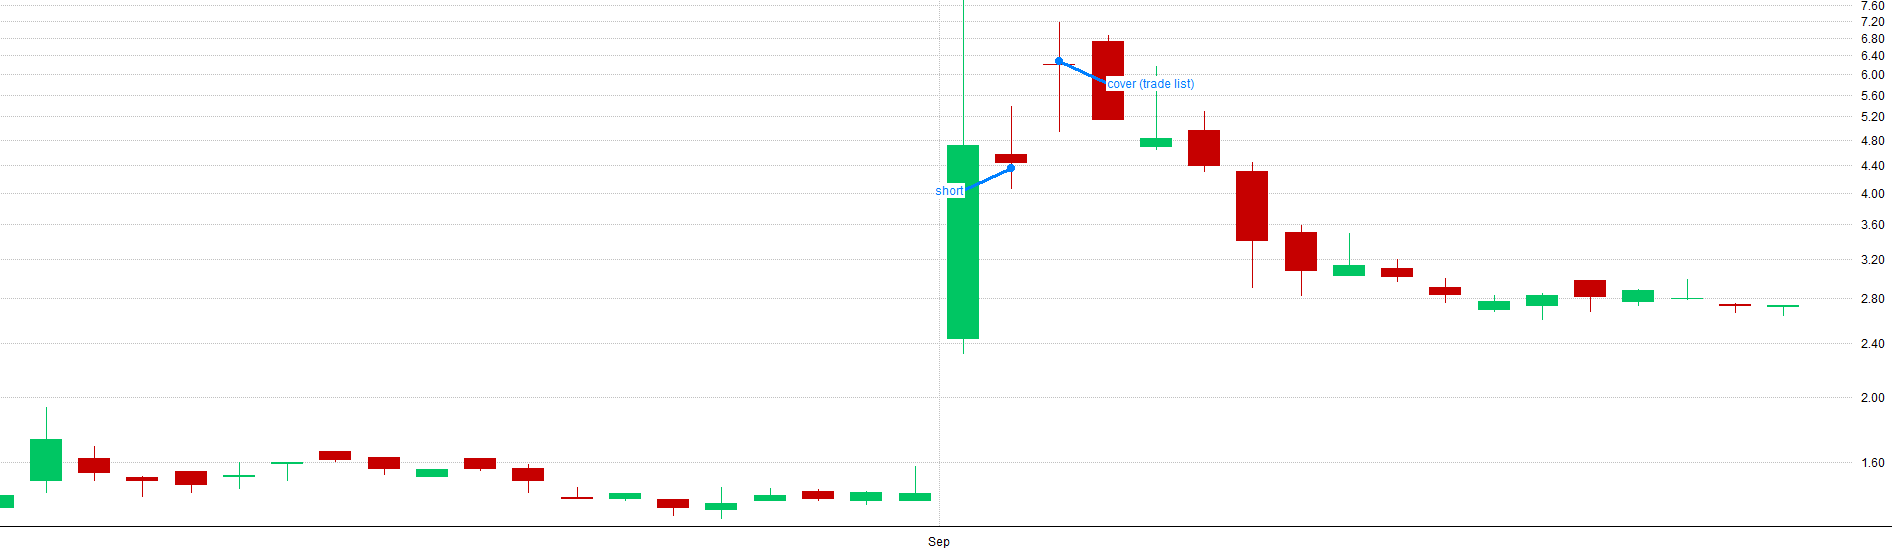

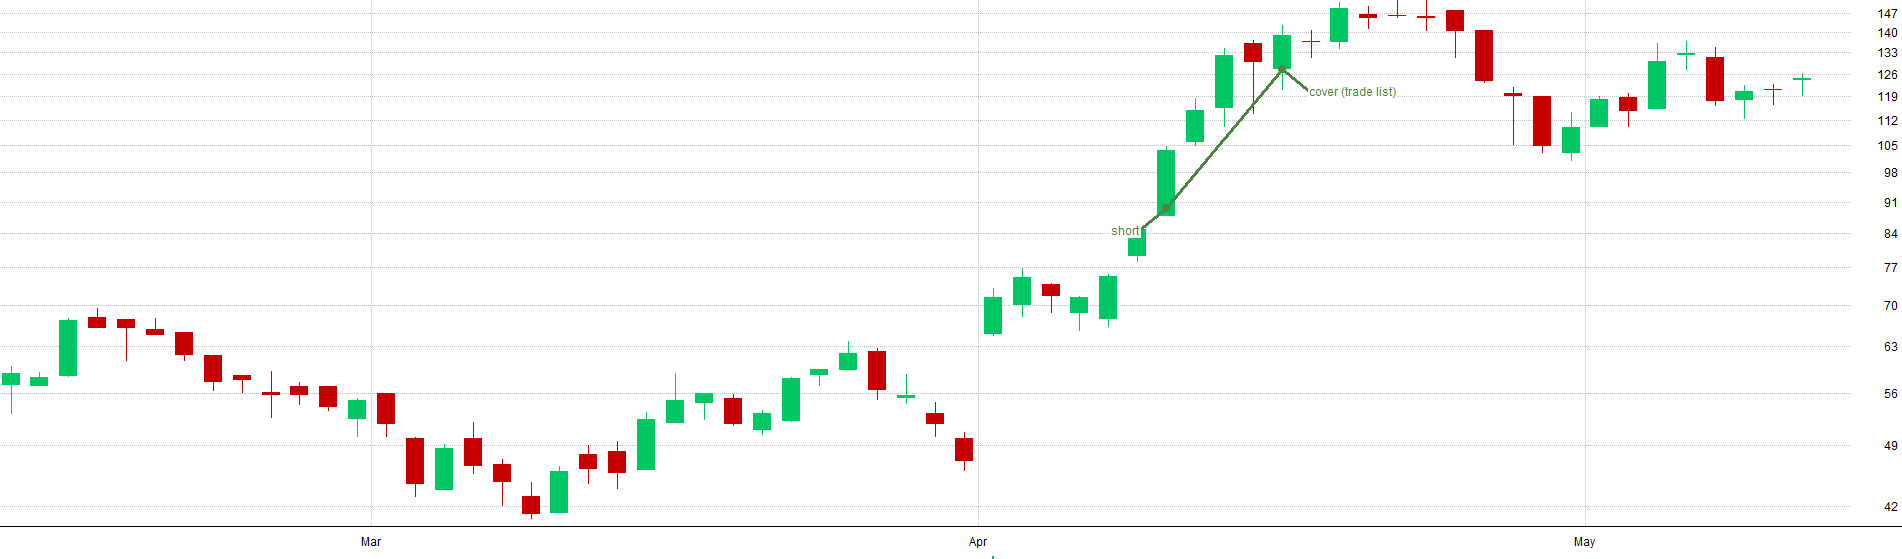

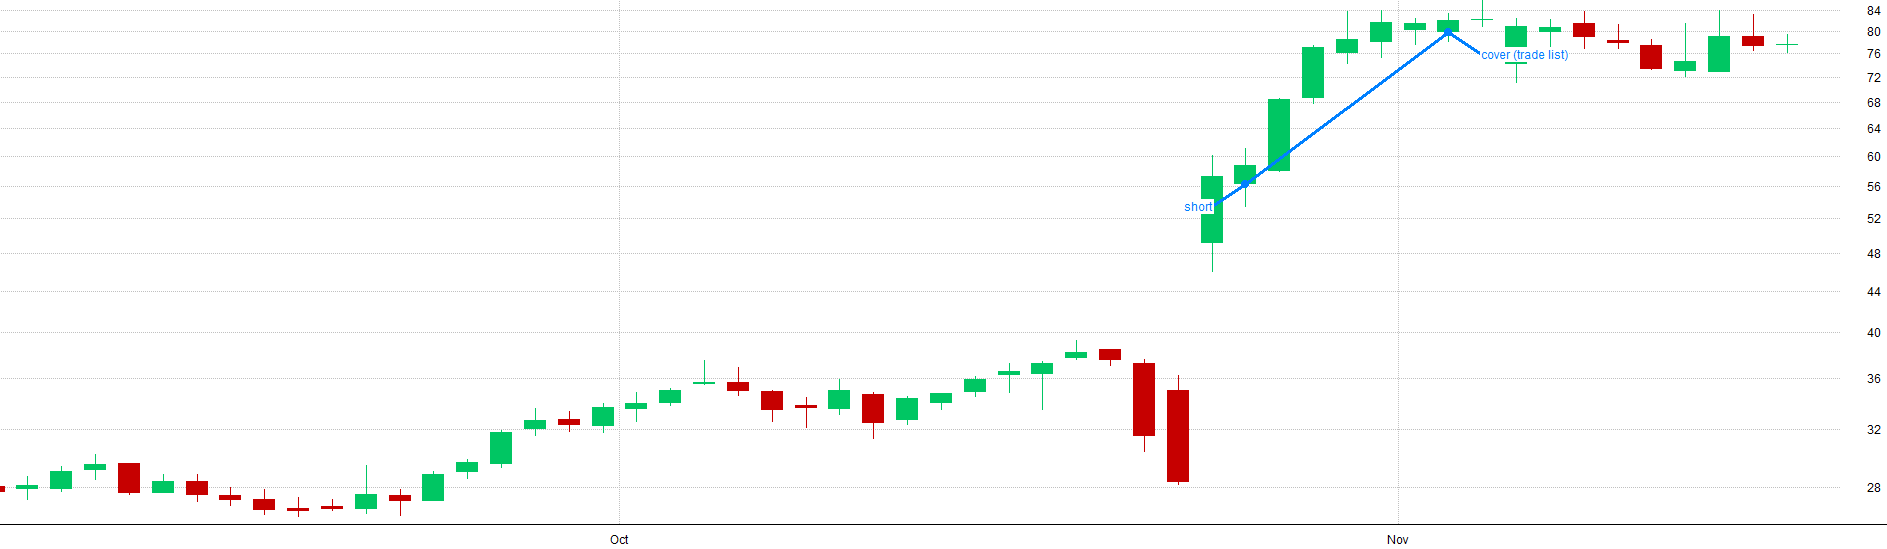
To be honest, because I run a portfolio comprised of many systems and I typically hold 140+ positions at any given time, I often don’t even know what my biggest winners or losers are until I specifically go look. I only discovered the trades listed above when I was preparing this section of the article.
Portfolio Updates Planned For 2026:
In 2026, I have some portfolio updates to implement. Some of these updates include adding new systems, changing some system allocations, and even turning some systems off.
Update #1:
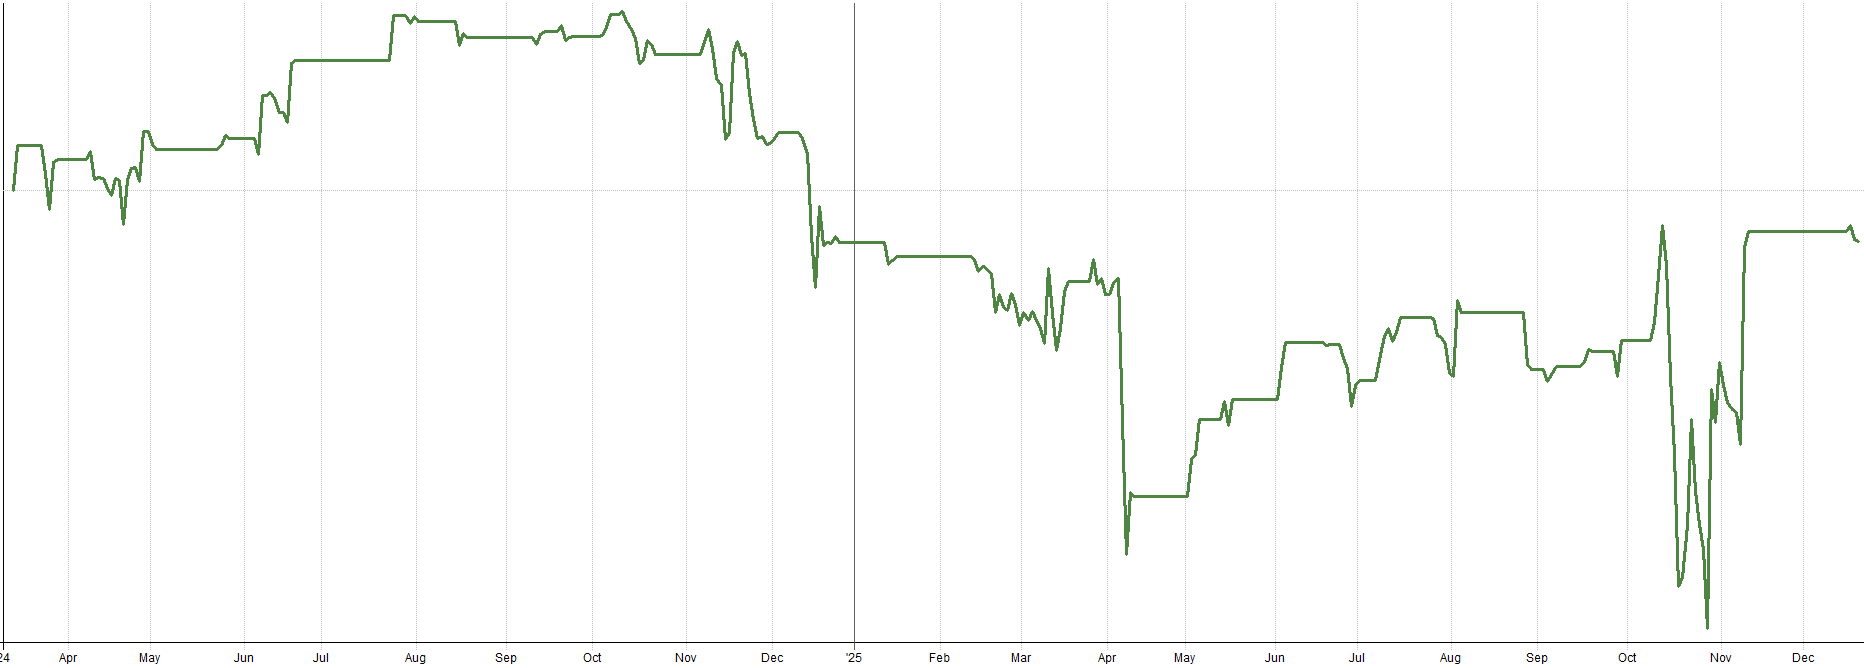
I’ll start first with the bad news. My ASX mean reversion system has not been working as well as I had hoped. Since inception in early 2024, it has just been chopping sideways.
You can see the entire system backtest below. To understand the performance degradation I am referring to, compare the performance from 2000-2023 to 2023-onwards.
Market: ASX
Type: Mean Reversion
Side: Long
Timeframe: Daily
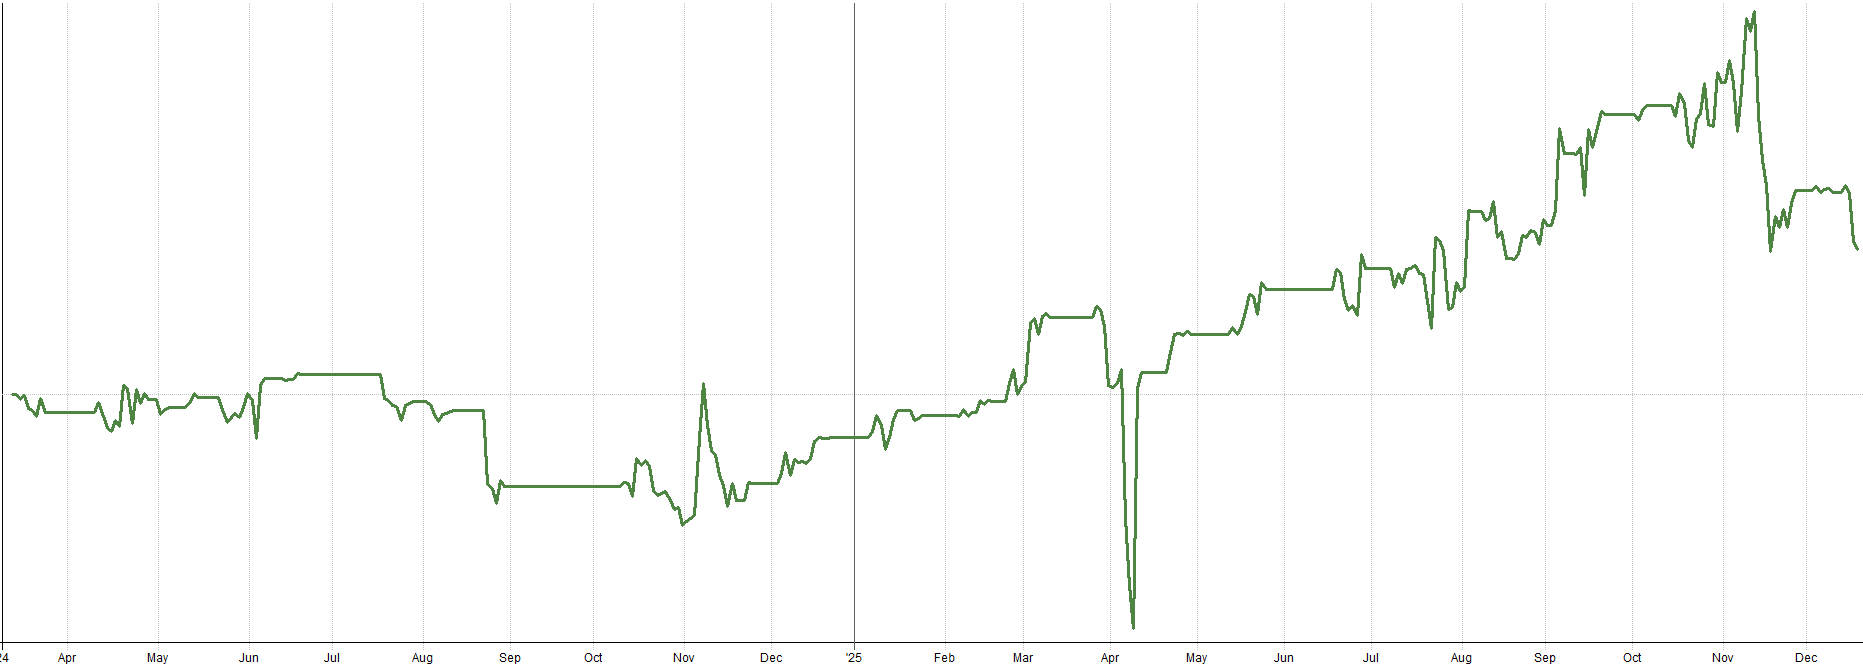
Could this system have been curve fit by me? Quite possibly. But also, the system works just fine on the TSX too. See below for this same system on the TSX market (I also trade this same system on the TSX, aside from one small tweak to the system).
Market: TSX
Type: Mean Reversion
Side: Long
Timeframe: Daily
Similar behavior occurs on the TSX as well. Recent performance has flatlined compared to historical performance. So, it could be curve fitting, it could also be the system simply doesn’t work anymore.
Either way, I am going to turn off the ASX version of this system. It is simply tying up too much capital for little to no reward. Could the system turn around? Sure it could, but it’s not worth paying the commissions waiting for that to happen. The system doesn’t return that much anyway and I have much better systems to focus my efforts on at this point.
For now, I will keep the TSX version of this system running. The TSX version seems to be turning around and starting to go back upwards. That said, the system will be on probation. I won’t hesitate to turn the TSX version of the system off if the performance starts to degrade.
This is the first system I have turned off since ~2023 (pre-2023 I had no idea what I was doing and all of my systems lost money, though you could argue I still have very little idea what I’m doing). I accept it’s part of the game. Systems fail or don’t behave as expected. At least in this case the system didn’t die in a catastrophic drawdown, but rather just sideways chop.
Update #2:
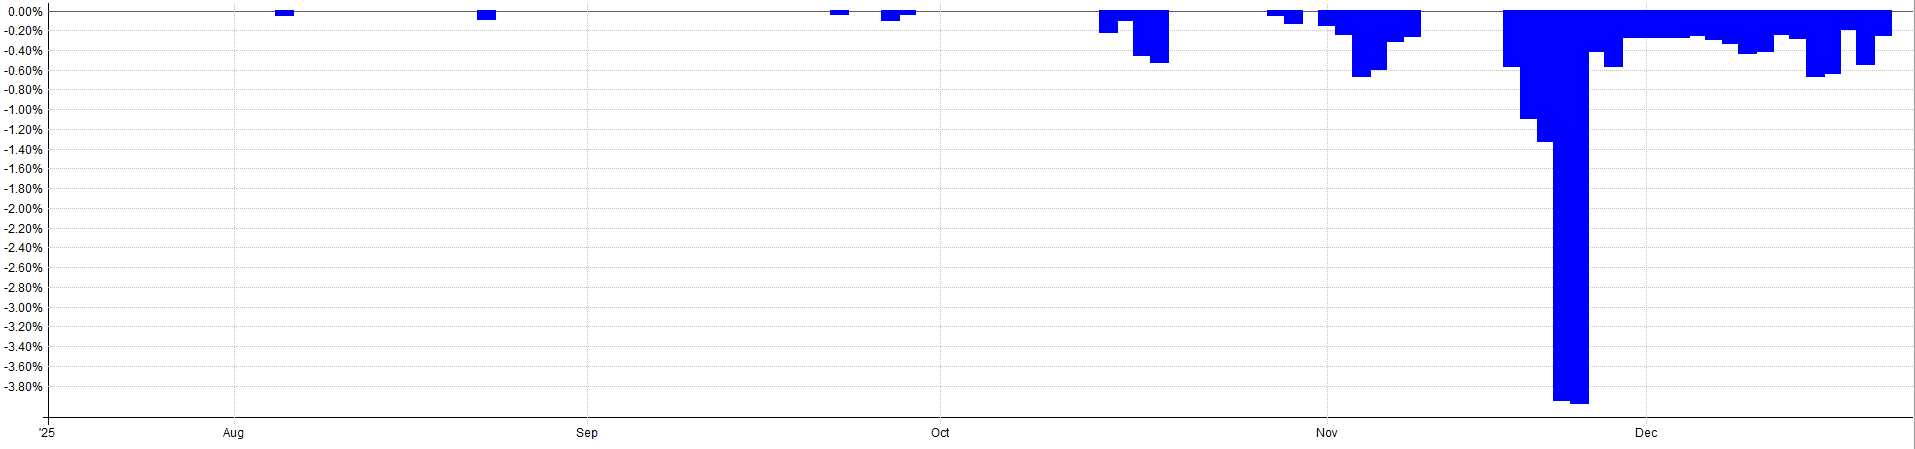
Another update I plan for 2026 is to reduce the allocation to my new mean reversion mini-portfolio. I think I was over-excited and came in hot with the initial allocation percentage. This resulted in more leverage than I care for, at least that’s what I learned the hard way.
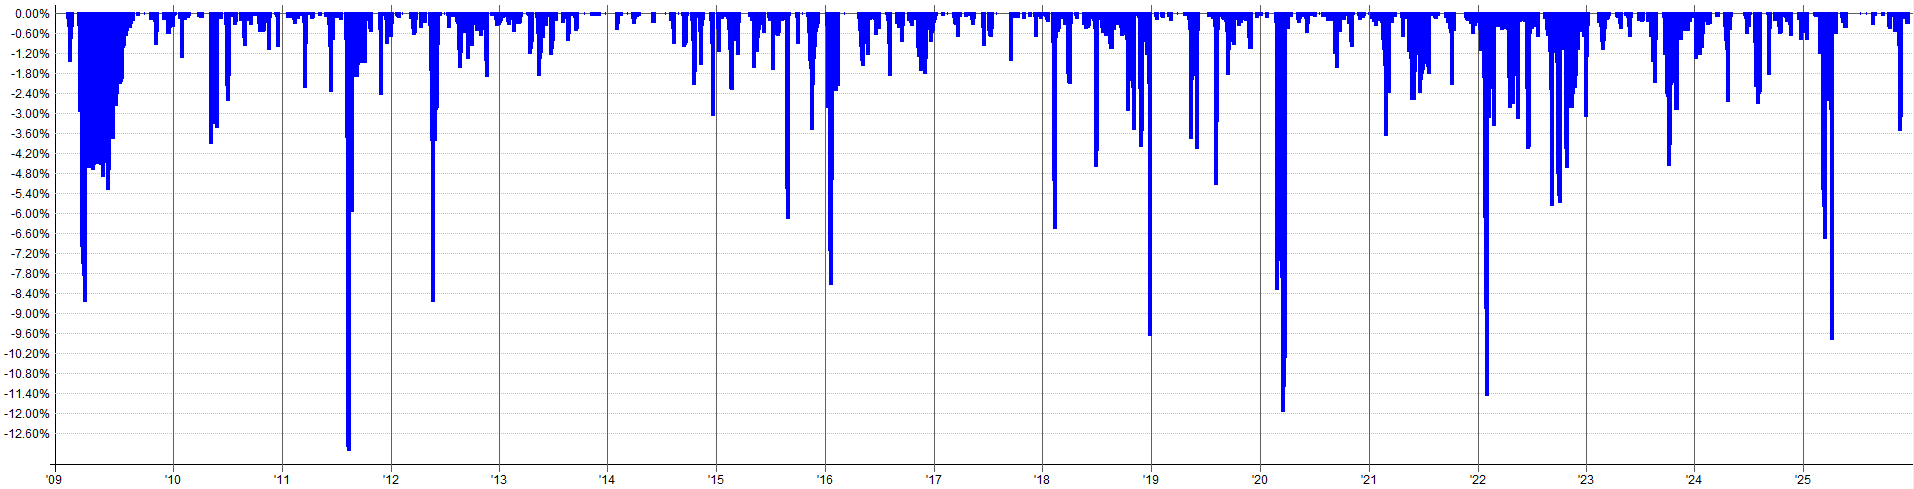
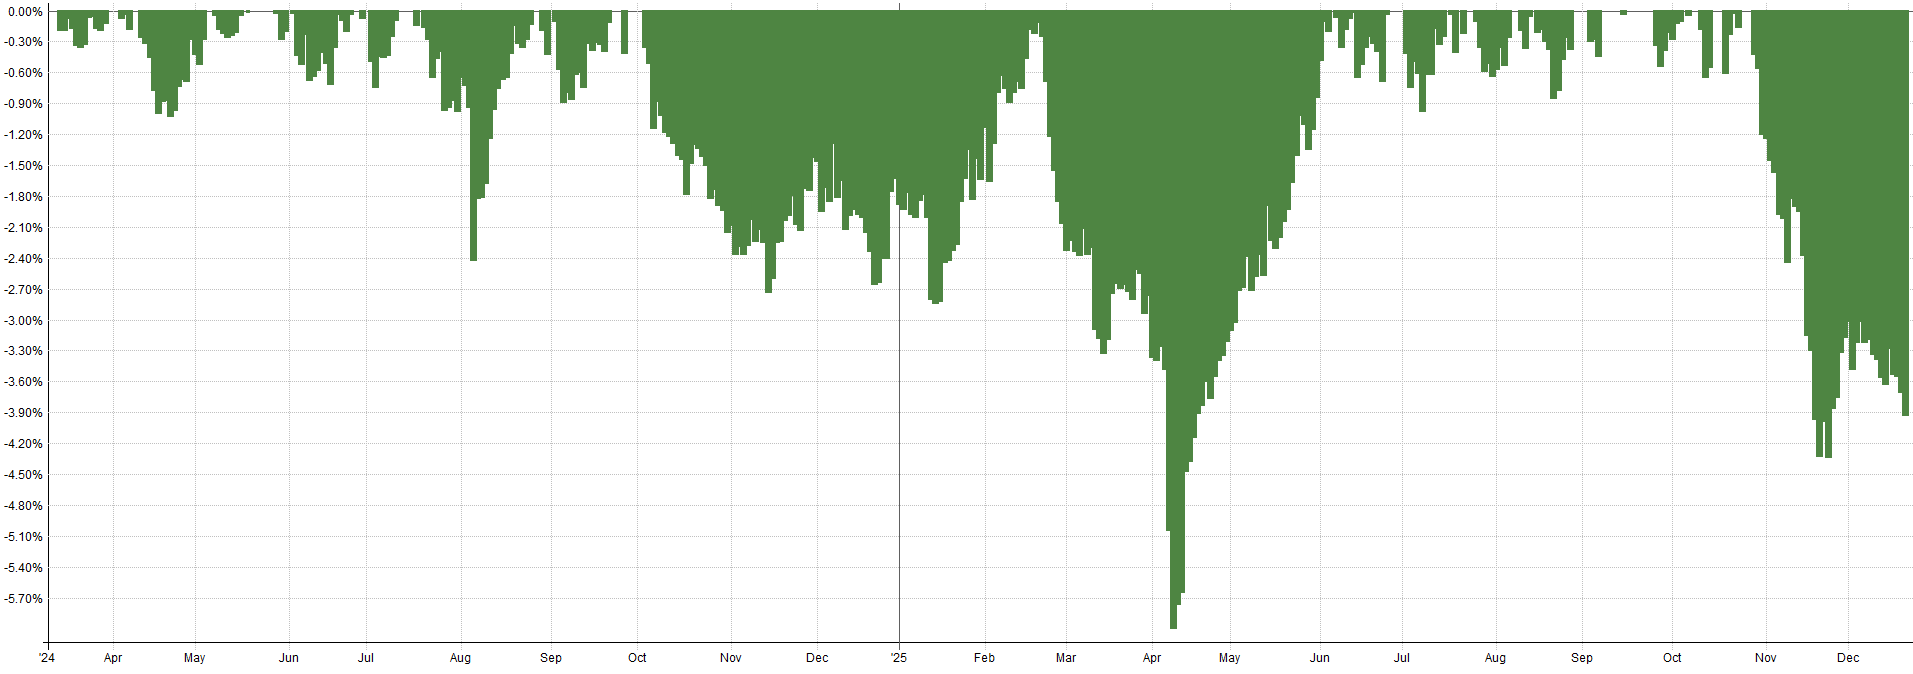
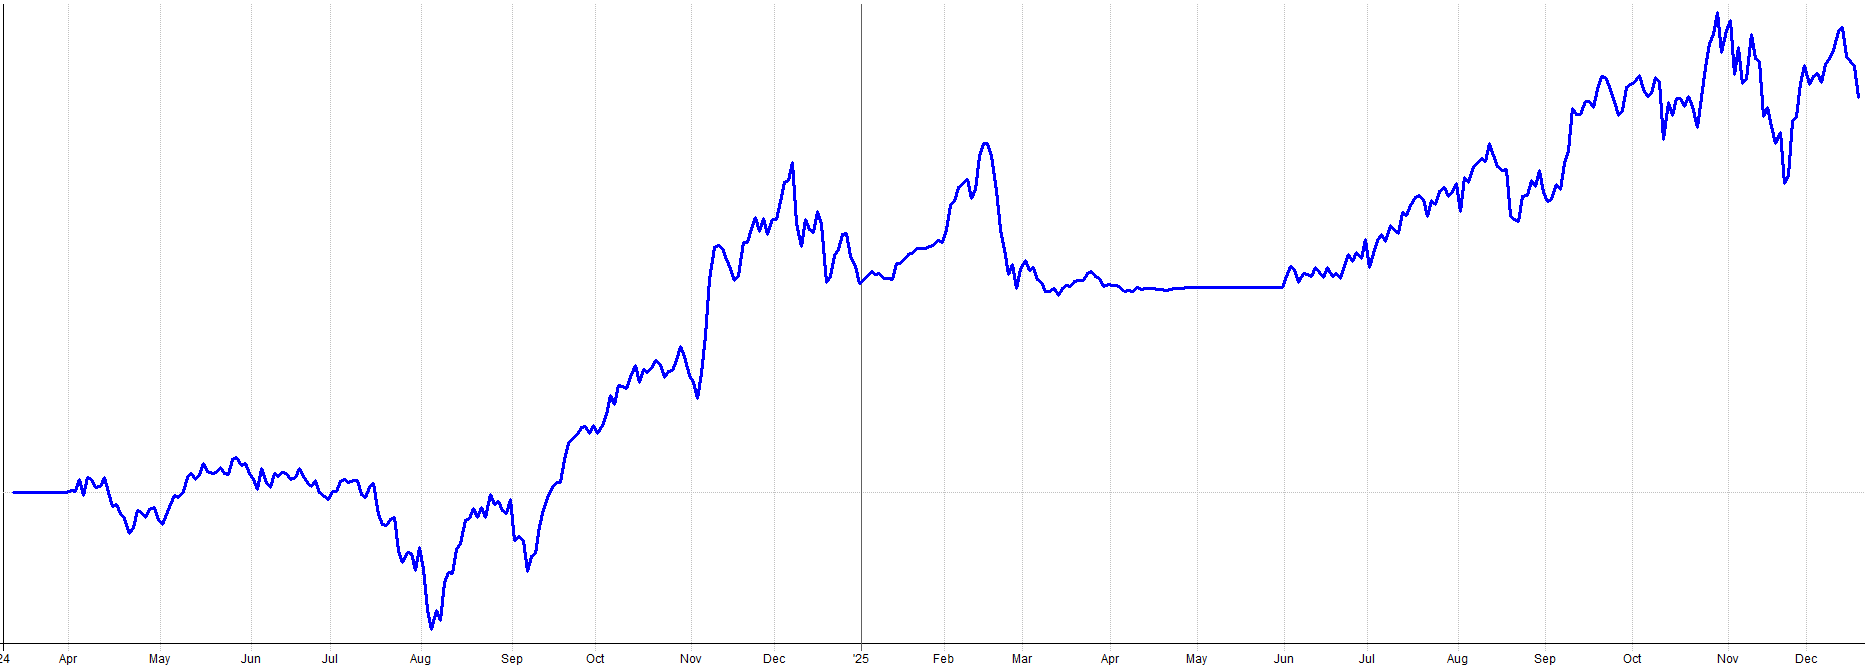
There were a few days around the end of November where I was pretty nervous about my exposure going into the weekend. I am normally unphased with my portfolio and it’s allocations, but I was holding a decent bit of leverage (150% exposure), my portfolio NLV had a ~10% drawdown overnight, and I simply was more concerned about it than I would like to be.
The best way to fix that is to simply lower some allocations to prevent this in the future.
You can actually see this -10% day on my live performance plot below, circled in red:
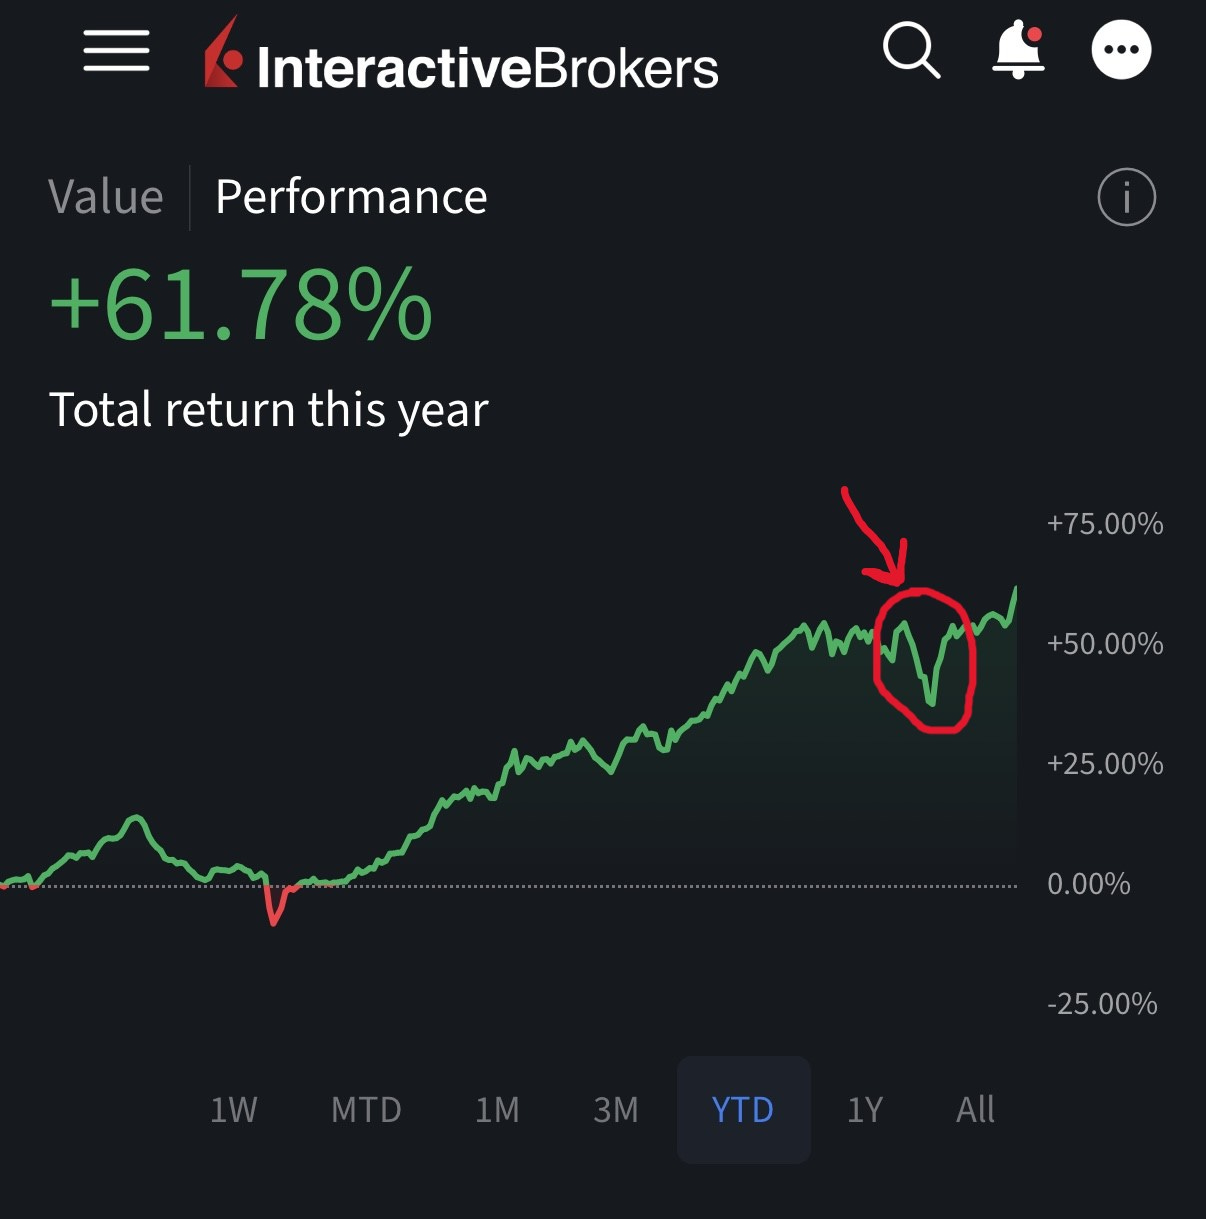
Luckily the portfolio recovered quickly, but I learned my lesson… the hard way… like I always do.
I already reduced the allocation to the mean reversion mini-portfolio a little bit this past weekend, but I will likely lower it a little more. I came out guns blazing, then scurried back into my hole with my tail tucked between my legs. I plan to not let that happen in the future.
Update #3:
One of the other areas where I plan to make some headway in 2026 is to add systems which provide more short-side and hedging exposure; as well as systems which reduce my exposure to leveraged beta. Ultimately, I would like to reduce my portfolio level correlation to the underlying market.
Hence, 2026 will be the year of exploring new strategy types on different markets or instruments than what I currently trade. I think this will give me a lot of bang for my buck. Adding more trend or momentum will add very little to my portfolio at this point.
If you have any ideas/suggestions for system concepts to explore, please let me know!
Long Term Systematic Trading Goals:
My ultimate long term goal is to be able to live off my systematic trading portfolio. Rough napkin math says I need at least a low 7-figure portfolio to be able to do this.
Currently I’m sitting in the lower half of 6-figures, so I am still very much in the building and growing phase. I’m trying to shove as much of my savings as possible into my portfolio so compounding can do its magic.
I’m an entrepreneur by heart and I dislike the corporate world with a passion. I enjoy being my own boss, making my own decisions, and being self sufficient; hence why I want to be an independent systematic trader and live off my portfolio so badly.
When I was in college and for the first year out of college, I started and operated a small landscaping business that was pulling in 5 figures a month in profit. Still to this day, I regret leaving that small business I built to go into the corporate world.
Running my own business was the most fun I ever had working. Since I treat my systematic trading like a business, I see it as no different. I want to run my trading account as my business and be the boss of the business and report to no one except myself.
Assuming a long term CAGR of 25% (my backtested portfolio CAGR sits at 35%, but let’s conservatively assume that decays a bit), if I add no more external capital to my portfolio, I could be in the 7-figure range in 8-9 years.
But, if I work hard, save hard, and keep adding capital to the portfolio, I could be in the 7-figure range as early as 6-7 years.
Either way, I still have a bit of runway to go before I have a chance at living off my portfolio; and until I get there I’m going to be treating my systematic trading account like a savings account.
One big gap in my systematic trading portfolio is the ability to profit in bear markets and during market shocks. I do have some hedging systems within the portfolio that do this, but I want more. I’m very long bias, which is fine as equities tend to drift up over time, but I need to be more prepared for less friendly market environments.
Sitting in cash and/or massive drawdown because of a large market crash next year would elongate the time until I can live off my systematic trading portfolio. Hence, in 2026 I’ll be focusing on researching new trading systems so that I am more prepared for less favorable market conditions, and to reduce my leveraged beta exposure.
Non-Trading Related Wins In 2025:
I figure I could share a few things non-trading related which were positive expectancy that happened to me in 2025.
During the first 6 months of 2025, I lost 50 pounds. I do the typical bulk-cut cycle that lifters tend to do. Though this last bulk lasted 3 years, so I added some fluffiness.
I spent January thru July losing all that weight, dropping from 225 lbs back down to a healthy and lean 175 lbs. My blood pressure and other health metrics have all improved and I feel fantastic at 175 lbs compared to 225 lbs, where I felt slow and sluggish.
Another positive outcome for me was I just learned I had the highest performance rating on my team at my day job. That should result in a healthy raise and bonus next year, and you better believe that’s all going into the systematic trading account.
Though I want to be a self sufficient systematic trader and not be in the corporate world forever, I do recognize the importance of performing well at my job during this time of building my trading account. I focus on performing well at the day job because that income fuels my systematic trading and allows the account to grow even faster.
Conclusion:
Wrapping up 2025, I have to say this has been my strongest year yet, both in terms of portfolio performance and the progress I’ve made in building something robust and sustainable.
What I am the most excited about this year is I finally feel like I’ve developed a mean reversion approach that actually feels right for me. Although I had some leverage lessons learned the hard way, that’s just part of the iterative learning and improvement process.
I can’t complain about the performance of the portfolio at all, this year has been fantastic. Fingers crossed performance continues into 2026. But realistically, I’d be happy with half the performance I had this year.
In 2026 I plan to continue to evolve the portfolio. I’ll be turning off some underperforming strategies, fixing some system allocations, and most importantly, researching and developing new strategies that reduce my exposure to leveraged beta. If you have any suggestions on what ideas I should focus on, seriously DM me or comment below; I’m all ears.
Ultimately, I’m still in the building phase; both in terms of developing more systems and trying to compound my account. It’s going to take a lot of patience, discipline, and a likely 7+ more years of smart iterations and development, but I am finally starting to feel like I’m walking down the right path, or at least walking in the right general direction.
Thanks for reading and please feel free to provide any thoughts or feedback, I’m always happy to learn and consider new ideas/methods.
Thanks for sharing. Are you planning to manage money for others and build a track record? Please DM me if you have any interest in this.
Thanks for the post, and congrats on the great results.
I have a question regarding higher time-frame strategies (daily/weekly/monthly). I’ve noticed that many traders (including you) successfully run systems on these time frames, but I’m trying to better understand the backtesting and validation process.
When trading on higher time frames, a 10–20 year backtest often results in only 100–300 trades (aka statistically insignificant). How do you evaluate and gain confidence in a strategy with such a limited sample size?
Do you rely less on statistical significance in these cases and more on structural or economic reasoning behind the strategy? I’d be very interested to hear your perspective 🙏